
Part 3: Using quantitative methods
11. Quantitative measurement
Chapter Outline
- Conceptual definitions (17 minute read)
- Operational definitions (36 minute read)
- Measurement quality (21 minute read)
- Ethical and social justice considerations (15 minute read)
Content warning: examples in this chapter contain references to ethnocentrism, toxic masculinity, racism in science, drug use, mental health and depression, psychiatric inpatient care, poverty and basic needs insecurity, pregnancy, and racism and sexism in the workplace and higher education.
11.1 Conceptual definitions
Learning Objectives
Learners will be able to…
- Define measurement and conceptualization
- Apply Kaplan’s three categories to determine the complexity of measuring a given variable
- Identify the role previous research and theory play in defining concepts
- Distinguish between unidimensional and multidimensional concepts
- Critically apply reification to how you conceptualize the key variables in your research project
In social science, when we use the term , we mean the process by which we describe and ascribe meaning to the key facts, concepts, or other phenomena that we are investigating. At its core, measurement is about defining one’s terms in as clear and precise a way as possible. Of course, measurement in social science isn’t quite as simple as using a measuring cup or spoon, but there are some basic tenets on which most social scientists agree when it comes to measurement. We’ll explore those, as well as some of the ways that measurement might vary depending on your unique approach to the study of your topic.
An important point here is that measurement does not require any particular instruments or procedures. What it does require is a systematic procedure for assigning scores, meanings, and descriptions to individuals or objects so that those scores represent the characteristic of interest. You can measure phenomena in many different ways, but you must be sure that how you choose to measure gives you information and data that lets you answer your research question. If you’re looking for information about a person’s income, but your main points of measurement have to do with the money they have in the bank, you’re not really going to find the information you’re looking for!
The question of what social scientists measure can be answered by asking yourself what social scientists study. Think about the topics you’ve learned about in other social work classes you’ve taken or the topics you’ve considered investigating yourself. Let’s consider Melissa Milkie and Catharine Warner’s study (2011)[1] of first graders’ mental health. In order to conduct that study, Milkie and Warner needed to have some idea about how they were going to measure mental health. What does mental health mean, exactly? And how do we know when we’re observing someone whose mental health is good and when we see someone whose mental health is compromised? Understanding how measurement works in research methods helps us answer these sorts of questions.
As you might have guessed, social scientists will measure just about anything that they have an interest in investigating. For example, those who are interested in learning something about the correlation between social class and levels of happiness must develop some way to measure both social class and happiness. Those who wish to understand how well immigrants cope in their new locations must measure immigrant status and coping. Those who wish to understand how a person’s gender shapes their workplace experiences must measure gender and workplace experiences (and get more specific about which experiences are under examination). You get the idea. Social scientists can and do measure just about anything you can imagine observing or wanting to study. Of course, some things are easier to observe or measure than others.

Observing your variables
In 1964, philosopher Abraham Kaplan (1964)[2] wrote The Conduct of Inquiry, which has since become a classic work in research methodology (Babbie, 2010).[3] In his text, Kaplan describes different categories of things that behavioral scientists observe. One of those categories, which Kaplan called “observational terms,” is probably the simplest to measure in social science. are the sorts of things that we can see with the naked eye simply by looking at them. Kaplan roughly defines them as conditions that are easy to identify and verify through direct observation. If, for example, we wanted to know how the conditions of playgrounds differ across different neighborhoods, we could directly observe the variety, amount, and condition of equipment at various playgrounds.
, on the other hand, are less straightforward to assess. In Kaplan’s framework, they are conditions that are subtle and complex that we must use existing knowledge and intuition to define. If we conducted a study for which we wished to know a person’s income, we’d probably have to ask them their income, perhaps in an interview or a survey. Thus, we have observed income, even if it has only been observed indirectly. Birthplace might be another indirect observable. We can ask study participants where they were born, but chances are good we won’t have directly observed any of those people being born in the locations they report.
Sometimes the measures that we are interested in are more complex and more abstract than observational terms or indirect observables. Think about some of the concepts you’ve learned about in other social work classes—for example, ethnocentrism. What is ethnocentrism? Well, from completing an introduction to social work class you might know that it has something to do with the way a person judges another’s culture. But how would you measure it? Here’s another construct: bureaucracy. We know this term has something to do with organizations and how they operate but measuring such a construct is trickier than measuring something like a person’s income. The theoretical concepts of ethnocentrism and bureaucracy represent ideas whose meanings we have come to agree on. Though we may not be able to observe these abstractions directly, we can observe their components.
Kaplan referred to these more abstract things that behavioral scientists measure as constructs. are “not observational either directly or indirectly” (Kaplan, 1964, p. 55),[4] but they can be defined based on observables. For example, the construct of bureaucracy could be measured by counting the number of supervisors that need to approve routine spending by public administrators. The greater the number of administrators that must sign off on routine matters, the greater the degree of bureaucracy. Similarly, we might be able to ask a person the degree to which they trust people from different cultures around the world and then assess the ethnocentrism inherent in their answers. We can measure constructs like bureaucracy and ethnocentrism by defining them in terms of what we can observe.[5]
The idea of coming up with your own measurement tool might sound pretty intimidating at this point. The good news is that if you find something in the literature that works for you, you can use it (with proper attribution, of course). If there are only pieces of it that you like, you can reuse those pieces (with proper attribution and describing/justifying any changes). You don’t always have to start from scratch!
Exercises
Look at the variables in your research question.
- Classify them as direct observables, indirect observables, or constructs.
- Do you think measuring them will be easy or hard?
- What are your first thoughts about how to measure each variable? No wrong answers here, just write down a thought about each variable.

Measurement starts with conceptualization
In order to measure the concepts in your research question, we first have to understand what we think about them. As an aside, the word concept has come up quite a bit, and it is important to be sure we have a shared understanding of that term. A is the notion or image that we conjure up when we think of some cluster of related observations or ideas. For example, masculinity is a concept. What do you think of when you hear that word? Presumably, you imagine some set of behaviors and perhaps even a particular style of self-presentation. Of course, we can’t necessarily assume that everyone conjures up the same set of ideas or images when they hear the word masculinity. While there are many possible ways to define the term and some may be more common or have more support than others, there is no universal definition of masculinity. What counts as masculine may shift over time, from culture to culture, and even from individual to individual (Kimmel, 2008). This is why defining our concepts is so important.\
Not all researchers clearly explain their theoretical or conceptual framework for their study, but they should! Without understanding how a researcher has defined their key concepts, it would be nearly impossible to understand the meaning of that researcher’s findings and conclusions. Back in Chapter 7, you developed a theoretical framework for your study based on a survey of the theoretical literature in your topic area. If you haven’t done that yet, consider flipping back to that section to familiarize yourself with some of the techniques for finding and using theories relevant to your research question. Continuing with our example on masculinity, we would need to survey the literature on theories of masculinity. After a few queries on masculinity, I found a wonderful article by Wong (2010)[6] that analyzed eight years of the journal Psychology of Men & Masculinity and analyzed how often different theories of masculinity were used. Not only can I get a sense of which theories are more accepted and which are more marginal in the social science on masculinity, I am able to identify a range of options from which I can find the theory or theories that will inform my project.
Exercises
Identify a specific theory (or more than one theory) and how it helps you understand…
- Your independent variable(s).
- Your dependent variable(s).
- The relationship between your independent and dependent variables.
Rather than completing this exercise from scratch, build from your theoretical or conceptual framework developed in previous chapters.
In quantitative methods, involves writing out clear, concise definitions for our key concepts. These are the kind of definitions you are used to, like the ones in a dictionary. A conceptual definition involves defining a concept in terms of other concepts, usually by making reference to how other social scientists and theorists have defined those concepts in the past. Of course, new conceptual definitions are created all the time because our conceptual understanding of the world is always evolving.
Conceptualization is deceptively challenging—spelling out exactly what the concepts in your research question mean to you. Following along with our example, think about what comes to mind when you read the term masculinity. How do you know masculinity when you see it? Does it have something to do with men or with social norms? If so, perhaps we could define masculinity as the social norms that men are expected to follow. That seems like a reasonable start, and at this early stage of conceptualization, brainstorming about the images conjured up by concepts and playing around with possible definitions is appropriate. However, this is just the first step. At this point, you should be beyond brainstorming for your key variables because you have read a good amount of research about them
In addition, we should consult previous research and theory to understand the definitions that other scholars have already given for the concepts we are interested in. This doesn’t mean we must use their definitions, but understanding how concepts have been defined in the past will help us to compare our conceptualizations with how other scholars define and relate concepts. Understanding prior definitions of our key concepts will also help us decide whether we plan to challenge those conceptualizations or rely on them for our own work. Finally, working on conceptualization is likely to help in the process of refining your research question to one that is specific and clear in what it asks. Conceptualization and operationalization (next section) are where “the rubber meets the road,” so to speak, and you have to specify what you mean by the question you are asking. As your conceptualization deepens, you will often find that your research question becomes more specific and clear.
If we turn to the literature on masculinity, we will surely come across work by Michael Kimmel, one of the preeminent masculinity scholars in the United States. After consulting Kimmel’s prior work (2000; 2008),[7] we might tweak our initial definition of masculinity. Rather than defining masculinity as “the social norms that men are expected to follow,” perhaps instead we’ll define it as “the social roles, behaviors, and meanings prescribed for men in any given society at any one time” (Kimmel & Aronson, 2004, p. 503).[8] Our revised definition is more precise and complex because it goes beyond addressing one aspect of men’s lives (norms), and addresses three aspects: roles, behaviors, and meanings. It also implies that roles, behaviors, and meanings may vary across societies and over time. Using definitions developed by theorists and scholars is a good idea, though you may find that you want to define things your own way.
As you can see, conceptualization isn’t as simple as applying any random definition that we come up with to a term. Defining our terms may involve some brainstorming at the very beginning. But conceptualization must go beyond that, to engage with or critique existing definitions and conceptualizations in the literature. Once we’ve brainstormed about the images associated with a particular word, we should also consult prior work to understand how others define the term in question. After we’ve identified a clear definition that we’re happy with, we should make sure that every term used in our definition will make sense to others. Are there terms used within our definition that also need to be defined? If so, our conceptualization is not yet complete. Our definition includes the concept of “social roles,” so we should have a definition for what those mean and become familiar with role theory to help us with our conceptualization. If we don’t know what roles are, how can we study them?
Let’s say we do all of that. We have a clear definition of the term masculinity with reference to previous literature and we also have a good understanding of the terms in our conceptual definition…then we’re done, right? Not so fast. You’ve likely met more than one man in your life, and you’ve probably noticed that they are not the same, even if they live in the same society during the same historical time period. This could mean there are dimensions of masculinity. In terms of social scientific measurement, concepts can be said to have when there are multiple elements that make up a single concept. With respect to the term masculinity, dimensions could based on gender identity, gender performance, sexual orientation, etc.. In any of these cases, the concept of masculinity would be considered to have multiple dimensions.
While you do not need to spell out every possible dimension of the concepts you wish to measure, it is important to identify whether your concepts are (and therefore relatively easy to define and measure) or multidimensional (and therefore require multi-part definitions and measures). In this way, how you conceptualize your variables determines how you will measure them in your study. Unidimensional concepts are those that are expected to have a single underlying dimension. These concepts can be measured using a single measure or test. Examples include simple concepts such as a person’s weight, time spent sleeping, and so forth.
One frustrating this is that there is no clear demarcation between concepts that are inherently unidimensional or multidimensional. Even something as simple as age could be broken down into multiple dimensions including mental age and chronological age, so where does conceptualization stop? How far down the dimensional rabbit hole do we have to go? Researchers should consider two things. First, how important is this variable in your study? If age is not important in your study (maybe it is a control variable), it seems like a waste of time to do a lot of work drawing from developmental theory to conceptualize this variable. A unidimensional measure from zero to dead is all the detail we need. On the other hand, if we were measuring the impact of age on masculinity, conceptualizing our independent variable (age) as multidimensional may provide a richer understanding of its impact on masculinity. Finally, your conceptualization will lead directly to your operationalization of the variable, and once your operationalization is complete, make sure someone reading your study could follow how your conceptual definitions informed the measures you chose for your variables.
Exercises
Write a conceptual definition for your independent and dependent variables.
- Cite and attribute definitions to other scholars, if you use their words.
- Describe how your definitions are informed by your theoretical framework.
- Place your definition in conversation with other theories and conceptual definitions commonly used in the literature.
- Are there multiple dimensions of your variables?
- Are any of these dimensions important for you to measure?

Do researchers actually know what we’re talking about?
Conceptualization proceeds differently in qualitative research compared to quantitative research. Since qualitative researchers are interested in the understandings and experiences of their participants, it is less important for them to find one fixed definition for a concept before starting to interview or interact with participants. The researcher’s job is to accurately and completely represent how their participants understand a concept, not to test their own definition of that concept.
If you were conducting qualitative research on masculinity, you would likely consult previous literature like Kimmel’s work mentioned above. From your literature review, you may come up with a working definition for the terms you plan to use in your study, which can change over the course of the investigation. However, the definition that matters is the definition that your participants share during data collection. A working definition is merely a place to start, and researchers should take care not to think it is the only or best definition out there.
In qualitative inquiry, your participants are the experts (sound familiar, social workers?) on the concepts that arise during the research study. Your job as the researcher is to accurately and reliably collect and interpret their understanding of the concepts they describe while answering your questions. Conceptualization of concepts is likely to change over the course of qualitative inquiry, as you learn more information from your participants. Indeed, getting participants to comment on, extend, or challenge the definitions and understandings of other participants is a hallmark of qualitative research. This is the opposite of quantitative research, in which definitions must be completely set in stone before the inquiry can begin.
The contrast between qualitative and quantitative conceptualization is instructive for understanding how quantitative methods (and positivist research in general) privilege the knowledge of the researcher over the knowledge of study participants and community members. Positivism holds that the researcher is the “expert,” and can define concepts based on their expert knowledge of the scientific literature. This knowledge is in contrast to the lived experience that participants possess from experiencing the topic under examination day-in, day-out. For this reason, it would be wise to remind ourselves not to take our definitions too seriously and be critical about the limitations of our knowledge.
Conceptualization must be open to revisions, even radical revisions, as scientific knowledge progresses. While I’ve suggested consulting prior scholarly definitions of our concepts, you should not assume that prior, scholarly definitions are more real than the definitions we create. Likewise, we should not think that our own made-up definitions are any more real than any other definition. It would also be wrong to assume that just because definitions exist for some concept that the concept itself exists beyond some abstract idea in our heads. Building on the paradigmatic ideas behind interpretivism and the critical paradigm, researchers call the assumption that our abstract concepts exist in some concrete, tangible way is known as . It explores the power dynamics behind how we can create reality by how we define it.
Returning again to our example of masculinity. Think about our how our notions of masculinity have developed over the past few decades, and how different and yet so similar they are to patriarchal definitions throughout history. Conceptual definitions become more or less popular based on the power arrangements inside of social science the broader world. Western knowledge systems are privileged, while others are viewed as unscientific and marginal. The historical domination of social science by white men from WEIRD countries meant that definitions of masculinity were imbued their cultural biases and were designed explicitly and implicitly to preserve their power. This has inspired movements for cognitive justice as we seek to use social science to achieve global development.
Key Takeaways
- Measurement is the process by which we describe and ascribe meaning to the key facts, concepts, or other phenomena that we are investigating.
- Kaplan identified three categories of things that social scientists measure including observational terms, indirect observables, and constructs.
- Some concepts have multiple elements or dimensions.
- Researchers often use measures previously developed and studied by other researchers.
- Conceptualization is a process that involves coming up with clear, concise definitions.
- Conceptual definitions are based on the theoretical framework you are using for your study (and the paradigmatic assumptions underlying those theories).
- Whether your conceptual definitions come from your own ideas or the literature, you should be able to situate them in terms of other commonly used conceptual definitions.
- Researchers should acknowledge the limited explanatory power of their definitions for concepts and how oppression can shape what explanations are considered true or scientific.
Exercises
Think historically about the variables in your research question.
- How has our conceptual definition of your topic changed over time?
- What scholars or social forces were responsible for this change?
Take a critical look at your conceptual definitions.
- How participants might define terms for themselves differently, in terms of their daily experience?
- On what cultural assumptions are your conceptual definitions based?
- Are your conceptual definitions applicable across all cultures that will be represented in your sample?
11.2 Operational definitions
Learning Objectives
Learners will be able to…
- Define and give an example of indicators and attributes for a variable
- Apply the three components of an operational definition to a variable
- Distinguish between levels of measurement for a variable and how those differences relate to measurement
- Describe the purpose of composite measures like scales and indices
Conceptual definitions are like dictionary definitions. They tell you what a concept means by defining it using other concepts. In this section we will move from the abstract realm (theory) to the real world (measurement). is the process by which researchers spell out precisely how a concept will be measured in their study. It involves identifying the specific research procedures we will use to gather data about our concepts. If conceptually defining your terms means looking at theory, how do you operationally define your terms? By looking for indicators of when your variable is present or not, more or less intense, and so forth. Operationalization is probably the most challenging part of quantitative research, but once it’s done, the design and implementation of your study will be straightforward.

Indicators
Operationalization works by identifying specific that will be taken to represent the ideas we are interested in studying. If we are interested in studying masculinity, then the indicators for that concept might include some of the social roles prescribed to men in society such as breadwinning or fatherhood. Being a breadwinner or a father might therefore be considered indicators of a person’s masculinity. The extent to which a man fulfills either, or both, of these roles might be understood as clues (or indicators) about the extent to which he is viewed as masculine.
Let’s look at another example of indicators. Each day, Gallup researchers poll 1,000 randomly selected Americans to ask them about their well-being. To measure well-being, Gallup asks these people to respond to questions covering six broad areas: physical health, emotional health, work environment, life evaluation, healthy behaviors, and access to basic necessities. Gallup uses these six factors as indicators of the concept that they are really interested in, which is well-being.
Identifying indicators can be even simpler than the examples described thus far. Political party affiliation is another relatively easy concept for which to identify indicators. If you asked a person what party they voted for in the last national election (or gained access to their voting records), you would get a good indication of their party affiliation. Of course, some voters split tickets between multiple parties when they vote and others swing from party to party each election, so our indicator is not perfect. Indeed, if our study were about political identity as a key concept, operationalizing it solely in terms of who they voted for in the previous election leaves out a lot of information about identity that is relevant to that concept. Nevertheless, it’s a pretty good indicator of political party affiliation.
Choosing indicators is not an arbitrary process. As described earlier, utilizing prior theoretical and empirical work in your area of interest is a great way to identify indicators in a scholarly manner. And you conceptual definitions will point you in the direction of relevant indicators. Empirical work will give you some very specific examples of how the important concepts in an area have been measured in the past and what sorts of indicators have been used. Often, it makes sense to use the same indicators as previous researchers; however, you may find that some previous measures have potential weaknesses that your own study will improve upon.
All of the examples in this chapter have dealt with questions you might ask a research participant on a survey or in a quantitative interview. If you plan to collect data from other sources, such as through direct observation or the analysis of available records, think practically about what the design of your study might look like and how you can collect data on various indicators feasibly. If your study asks about whether the participant regularly changes the oil in their car, you will likely not observe them directly doing so. Instead, you will likely need to rely on a survey question that asks them the frequency with which they change their oil or ask to see their car maintenance records.
Exercises
- What indicators are commonly used to measure the variables in your research question?
- How can you feasibly collect data on these indicators?
- Are you planning to collect your own data using a questionnaire or interview? Or are you planning to analyze available data like client files or raw data shared from another researcher’s project?
Remember, you need . You research project cannot rely solely on the results reported by other researchers or the arguments you read in the literature. A literature review is only the first part of a research project, and your review of the literature should inform the indicators you end up choosing when you measure the variables in your research question.
Unlike conceptual definitions which contain other concepts, operational definition consists of the following components: (1) the variable being measured and its attributes, (2) the measure you will use, (3) how you plan to interpret the data collected from that measure to draw conclusions about the variable you are measuring.
Step 1: Specifying variables and attributes
The first component, the variable, should be the easiest part. At this point in quantitative research, you should have a research question that has at least one independent and at least one dependent variable. Remember that variables must be able to vary. For example, the United States is not a variable. Country of residence is a variable, as is patriotism. Similarly, if your sample only includes men, gender is a constant in your study, not a variable. A is a characteristic that does not change in your study.
When social scientists measure concepts, they sometimes use the language of variables and attributes. A variable refers to a quality or quantity that varies across people or situations. are the characteristics that make up a variable. For example, the variable hair color would contain attributes like blonde, brown, black, red, gray, etc. A variable’s attributes determine its level of measurement. There are four possible levels of measurement: nominal, ordinal, interval, and ratio. The first two levels of measurement are , meaning their attributes are categories rather than numbers. The latter two levels of measurement are , meaning their attributes are numbers.

Levels of measurement
Hair color is an example of a nominal level of measurement. measures are categorical, and those categories cannot be mathematically ranked. As a brown-haired person (with some gray), I can’t say for sure that brown-haired people are better than blonde-haired people. As with all nominal levels of measurement, there is no ranking order between hair colors; they are simply different. That is what constitutes a nominal level of gender and race are also measured at the nominal level.
What attributes are contained in the variable hair color? While blonde, brown, black, and red are common colors, some people may not fit into these categories if we only list these attributes. My wife, who currently has purple hair, wouldn’t fit anywhere. This means that our attributes were not exhaustive. means that all possible attributes are listed. We may have to list a lot of colors before we can meet the criteria of exhaustiveness. Clearly, there is a point at which exhaustiveness has been reasonably met. If a person insists that their hair color is light burnt sienna, it is not your responsibility to list that as an option. Rather, that person would reasonably be described as brown-haired. Perhaps listing a category for other color would suffice to make our list of colors exhaustive.
What about a person who has multiple hair colors at the same time, such as red and black? They would fall into multiple attributes. This violates the rule of , in which a person cannot fall into two different attributes. Instead of listing all of the possible combinations of colors, perhaps you might include a multi-color attribute to describe people with more than one hair color.
Making sure researchers provide mutually exclusive and exhaustive is about making sure all people are represented in the data record. For many years, the attributes for gender were only male or female. Now, our understanding of gender has evolved to encompass more attributes that better reflect the diversity in the world. Children of parents from different races were often classified as one race or another, even if they identified with both cultures. The option for bi-racial or multi-racial on a survey not only more accurately reflects the racial diversity in the real world but validates and acknowledges people who identify in that manner. If we did not measure race in this way, we would leave empty the data record for people who identify as biracial or multiracial, impairing our search for truth.
Unlike nominal-level measures, attributes at the level can be rank ordered. For example, someone’s degree of satisfaction in their romantic relationship can be ordered by rank. That is, you could say you are not at all satisfied, a little satisfied, moderately satisfied, or highly satisfied. Note that even though these have a rank order to them (not at all satisfied is certainly worse than highly satisfied), we cannot calculate a mathematical distance between those attributes. We can simply say that one attribute of an ordinal-level variable is more or less than another attribute.
This can get a little confusing when using . If you have ever taken a customer satisfaction survey or completed a course evaluation for school, you are familiar with rating scales. “On a scale of 1-5, with 1 being the lowest and 5 being the highest, how likely are you to recommend our company to other people?” That surely sounds familiar. Rating scales use numbers, but only as a shorthand, to indicate what attribute (highly likely, somewhat likely, etc.) the person feels describes them best. You wouldn’t say you are “2” likely to recommend the company, but you would say you are not very likely to recommend the company. Ordinal-level attributes must also be exhaustive and mutually exclusive, as with nominal-level variables.
At the level, attributes must also be exhaustive and mutually exclusive and there is equal distance between attributes. Interval measures are also continuous, meaning their attributes are numbers, rather than categories. IQ scores are interval level, as are temperatures in Fahrenheit and Celsius. Their defining characteristic is that we can say how much more or less one attribute differs from another. We cannot, however, say with certainty what the ratio of one attribute is in comparison to another. For example, it would not make sense to say that a person with an IQ score of 140 has twice the IQ of a person with a score of 70. However, the difference between IQ scores of 80 and 100 is the same as the difference between IQ scores of 120 and 140.
While we cannot say that someone with an IQ of 140 is twice as intelligent as someone with an IQ of 70 because IQ is measured at the interval level, we can say that someone with six siblings has twice as many as someone with three because number of siblings is measured at the ratio level. Finally, at the level, attributes are mutually exclusive and exhaustive, attributes can be rank ordered, the distance between attributes is equal, and attributes have a true zero point. Thus, with these variables, we can say what the ratio of one attribute is in comparison to another. Examples of ratio-level variables include age and years of education. We know that a person who is 12 years old is twice as old as someone who is 6 years old. Height measured in meters and weight measured in kilograms are good examples. So are counts of discrete objects or events such as the number of siblings one has or the number of questions a student answers correctly on an exam. The differences between each level of measurement are visualized in Table 11.1.
| Nominal | Ordinal | Interval | Ratio | |
| Exhaustive | X | X | X | X |
| Mutually exclusive | X | X | X | X |
| Rank-ordered | X | X | X | |
| Equal distance between attributes | X | X | ||
| True zero point | X |
Levels of measurement=levels of specificity
We have spent time learning how to determine our data’s level of measurement. Now what? How could we use this information to help us as we measure concepts and develop measurement tools? First, the types of statistical tests that we are able to use are dependent on our data’s level of measurement. With nominal-level measurement, for example, the only available measure of central tendency is the mode. With ordinal-level measurement, the median or mode can be used as indicators of central tendency. Interval and ratio-level measurement are typically considered the most desirable because they permit for any indicators of central tendency to be computed (i.e., mean, median, or mode). Also, ratio-level measurement is the only level that allows meaningful statements about ratios of scores. The higher the level of measurement, the more complex statistical tests we are able to conduct. This knowledge may help us decide what kind of data we need to gather, and how.
That said, we have to balance this knowledge with the understanding that sometimes, collecting data at a higher level of measurement could negatively impact our studies. For instance, sometimes providing answers in ranges may make prospective participants feel more comfortable responding to sensitive items. Imagine that you were interested in collecting information on topics such as income, number of sexual partners, number of times someone used illicit drugs, etc. You would have to think about the sensitivity of these items and determine if it would make more sense to collect some data at a lower level of measurement (e.g., asking if they are sexually active or not (nominal) versus their total number of sexual partners (ratio).
Finally, sometimes when analyzing data, researchers find a need to change a data’s level of measurement. For example, a few years ago, a student was interested in studying the relationship between mental health and life satisfaction. This student used a variety of measures. One item asked about the number of mental health symptoms, reported as the actual number. When analyzing data, my student examined the mental health symptom variable and noticed that she had two groups, those with none or one symptoms and those with many symptoms. Instead of using the ratio level data (actual number of mental health symptoms), she collapsed her cases into two categories, few and many. She decided to use this variable in her analyses. It is important to note that you can move a higher level of data to a lower level of data; however, you are unable to move a lower level to a higher level.
Exercises
- Check that the variables in your research question can vary…and that they are not constants or one of many potential attributes of a variable.
- Think about the attributes your variables have. Are they categorical or continuous? What level of measurement seems most appropriate?

Step 2: Specifying measures for each variable
Let’s pick a social work research question and walk through the process of operationalizing variables to see how specific we need to get. I’m going to hypothesize that residents of a psychiatric unit who are more depressed are less likely to be satisfied with care. Remember, this would be a inverse relationship—as depression increases, satisfaction decreases. In this question, depression is my independent variable (the cause) and satisfaction with care is my dependent variable (the effect). Now we have identified our variables, their attributes, and levels of measurement, we move onto the second component: the measure itself.
So, how would you measure my key variables: depression and satisfaction? What indicators would you look for? Some students might say that depression could be measured by observing a participant’s body language. They may also say that a depressed person will often express feelings of sadness or hopelessness. In addition, a satisfied person might be happy around service providers and often express gratitude. While these factors may indicate that the variables are present, they lack coherence. Unfortunately, what this “measure” is actually saying is that “I know depression and satisfaction when I see them.” While you are likely a decent judge of depression and satisfaction, you need to provide more information in a research study for how you plan to measure your variables. Your judgment is subjective, based on your own idiosyncratic experiences with depression and satisfaction. They couldn’t be replicated by another researcher. They also can’t be done consistently for a large group of people. Operationalization requires that you come up with a specific and rigorous measure for seeing who is depressed or satisfied.
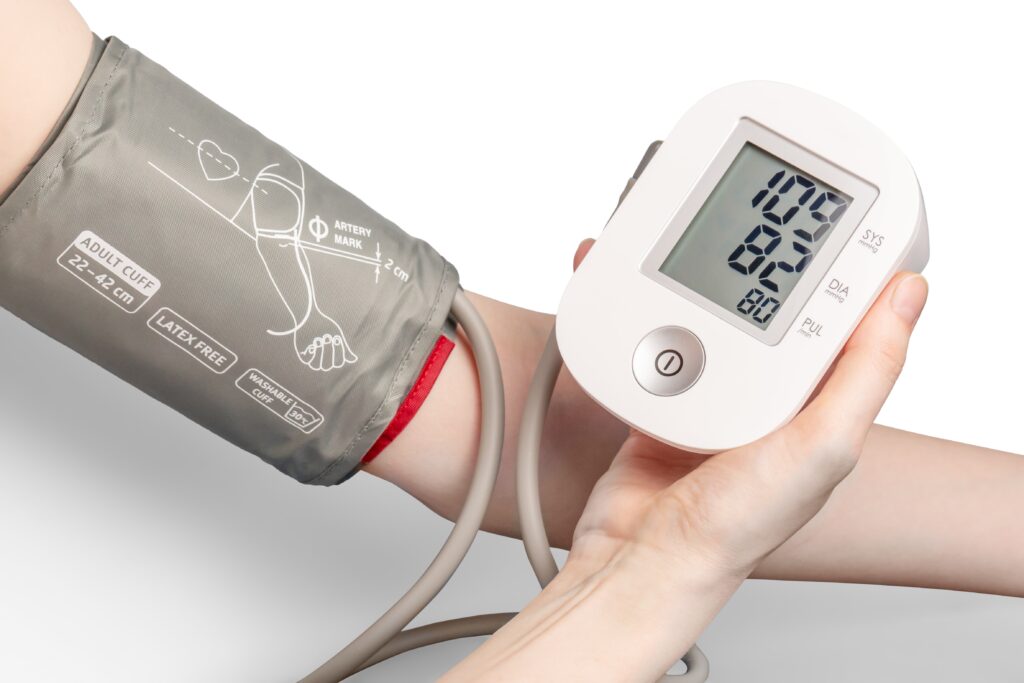
Finding a good measure for your variable depends on the kind of variable it is. Variables that are directly observable don’t come up very often in my students’ classroom projects, but they might include things like taking someone’s blood pressure, marking attendance or participation in a group, and so forth. To measure an indirectly observable variable like age, you would probably put a question on a survey that asked, “How old are you?” Measuring a variable like income might require some more thought, though. Are you interested in this person’s individual income or the income of their family unit? This might matter if your participant does not work or is dependent on other family members for income. Do you count income from social welfare programs? Are you interested in their income per month or per year? Even though indirect observables are relatively easy to measure, the measures you use must be clear in what they are asking, and operationalization is all about figuring out the specifics of what you want to know. For more complicated constructs, you will need compound measures (that use multiple indicators to measure a single variable).
How you plan to collect your data also influences how you will measure your variables. For social work researchers using secondary data like client records as a data source, you are limited by what information is in the data sources you can access. If your organization uses a given measurement for a mental health outcome, that is the one you will use in your study. Similarly, if you plan to study how long a client was housed after an intervention using client visit records, you are limited by how their caseworker recorded their housing status in the chart. One of the benefits of collecting your own data is being able to select the measures you feel best exemplify your understanding of the topic.
Measuring unidimensional concepts
The previous section mentioned two important considerations: how complicated the variable is and how you plan to collect your data. With these in hand, we can use the level of measurement to further specify how you will measure your variables and consider specialized rating scales developed by social science researchers.
Measurement at each level
Nominal measures assess categorical variables. These measures are used for variables or indicators that have mutually exclusive attributes, but that cannot be rank-ordered. Nominal measures ask about the variable and provide names or labels for different attribute values like social work, counseling, and nursing for the variable profession. Nominal measures are relatively straightforward.
Ordinal measures often use a rating scale. It is an ordered set of responses that participants must choose from. Figure 11.1 shows several examples. The number of response options on a typical rating scale is usualy five or seven, though it can range from three to 11. Five-point scales are best for unipolar scales where only one construct is tested, such as frequency (Never, Rarely, Sometimes, Often, Always). Seven-point scales are best for bipolar scales where there is a dichotomous spectrum, such as liking (Like very much, Like somewhat, Like slightly, Neither like nor dislike, Dislike slightly, Dislike somewhat, Dislike very much). For bipolar questions, it is useful to offer an earlier question that branches them into an area of the scale; if asking about liking ice cream, first ask “Do you generally like or dislike ice cream?” Once the respondent chooses like or dislike, refine it by offering them relevant choices from the seven-point scale. Branching improves both reliability and validity (Krosnick & Berent, 1993).[9] Although you often see scales with numerical labels, it is best to only present verbal labels to the respondents but convert them to numerical values in the analyses. Avoid partial labels or length or overly specific labels. In some cases, the verbal labels can be supplemented with (or even replaced by) meaningful graphics. The last rating scale shown in Figure 11.1 is a visual-analog scale, on which participants make a mark somewhere along the horizontal line to indicate the magnitude of their response.

Interval measures are those where the values measured are not only rank-ordered, but are also equidistant from adjacent attributes. For example, the temperature scale (in Fahrenheit or Celsius), where the difference between 30 and 40 degree Fahrenheit is the same as that between 80 and 90 degree Fahrenheit. Likewise, if you have a scale that asks respondents’ annual income using the following attributes (ranges): $0 to 10,000, $10,000 to 20,000, $20,000 to 30,000, and so forth, this is also an interval measure, because the mid-point of each range (i.e., $5,000, $15,000, $25,000, etc.) are equidistant from each other. The intelligence quotient (IQ) scale is also an interval measure, because the measure is designed such that the difference between IQ scores 100 and 110 is supposed to be the same as between 110 and 120 (although we do not really know whether that is truly the case). Interval measures allow us to examine “how much more” is one attribute when compared to another, which is not possible with nominal or ordinal measures. You may find researchers who “pretend” (incorrectly) that ordinal rating scales are actually interval measures so that we can use different statistical techniques for analyzing them. As we will discuss in the latter part of the chapter, this is a mistake because there is no way to know whether the difference between a 3 and a 4 on a rating scale is the same as the difference between a 2 and a 3. Those numbers are just placeholders for categories.
Ratio measures are those that have all the qualities of nominal, ordinal, and interval scales, and in addition, also have a “true zero” point (where the value zero implies lack or non-availability of the underlying construct). Think about how to measure the number of people working in human resources at a social work agency. It could be one, several, or none (if the company contracts out for those services). Measuring interval and ratio data is relatively easy, as people either select or input a number for their answer. If you ask a person how many eggs they purchased last week, they can simply tell you they purchased `a dozen eggs at the store, two at breakfast on Wednesday, or none at all.
Commonly used rating scales in questionnaires
The level of measurement will give you the basic information you need, but social scientists have developed specialized instruments for use in questionnaires, a common tool used in quantitative research. As we mentioned before, if you plan to source your data from client files or previously published results
Although is a term colloquially used to refer to almost any rating scale (e.g., a 0-to-10 life satisfaction scale), it has a much more precise meaning. In the 1930s, researcher Rensis Likert (pronounced LICK-ert) created a new approach for measuring people’s attitudes (Likert, 1932).[10] It involves presenting people with several statements—including both favorable and unfavorable statements—about some person, group, or idea. Respondents then express their agreement or disagreement with each statement on a 5-point scale: Strongly Agree, Agree, Neither Agree nor Disagree, Disagree, Strongly Disagree. Numbers are assigned to each response and then summed across all items to produce a score representing the attitude toward the person, group, or idea. For items that are phrased in an opposite direction (e.g., negatively worded statements instead of positively worded statements), reverse coding is used so that the numerical scoring of statements also runs in the opposite direction. The entire set of items came to be called a Likert scale, as indicated in Table 11.2 below.
Unless you are measuring people’s attitude toward something by assessing their level of agreement with several statements about it, it is best to avoid calling it a Likert scale. You are probably just using a rating scale. Likert scales allow for more granularity (more finely tuned response) than yes/no items, including whether respondents are neutral to the statement. Below is an example of how we might use a Likert scale to assess your attitudes about research as you work your way through this textbook.
| Strongly agree | Agree | Neutral | Disagree | Strongly disagree | |
| I like research more now than when I started reading this book. | |||||
| This textbook is easy to use. | |||||
| I feel confident about how well I understand levels of measurement. | |||||
| This textbook is helping me plan my research proposal. |
are composite (multi-item) scales in which respondents are asked to indicate their opinions or feelings toward a single statement using different pairs of adjectives framed as polar opposites. Whereas in the above Likert scale, the participant is asked how much they agree or disagree with a statement, in a semantic differential scale the participant is asked to indicate how they feel about a specific item. This makes the semantic differential scale an excellent technique for measuring people’s attitudes or feelings toward objects, events, or behaviors. Table 11.3 is an example of a semantic differential scale that was created to assess participants’ feelings about this textbook.
| 1) How would you rate your opinions toward this textbook? | ||||||
| Very much | Somewhat | Neither | Somewhat | Very much | ||
| Boring | Exciting | |||||
| Useless | Useful | |||||
| Hard | Easy | |||||
| Irrelevant | Applicable | |||||
This composite scale was designed by Louis Guttman and uses a series of items arranged in increasing order of intensity (least intense to most intense) of the concept. This type of scale allows us to understand the intensity of beliefs or feelings. Each item in the above has a weight (this is not indicated on the tool) which varies with the intensity of that item, and the weighted combination of each response is used as an aggregate measure of an observation.
Example Guttman Scale Items
- I often felt the material was not engaging Yes/No
- I was often thinking about other things in class Yes/No
- I was often working on other tasks during class Yes/No
- I will work to abolish research from the curriculum Yes/No
Notice how the items move from lower intensity to higher intensity. A researcher reviews the yes answers and creates a score for each participant.
Composite measures: Scales and indices
Depending on your research design, your measure may be something you put on a survey or pre/post-test that you give to your participants. For a variable like age or income, one well-worded question may suffice. Unfortunately, most variables in the social world are not so simple. Depression and satisfaction are multidimensional concepts. Relying on a single indicator like a question that asks “Yes or no, are you depressed?” does not encompass the complexity of depression, including issues with mood, sleeping, eating, relationships, and happiness. There is no easy way to delineate between multidimensional and unidimensional concepts, as its all in how you think about your variable. Satisfaction could be validly measured using a unidimensional ordinal rating scale. However, if satisfaction were a key variable in our study, we would need a theoretical framework and conceptual definition for it. That means we’d probably have more indicators to ask about like timeliness, respect, sensitivity, and many others, and we would want our study to say something about what satisfaction truly means in terms of our other key variables. However, if satisfaction is not a key variable in your conceptual framework, it makes sense to operationalize it as a unidimensional concept.
For more complicated measures, researchers use scales and indices (sometimes called indexes) to measure their variables because they assess multiple indicators to develop a composite (or total) score. Composite scores provide a much greater understanding of concepts than a single item could. Although we won’t delve too deeply into the process of scale development, we will cover some important topics for you to understand how scales and indices developed by other researchers can be used in your project.
Although they exhibit differences (which will later be discussed) the two have in common various factors.
- Both are ordinal measures of variables.
- Both can order the units of analysis in terms of specific variables.
- Both are .
Scales
The previous section discussed how to measure respondents’ responses to predesigned items or indicators belonging to an underlying construct. But how do we create the indicators themselves? The process of creating the indicators is called scaling. More formally, scaling is a branch of measurement that involves the construction of measures by associating qualitative judgments about unobservable constructs with quantitative, measurable metric units. Stevens (1946)[11] said, “Scaling is the assignment of objects to numbers according to a rule.” This process of measuring abstract concepts in concrete terms remains one of the most difficult tasks in empirical social science research.
The outcome of a scaling process is a , which is an empirical structure for measuring items or indicators of a given construct. Understand that multidimensional “scales”, as discussed in this section, are a little different from “rating scales” discussed in the previous section. A rating scale is used to capture the respondents’ reactions to a given item on a questionnaire. For example, an ordinally scaled item captures a value between “strongly disagree” to “strongly agree.” Attaching a rating scale to a statement or instrument is not scaling. Rather, scaling is the formal process of developing scale items, before rating scales can be attached to those items.
If creating your own scale sounds painful, don’t worry! For most multidimensional variables, you would likely be duplicating work that has already been done by other researchers. Specifically, this is a branch of science called psychometrics. You do not need to create a scale for depression because scales such as the Patient Health Questionnaire (PHQ-9), the Center for Epidemiologic Studies Depression Scale (CES-D), and Beck’s Depression Inventory (BDI) have been developed and refined over dozens of years to measure variables like depression. Similarly, scales such as the Patient Satisfaction Questionnaire (PSQ-18) have been developed to measure satisfaction with medical care. As we will discuss in the next section, these scales have been shown to be reliable and valid. While you could create a new scale to measure depression or satisfaction, a study with rigor would pilot test and refine that new scale over time to make sure it measures the concept accurately and consistently. This high level of rigor is often unachievable in student research projects because of the cost and time involved in pilot testing and validating, so using existing scales is recommended.
Unfortunately, there is no good one-stop=shop for psychometric scales. The Mental Measurements Yearbook provides a searchable database of measures for social science variables, though it woefully incomplete and often does not contain the full documentation for scales in its database. You can access it from a university library’s list of databases. If you can’t find anything in there, your next stop should be the methods section of the articles in your literature review. The methods section of each article will detail how the researchers measured their variables, and often the results section is instructive for understanding more about measures. In a quantitative study, researchers may have used a scale to measure key variables and will provide a brief description of that scale, its names, and maybe a few example questions. If you need more information, look at the results section and tables discussing the scale to get a better idea of how the measure works. Looking beyond the articles in your literature review, searching Google Scholar using queries like “depression scale” or “satisfaction scale” should also provide some relevant results. For example, searching for documentation for the Rosenberg Self-Esteem Scale (which we will discuss in the next section), I found this report from researchers investigating acceptance and commitment therapy which details this scale and many others used to assess mental health outcomes. If you find the name of the scale somewhere but cannot find the documentation (all questions and answers plus how to interpret the scale), a general web search with the name of the scale and “.pdf” may bring you to what you need. Or, to get professional help with finding information, always ask a librarian!
Unfortunately, these approaches do not guarantee that you will be able to view the scale itself or get information on how it is interpreted. Many scales cost money to use and may require training to properly administer. You may also find scales that are related to your variable but would need to be slightly modified to match your study’s needs. You could adapt a scale to fit your study, however changing even small parts of a scale can influence its accuracy and consistency. While it is perfectly acceptable in student projects to adapt a scale without testing it first (time may not allow you to do so), pilot testing is always recommended for adapted scales, and researchers seeking to draw valid conclusions and publish their results must take this additional step.
Indices
An is a composite score derived from aggregating measures of multiple concepts (called components) using a set of rules and formulas. It is different from a scale. Scales also aggregate measures; however, these measures examine different dimensions or the same dimension of a single construct. A well-known example of an index is the consumer price index (CPI), which is computed every month by the Bureau of Labor Statistics of the U.S. Department of Labor. The CPI is a measure of how much consumers have to pay for goods and services (in general) and is divided into eight major categories (food and beverages, housing, apparel, transportation, healthcare, recreation, education and communication, and “other goods and services”), which are further subdivided into more than 200 smaller items. Each month, government employees call all over the country to get the current prices of more than 80,000 items. Using a complicated weighting scheme that takes into account the location and probability of purchase for each item, analysts then combine these prices into an overall index score using a series of formulas and rules.
Another example of an index is the Duncan Socioeconomic Index (SEI). This index is used to quantify a person’s socioeconomic status (SES) and is a combination of three concepts: income, education, and occupation. Income is measured in dollars, education in years or degrees achieved, and occupation is classified into categories or levels by status. These very different measures are combined to create an overall SES index score. However, SES index measurement has generated a lot of controversy and disagreement among researchers.
The process of creating an index is similar to that of a scale. First, conceptualize (define) the index and its constituent components. Though this appears simple, there may be a lot of disagreement on what components (concepts/constructs) should be included or excluded from an index. For instance, in the SES index, isn’t income correlated with education and occupation? And if so, should we include one component only or all three components? Reviewing the literature, using theories, and/or interviewing experts or key stakeholders may help resolve this issue. Second, operationalize and measure each component. For instance, how will you categorize occupations, particularly since some occupations may have changed with time (e.g., there were no Web developers before the Internet)? As we will see in step three below, researchers must create a rule or formula for calculating the index score. Again, this process may involve a lot of subjectivity, so validating the index score using existing or new data is important.
Scale and index development at often taught in their own course in doctoral education, so it is unreasonable for you to expect to develop a consistently accurate measure within the span of a week or two. Using available indices and scales is recommended for this reason.
Differences between scales and indices
Though indices and scales yield a single numerical score or value representing a concept of interest, they are different in many ways. First, indices often comprise components that are very different from each other (e.g., income, education, and occupation in the SES index) and are measured in different ways. Conversely, scales typically involve a set of similar items that use the same rating scale (such as a five-point Likert scale about customer satisfaction).
Second, indices often combine objectively measurable values such as prices or income, while scales are designed to assess subjective or judgmental constructs such as attitude, prejudice, or self-esteem. Some argue that the sophistication of the scaling methodology makes scales different from indexes, while others suggest that indexing methodology can be equally sophisticated. Nevertheless, indexes and scales are both essential tools in social science research.
Scales and indices seem like clean, convenient ways to measure different phenomena in social science, but just like with a lot of research, we have to be mindful of the assumptions and biases underneath. What if a scale or an index was developed using only White women as research participants? Is it going to be useful for other groups? It very well might be, but when using a scale or index on a group for whom it hasn’t been tested, it will be very important to evaluate the validity and reliability of the instrument, which we address in the rest of the chapter.
Finally, it’s important to note that while scales and indices are often made up of nominal or ordinal variables, when we analyze them into composite scores, we will treat them as interval/ratio variables.
Exercises
- Look back to your work from the previous section, are your variables unidimensional or multidimensional?
- Describe the specific measures you will use (actual questions and response options you will use with participants) for each variable in your research question.
- If you are using a measure developed by another researcher but do not have all of the questions, response options, and instructions needed to implement it, put it on your to-do list to get them.
Step 3: How you will interpret your measures
The final stage of operationalization involves setting the rules for how the measure works and how the researcher should interpret the results. Sometimes, interpreting a measure can be incredibly easy. If you ask someone their age, you’ll probably interpret the results by noting the raw number (e.g., 22) someone provides and that it is lower or higher than other people’s ages. However, you could also recode that person into age categories (e.g., under 25, 20-29-years-old, generation Z, etc.). Even scales may be simple to interpret. If there is a scale of problem behaviors, one might simply add up the number of behaviors checked off–with a range from 1-5 indicating low risk of delinquent behavior, 6-10 indicating the student is moderate risk, etc. How you choose to interpret your measures should be guided by how they were designed, how you conceptualize your variables, the data sources you used, and your plan for analyzing your data statistically. Whatever measure you use, you need a set of rules for how to take any valid answer a respondent provides to your measure and interpret it in terms of the variable being measured.
For more complicated measures like scales, refer to the information provided by the author for how to interpret the scale. If you can’t find enough information from the scale’s creator, look at how the results of that scale are reported in the results section of research articles. For example, Beck’s Depression Inventory (BDI-II) uses 21 statements to measure depression and respondents rate their level of agreement on a scale of 0-3. The results for each question are added up, and the respondent is put into one of three categories: low levels of depression (1-16), moderate levels of depression (17-30), or severe levels of depression (31 and over).
One common mistake I see often is that students will introduce another variable into their operational definition. This is incorrect. Your operational definition should mention only one variable—the variable being defined. While your study will certainly draw conclusions about the relationships between variables, that’s not what operationalization is. Operationalization specifies what instrument you will use to measure your variable and how you plan to interpret the data collected using that measure.
Operationalization is probably the trickiest component of basic research methods, so please don’t get frustrated if it takes a few drafts and a lot of feedback to get to a workable definition. At the time of this writing, I am in the process of operationalizing the concept of “attitudes towards research methods.” Originally, I thought that I could gauge students’ attitudes toward research methods by looking at their end-of-semester course evaluations. As I became aware of the potential methodological issues with student course evaluations, I opted to use focus groups of students to measure their common beliefs about research. You may recall some of these opinions from Chapter 1, such as the common beliefs that research is boring, useless, and too difficult. After the focus group, I created a scale based on the opinions I gathered, and I plan to pilot test it with another group of students. After the pilot test, I expect that I will have to revise the scale again before I can implement the measure in a real social work research project. At the time I’m writing this, I’m still not completely done operationalizing this concept.
Key Takeaways
- Operationalization involves spelling out precisely how a concept will be measured.
- Operational definitions must include the variable, the measure, and how you plan to interpret the measure.
- There are four different levels of measurement: nominal, ordinal, interval, and ratio (in increasing order of specificity).
- Scales and indices are common ways to collect information and involve using multiple indicators in measurement.
- A key difference between a scale and an index is that a scale contains multiple indicators for one concept, whereas an indicator examines multiple concepts (components).
- Using scales developed and refined by other researchers can improve the rigor of a quantitative study.
Exercises
Use the research question that you developed in the previous chapters and find a related scale or index that researchers have used. If you have trouble finding the exact phenomenon you want to study, get as close as you can.
- What is the level of measurement for each item on each tool? Take a second and think about why the tool’s creator decided to include these levels of measurement. Identify any levels of measurement you would change and why.
- If these tools don’t exist for what you are interested in studying, why do you think that is?
11.3 Measurement quality
Learning Objectives
Learners will be able to…
- Define and describe the types of validity and reliability
- Assess for systematic error
The previous chapter provided insight into measuring concepts in social work research. We discussed the importance of identifying concepts and their corresponding indicators as a way to help us operationalize them. In essence, we now understand that when we think about our measurement process, we must be intentional and thoughtful in the choices that we make. This section is all about how to judge the quality of the measures you’ve chosen for the key variables in your research question.
Reliability
First, let’s say we’ve decided to measure alcoholism by asking people to respond to the following question: Have you ever had a problem with alcohol? If we measure alcoholism this way, then it is likely that anyone who identifies as an alcoholic would respond “yes.” This may seem like a good way to identify our group of interest, but think about how you and your peer group may respond to this question. Would participants respond differently after a wild night out, compared to any other night? Could an infrequent drinker’s current headache from last night’s glass of wine influence how they answer the question this morning? How would that same person respond to the question before consuming the wine? In each cases, the same person might respond differently to the same question at different points, so it is possible that our measure of alcoholism has a reliability problem. in measurement is about consistency.
One common problem of reliability with social scientific measures is memory. If we ask research participants to recall some aspect of their own past behavior, we should try to make the recollection process as simple and straightforward for them as possible. Sticking with the topic of alcohol intake, if we ask respondents how much wine, beer, and liquor they’ve consumed each day over the course of the past 3 months, how likely are we to get accurate responses? Unless a person keeps a journal documenting their intake, there will very likely be some inaccuracies in their responses. On the other hand, we might get more accurate responses if we ask a participant how many drinks of any kind they have consumed in the past week.
Reliability can be an issue even when we’re not reliant on others to accurately report their behaviors. Perhaps a researcher is interested in observing how alcohol intake influences interactions in public locations. They may decide to conduct observations at a local pub by noting how many drinks patrons consume and how their behavior changes as their intake changes. What if the researcher has to use the restroom, and the patron next to them takes three shots of tequila during the brief period the researcher is away from their seat? The reliability of this researcher’s measure of alcohol intake depends on their ability to physically observe every instance of patrons consuming drinks. If they are unlikely to be able to observe every such instance, then perhaps their mechanism for measuring this concept is not reliable.
The following subsections describe the types of reliability that are important for you to know about, but keep in mind that you may see other approaches to judging reliability mentioned in the empirical literature.
Test-retest reliability
When researchers measure a construct that they assume to be consistent across time, then the scores they obtain should also be consistent across time. is the extent to which this is actually the case. For example, intelligence is generally thought to be consistent across time. A person who is highly intelligent today will be highly intelligent next week. This means that any good measure of intelligence should produce roughly the same scores for this individual next week as it does today. Clearly, a measure that produces highly inconsistent scores over time cannot be a very good measure of a construct that is supposed to be consistent.
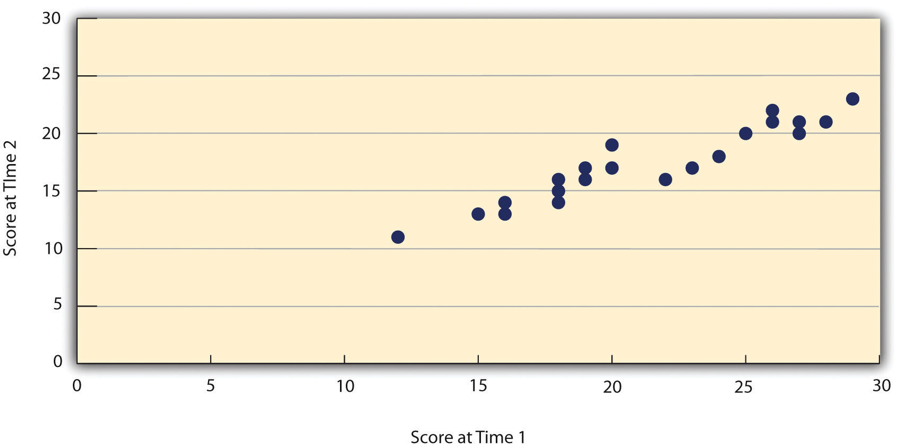
Assessing test-retest reliability requires using the measure on a group of people at one time, using it again on the same group of people at a later time. Unlike an experiment, you aren’t giving participants an intervention but trying to establish a reliable baseline of the variable you are measuring. Once you have these two measurements, you then look at the correlation between the two sets of scores. This is typically done by graphing the data in a scatterplot and computing the correlation coefficient. Figure 11.2 shows the correlation between two sets of scores of several university students on the Rosenberg Self-Esteem Scale, administered two times, a week apart. The correlation coefficient for these data is +.95. In general, a test-retest correlation of +.80 or greater is considered to indicate good reliability.
Again, high test-retest correlations make sense when the construct being measured is assumed to be consistent over time, which is the case for intelligence, self-esteem, and the Big Five personality dimensions. But other constructs are not assumed to be stable over time. The very nature of mood, for example, is that it changes. So a measure of mood that produced a low test-retest correlation over a period of a month would not be a cause for concern.
Internal consistency
Another kind of reliability is , which is the consistency of people’s responses across the items on a multiple-item measure. In general, all the items on such measures are supposed to reflect the same underlying construct, so people’s scores on those items should be correlated with each other. On the Rosenberg Self-Esteem Scale, people who agree that they are a person of worth should tend to agree that they have a number of good qualities. If people’s responses to the different items are not correlated with each other, then it would no longer make sense to claim that they are all measuring the same underlying construct. This is as true for behavioral and physiological measures as for self-report measures. For example, people might make a series of bets in a simulated game of roulette as a measure of their level of risk seeking. This measure would be internally consistent to the extent that individual participants’ bets were consistently high or low across trials. A specific statistical test known as Cronbach’s Alpha provides a way to measure how well each question of a scale is related to the others.
Interrater reliability
Many behavioral measures involve significant judgment on the part of an observer or a rater. is the extent to which different observers are consistent in their judgments. For example, if you were interested in measuring university students’ social skills, you could make video recordings of them as they interacted with another student whom they are meeting for the first time. Then you could have two or more observers watch the videos and rate each student’s level of social skills. To the extent that each participant does, in fact, have some level of social skills that can be detected by an attentive observer, different observers’ ratings should be highly correlated with each other.

Validity
, another key element of assessing measurement quality, is the extent to which the scores from a measure represent the variable they are intended to. But how do researchers make this judgment? We have already considered one factor that they take into account—reliability. When a measure has good test-retest reliability and internal consistency, researchers should be more confident that the scores represent what they are supposed to. There has to be more to it, however, because a measure can be extremely reliable but have no validity whatsoever. As an absurd example, imagine someone who believes that people’s index finger length reflects their self-esteem and therefore tries to measure self-esteem by holding a ruler up to people’s index fingers. Although this measure would have extremely good test-retest reliability, it would have absolutely no validity. The fact that one person’s index finger is a centimeter longer than another’s would indicate nothing about which one had higher self-esteem.
Discussions of validity usually divide it into several distinct “types.” But a good way to interpret these types is that they are other kinds of evidence—in addition to reliability—that should be taken into account when judging the validity of a measure.
Face validity
is the extent to which a measurement method appears “on its face” to measure the construct of interest. Most people would expect a self-esteem questionnaire to include items about whether they see themselves as a person of worth and whether they think they have good qualities. So a questionnaire that included these kinds of items would have good face validity. The finger-length method of measuring self-esteem, on the other hand, seems to have nothing to do with self-esteem and therefore has poor face validity. Although face validity can be assessed quantitatively—for example, by having a large sample of people rate a measure in terms of whether it appears to measure what it is intended to—it is usually assessed informally.
Face validity is at best a very weak kind of evidence that a measurement method is measuring what it is supposed to. One reason is that it is based on people’s intuitions about human behavior, which are frequently wrong. It is also the case that many established measures in psychology work quite well despite lacking face validity. The Minnesota Multiphasic Personality Inventory-2 (MMPI-2) measures many personality characteristics and disorders by having people decide whether each of over 567 different statements applies to them—where many of the statements do not have any obvious relationship to the construct that they measure. For example, the items “I enjoy detective or mystery stories” and “The sight of blood doesn’t frighten me or make me sick” both measure the suppression of aggression. In this case, it is not the participants’ literal answers to these questions that are of interest, but rather whether the pattern of the participants’ responses to a series of questions matches those of individuals who tend to suppress their aggression.
Content validity
is the extent to which a measure “covers” the construct of interest. For example, if a researcher conceptually defines test anxiety as involving both sympathetic nervous system activation (leading to nervous feelings) and negative thoughts, then his measure of test anxiety should include items about both nervous feelings and negative thoughts. Or consider that attitudes are usually defined as involving thoughts, feelings, and actions toward something. By this conceptual definition, a person has a positive attitude toward exercise to the extent that they think positive thoughts about exercising, feels good about exercising, and actually exercises. So to have good content validity, a measure of people’s attitudes toward exercise would have to reflect all three of these aspects. Like face validity, content validity is not usually assessed quantitatively. Instead, it is assessed by carefully checking the measurement method against the conceptual definition of the construct.
Criterion validity
is the extent to which people’s scores on a measure are correlated with other variables (known as criteria) that one would expect them to be correlated with. For example, people’s scores on a new measure of test anxiety should be negatively correlated with their performance on an important school exam. If it were found that people’s scores were in fact negatively correlated with their exam performance, then this would be a piece of evidence that these scores really represent people’s test anxiety. But if it were found that people scored equally well on the exam regardless of their test anxiety scores, then this would cast doubt on the validity of the measure.
A criterion can be any variable that one has reason to think should be correlated with the construct being measured, and there will usually be many of them. For example, one would expect test anxiety scores to be negatively correlated with exam performance and course grades and positively correlated with general anxiety and with blood pressure during an exam. Or imagine that a researcher develops a new measure of physical risk taking. People’s scores on this measure should be correlated with their participation in “extreme” activities such as snowboarding and rock climbing, the number of speeding tickets they have received, and even the number of broken bones they have had over the years. When the criterion is measured at the same time as the construct, criterion validity is referred to as ; however, when the criterion is measured at some point in the future (after the construct has been measured), it is referred to as (because scores on the measure have “predicted” a future outcome).
Discriminant validity
, on the other hand, is the extent to which scores on a measure are not correlated with measures of variables that are conceptually distinct. For example, self-esteem is a general attitude toward the self that is fairly stable over time. It is not the same as mood, which is how good or bad one happens to be feeling right now. So people’s scores on a new measure of self-esteem should not be very highly correlated with their moods. If the new measure of self-esteem were highly correlated with a measure of mood, it could be argued that the new measure is not really measuring self-esteem; it is measuring mood instead.
Increasing the reliability and validity of measures
We have reviewed the types of errors and how to evaluate our measures based on reliability and validity considerations. However, what can we do while selecting or creating our tool so that we minimize the potential of errors? Many of our options were covered in our discussion about reliability and validity. Nevertheless, the following table provides a quick summary of things that you should do when creating or selecting a measurement tool. While not all of these will be feasible in your project, it is important to include easy-to-implement measures in your research context.
Make sure that you engage in a rigorous literature review so that you understand the concept that you are studying. This means understanding the different ways that your concept may manifest itself. This review should include a search for existing instruments.[12]
- Do you understand all the dimensions of your concept? Do you have a good understanding of the content dimensions of your concept(s)?
- What instruments exist? How many items are on the existing instruments? Are these instruments appropriate for your population?
- Are these instruments standardized? Note: If an instrument is standardized, that means it has been rigorously studied and tested.
Consult content experts to review your instrument. This is a good way to check the face validity of your items. Additionally, content experts can also help you understand the content validity.[13]
- Do you have access to a reasonable number of content experts? If not, how can you locate them?
- Did you provide a list of critical questions for your content reviewers to use in the reviewing process?
Pilot test your instrument on a sufficient number of people and get detailed feedback.[14] Ask your group to provide feedback on the wording and clarity of items. Keep detailed notes and make adjustments BEFORE you administer your final tool.
- How many people will you use in your pilot testing?
- How will you set up your pilot testing so that it mimics the actual process of administering your tool?
- How will you receive feedback from your pilot testing group? Have you provided a list of questions for your group to think about?
Provide training for anyone collecting data for your project.[15] You should provide those helping you with a written research protocol that explains all of the steps of the project. You should also problem solve and answer any questions that those helping you may have. This will increase the chances that your tool will be administered in a consistent manner.
- How will you conduct your orientation/training? How long will it be? What modality?
- How will you select those who will administer your tool? What qualifications do they need?
When thinking of items, use a higher level of measurement, if possible.[16] This will provide more information and you can always downgrade to a lower level of measurement later.
- Have you examined your items and the levels of measurement?
- Have you thought about whether you need to modify the type of data you are collecting? Specifically, are you asking for information that is too specific (at a higher level of measurement) which may reduce participants’ willingness to participate?
Use multiple indicators for a variable.[17] Think about the number of items that you will include in your tool.
- Do you have enough items? Enough indicators? The correct indicators?
Conduct an item-by-item assessment of multiple-item measures.[18] When you do this assessment, think about each word and how it changes the meaning of your item.
- Are there items that are redundant? Do you need to modify, delete, or add items?
Types of error
As you can see, measures never perfectly describe what exists in the real world. Good measures demonstrate validity and reliability but will always have some degree of error. (also called bias) causes our measures to consistently output incorrect data in one direction or another on a measure, usually due to an identifiable process. Imagine you created a measure of height, but you didn’t put an option for anyone over six feet tall. If you gave that measure to your local college or university, some of the taller students might not be measured accurately. In fact, you would be under the mistaken impression that the tallest person at your school was six feet tall, when in actuality there are likely people taller than six feet at your school. This error seems innocent, but if you were using that measure to help you build a new building, those people might hit their heads!
A less innocent form of error arises when researchers word questions in a way that might cause participants to think one answer choice is preferable to another. For example, if I were to ask you “Do you think global warming is caused by human activity?” you would probably feel comfortable answering honestly. But what if I asked you “Do you agree with 99% of scientists that global warming is caused by human activity?” Would you feel comfortable saying no, if that’s what you honestly felt? I doubt it. That is an example of a , a question with wording that influences how a participant responds. We’ll discuss leading questions and other problems in question wording in greater detail in Chapter 12.
In addition to error created by the researcher, your participants can cause error in measurement. Some people will respond without fully understanding a question, particularly if the question is worded in a confusing way. Let’s consider another potential source or error. If we asked people if they always washed their hands after using the bathroom, would we expect people to be perfectly honest? Polling people about whether they wash their hands after using the bathroom might only elicit what people would like others to think they do, rather than what they actually do. This is an example of , in which participants in a research study want to present themselves in a positive, socially desirable way to the researcher. People in your study will want to seem tolerant, open-minded, and intelligent, but their true feelings may be closed-minded, simple, and biased. Participants may lie in this situation. This occurs often in political polling, which may show greater support for a candidate from a minority race, gender, or political party than actually exists in the electorate.
A related form of bias is called , also known as “yea-saying.” It occurs when people say yes to whatever the researcher asks, even when doing so contradicts previous answers. For example, a person might say yes to both “I am a confident leader in group discussions” and “I feel anxious interacting in group discussions.” Those two responses are unlikely to both be true for the same person. Why would someone do this? Similar to social desirability, people want to be agreeable and nice to the researcher asking them questions or they might ignore contradictory feelings when responding to each question. You could interpret this as someone saying “yeah, I guess.” Respondents may also act on cultural reasons, trying to “save face” for themselves or the person asking the questions. Regardless of the reason, the results of your measure don’t match what the person truly feels.
So far, we have discussed sources of error that come from choices made by respondents or researchers. Systematic errors will result in responses that are incorrect in one direction or another. For example, social desirability bias usually means that the number of people who say they will vote for a third party in an election is greater than the number of people who actually vote for that candidate. Systematic errors such as these can be reduced, but random error can never be eliminated. Unlike systematic error, which biases responses consistently in one direction or another, is unpredictable and does not consistently result in scores that are consistently higher or lower on a given measure. Instead, random error is more like statistical noise, which will likely average out across participants.
Random error is present in any measurement. If you’ve ever stepped on a bathroom scale twice and gotten two slightly different results, maybe a difference of a tenth of a pound, then you’ve experienced random error. Maybe you were standing slightly differently or had a fraction of your foot off of the scale the first time. If you were to take enough measures of your weight on the same scale, you’d be able to figure out your true weight. In social science, if you gave someone a scale measuring depression on a day after they lost their job, they would likely score differently than if they had just gotten a promotion and a raise. Even if the person were clinically depressed, our measure is subject to influence by the random occurrences of life. Thus, social scientists speak with humility about our measures. We are reasonably confident that what we found is true, but we must always acknowledge that our measures are only an approximation of reality.
Humility is important in scientific measurement, as errors can have real consequences. At the time I’m writing this, my wife and I are expecting our first child. Like most people, we used a pregnancy test from the pharmacy. If the test said my wife was pregnant when she was not pregnant, that would be a . On the other hand, if the test indicated that she was not pregnant when she was in fact pregnant, that would be a . Even if the test is 99% accurate, that means that one in a hundred women will get an erroneous result when they use a home pregnancy test. For us, a false positive would have been initially exciting, then devastating when we found out we were not having a child. A false negative would have been disappointing at first and then quite shocking when we found out we were indeed having a child. While both false positives and false negatives are not very likely for home pregnancy tests (when taken correctly), measurement error can have consequences for the people being measured.
Key Takeaways
- Reliability is a matter of consistency.
- Validity is a matter of accuracy.
- There are many types of validity and reliability.
- Systematic error may arise from the researcher, participant, or measurement instrument.
- Systematic error biases results in a particular direction, whereas random error can be in any direction.
- All measures are prone to error and should interpreted with humility.
Exercises
Use the measurement tools you located in the previous exercise. Evaluate the reliability and validity of these tools. Hint: You will need to go into the literature to “research” these tools.
- Provide a clear statement regarding the reliability and validity of these tools. What strengths did you notice? What were the limitations?
- Think about your . Are there changes that need to be made in order for one of these tools to be appropriate for your population?
- If you decide to create your own tool, how will you assess its validity and reliability?
11.4 Ethical and social justice considerations
Learning Objectives
Learners will be able to…
- Identify potential cultural, ethical, and social justice issues in measurement.
With your variables operationalized, it’s time to take a step back and look at how measurement in social science impact our daily lives. As we will see, how we measure things is both shaped by power arrangements inside our society, and more insidiously, by establishing what is scientifically true, measures have their own power to influence the world. Just like reification in the conceptual world, how we operationally define concepts can reinforce or fight against oppressive forces.

Data equity
How we decide to measure our variables determines what kind of data we end up with in our research project. Because scientific processes are a part of our sociocultural context, the same biases and oppressions we see in the real world can be manifested or even magnified in research data. Jagadish and colleagues (2021)[19] presents four dimensions of data equity that are relevant to consider: in representation of non-dominant groups within data sets; in how data is collected, analyzed, and combined across datasets; in equitable and participatory access to data, and finally in the outcomes associated with the data collection. Historically, we have mostly focused on the outcomes of measures producing outcomes that are biased in one way or another, and this section reviews many such examples. However, it is important to note that equity must also come from designing measures that respond to questions like:
- Are groups historically suppressed from the data record represented in the sample?
- Are equity data gathered by researchers and used to uncover and quantify inequity?
- Are the data accessible across domains and levels of expertise, and can community members participate in the design, collection, and analysis of the public data record?
- Are the data collected used to monitor and mitigate inequitable impacts?
So, it’s not just about whether measures work for one population for another. Data equity is about the context in which data are created from how we measure people and things. We agree with these authors that data equity should be considered within the context of automated decision-making systems and recognizing a broader literature around the role of administrative systems in creating and reinforcing discrimination. To combat the inequitable processes and outcomes we describe below, researchers must foreground equity as a core component of measurement.
Flawed measures & missing measures
At the end of every semester, students in just about every university classroom in the United States complete similar student evaluations of teaching (SETs). Since every student is likely familiar with these, we can recognize many of the concepts we discussed in the previous sections. There are number of rating scale questions that ask you to rate the professor, class, and teaching effectiveness on a scale of 1-5. Scores are averaged across students and used to determine the quality of teaching delivered by the faculty member. SETs scores are often a principle component of how faculty are reappointed to teaching positions. Would it surprise you to learn that student evaluations of teaching are of questionable quality? If your instructors are assessed with a biased or incomplete measure, how might that impact your education?
Most often, student scores are averaged across questions and reported as a final average. This average is used as one factor, often the most important factor, in a faculty member’s reappointment to teaching roles. We learned in this chapter that rating scales are ordinal, not interval or ratio, and the data are categories not numbers. Although rating scales use a familiar 1-5 scale, the numbers 1, 2, 3, 4, & 5 are really just helpful labels for categories like “excellent” or “strongly agree.” If we relabeled these categories as letters (A-E) rather than as numbers (1-5), how would you average them?
Averaging ordinal data is methodologically dubious, as the numbers are merely a useful convention. As you will learn in Chapter 14, taking the value is what makes the most sense with ordinal data. Median values are also less sensitive to outliers. So, a single student who has strong negative or positive feelings towards the professor could bias the class’s SETs scores higher or lower than what the “average” student in the class would say, particularly for classes with few students or in which fewer students completed evaluations of their teachers.
We care about teaching quality because more effective teachers will produce more knowledgeable and capable students. However, student evaluations of teaching are not particularly good indicators of teaching quality and are not associated with the independently measured learning gains of students (i.e., test scores, final grades) (Uttl et al., 2017).[20] This speaks to the lack of criterion validity. Higher teaching quality should be associated with better learning outcomes for students, but across multiple studies stretching back years, there is no association that cannot be better explained by other factors. To be fair, there are scholars who find that SETs are valid and reliable. For a thorough defense of SETs as well as a historical summary of the literature see Benton & Cashin (2012).[21]
Even though student evaluations of teaching often contain dozens of questions, researchers often find that the questions are so highly interrelated that one concept (or factor, as it is called in a factor analysis) explains a large portion of the variance in teachers’ scores on student evaluations (Clayson, 2018).[22] Personally, I believe based on completing SETs myself that factor is probably best conceptualized as student satisfaction, which is obviously worthwhile to measure, but is conceptually quite different from teaching effectiveness or whether a course achieved its intended outcomes. The lack of a clear operational and conceptual definition for the variable or variables being measured in student evaluations of teaching also speaks to a lack of content validity. Researchers check content validity by comparing the measurement method with the conceptual definition, but without a clear conceptual definition of the concept measured by student evaluations of teaching, it’s not clear how we can know our measure is valid. Indeed, the lack of clarity around what is being measured in teaching evaluations impairs students’ ability to provide reliable and valid evaluations. So, while many researchers argue that the class average SETs scores are reliable in that they are consistent over time and across classes, it is unclear what exactly is being measured even if it is consistent (Clayson, 2018).[23]
As a faculty member, there are a number of things I can do to influence my evaluations and disrupt validity and reliability. Since SETs scores are associated with the grades students perceive they will receive (e.g., Boring et al., 2016),[24] guaranteeing everyone a final grade of A in my class will likely increase my SETs scores and my chances at tenure and promotion. I could time an email reminder to complete SETs with releasing high grades for a major assignment to boost my evaluation scores. On the other hand, student evaluations might be coincidentally timed with poor grades or difficult assignments that will bias student evaluations downward. Students may also infer I am manipulating them and give me lower SET scores as a result. To maximize my SET scores and chances and promotion, I also need to select which courses I teach carefully. Classes that are more quantitatively oriented generally receive lower ratings than more qualitative and humanities-driven classes, which makes my decision to teach social work research a poor strategy (Uttl & Smibert, 2017).[25] The only manipulative strategy I will admit to using is bringing food (usually cookies or donuts) to class during the period in which students are completing evaluations. Measurement is impacted by context.
As a white cis-gender male educator, I am adversely impacted by SETs because of their sketchy validity, reliability, and methodology. The other flaws with student evaluations actually help me while disadvantaging teachers from oppressed groups. Heffernan (2021)[26] provides a comprehensive overview of the sexism, racism, ableism, and prejudice baked into student evaluations:
“In all studies relating to gender, the analyses indicate that the highest scores are awarded in subjects filled with young, white, male students being taught by white English first language speaking, able-bodied, male academics who are neither too young nor too old (approx. 35–50 years of age), and who the students believe are heterosexual. Most deviations from this scenario in terms of student and academic demographics equates to lower SET scores. These studies thus highlight that white, able-bodied, heterosexual, men of a certain age are not only the least affected, they benefit from the practice. When every demographic group who does not fit this image is significantly disadvantaged by SETs, these processes serve to further enhance the position of the already privileged” (p. 5).
The staggering consistency of studies examining prejudice in SETs has led to some rather superficial reforms like reminding students to not submit racist or sexist responses in the written instructions given before SETs. Yet, even though we know that SETs are systematically biased against women, people of color, and people with disabilities, the overwhelming majority of universities in the United States continue to use them to evaluate faculty for promotion or reappointment. From a critical perspective, it is worth considering why university administrators continue to use such a biased and flawed instrument. SETs produce data that make it easy to compare faculty to one another and track faculty members over time. Furthermore, they offer students a direct opportunity to voice their concerns and highlight what went well.
As the people with the greatest knowledge about what happened in the classroom as whether it met their expectations, providing students with open-ended questions is the most productive part of SETs. Personally, I have found focus groups written, facilitated, and analyzed by student researchers to be more insightful than SETs. MSW student activists and leaders may look for ways to evaluate faculty that are more methodologically sound and less systematically biased, creating institutional change by replacing or augmenting traditional SETs in their department. There is very rarely student input on the criteria and methodology for teaching evaluations, yet students are the most impacted by helpful or harmful teaching practices.
Students should fight for better assessment in the classroom because well-designed assessments provide documentation to support more effective teaching practices and discourage unhelpful or discriminatory practices. Flawed assessments like SETs, can lead to a lack of information about problems with courses, instructors, or other aspects of the program. Think critically about what data your program uses to gauge its effectiveness. How might you introduce areas of student concern into how your program evaluates itself? Are there issues with food or housing insecurity, mentorship of nontraditional and first generation students, or other issues that faculty should consider when they evaluate their program? Finally, as you transition into practice, think about how your agency measures its impact and how it privileges or excludes client and community voices in the assessment process.
Let’s consider an example from social work practice. Let’s say you work for a mental health organization that serves youth impacted by community violence. How should you measure the impact of your services on your clients and their community? Schools may be interested in reducing truancy, self-injury, or other behavioral concerns. However, by centering delinquent behaviors in how we measure our impact, we may be inattentive to the role of trauma, family dynamics, and other cognitive and social processes beyond “delinquent behavior.” Indeed, we may bias our interventions by focusing on things that are not as important to clients’ needs. Social workers want to make sure their programs are improving over time, and we rely on our measures to indicate what to change and what to keep. If our measures present a partial or flawed view, we lose our ability to establish and act on scientific truths.
While writing this section, one of the authors wrote this commentary article addressing potential racial bias in social work licensing exams. If you are interested in an example of missing or flawed measures that relates to systems your social work practice is governed by (rather than SETs which govern our practice in higher education) check it out!
You may also be interested in similar arguments against the standard grading scale (A-F), and why grades (numerical, letter, etc.) do not do a good job of measuring learning. Think critically about the role that grades play in your life as a student, your self-concept, and your relationships with teachers. Your test and grade anxiety is due in part to how your learning is measured. Those measurements end up becoming an official record of your scholarship and allow employers or funders to compare you to other scholars. The stakes for measurement are the same for participants in your research study.

Self-reflection and measurement
Student evaluations of teaching are just like any other measure. How we decide to measure what we are researching is influenced by our backgrounds, including our culture, implicit biases, and individual experiences. For me as a middle-class, cisgender white woman, the decisions I make about measurement will probably default to ones that make the most sense to me and others like me, and thus measure characteristics about us most accurately if I don’t think carefully about it. There are major implications for research here because this could affect the validity of my measurements for other populations.
This doesn’t mean that standardized scales or indices, for instance, won’t work for diverse groups of people. What it means is that researchers must not ignore difference in deciding how to measure a variable in their research. Doing so may serve to push already marginalized people further into the margins of academic research and, consequently, social work intervention. Social work researchers, with our strong orientation toward celebrating difference and working for social justice, are obligated to keep this in mind for ourselves and encourage others to think about it in their research, too.
This involves reflecting on what we are measuring, how we are measuring, and why we are measuring. Do we have biases that impacted how we operationalized our concepts? Did we include and in the development of our concepts? This can be a way to gain access to vulnerable populations. What feedback did we receive on our measurement process and how was it incorporated into our work? These are all questions we should ask as we are thinking about measurement. Further, engaging in this intentionally reflective process will help us maximize the chances that our measurement will be accurate and as free from bias as possible.
The NASW Code of Ethics discusses social work research and the importance of engaging in practices that do not harm participants. This is especially important considering that many of the topics studied by social workers are those that are disproportionately experienced by marginalized and oppressed populations. Some of these populations have had negative experiences with the research process: historically, their stories have been viewed through lenses that reinforced the dominant culture’s standpoint. Thus, when thinking about measurement in research projects, we must remember that the way in which concepts or constructs are measured will impact how marginalized or oppressed persons are viewed. It is important that social work researchers examine current tools to ensure appropriateness for their population(s). Sometimes this may require researchers to use existing tools. Other times, this may require researchers to adapt existing measures or develop completely new measures in collaboration with community stakeholders. In summary, the measurement protocols selected should be tailored and attentive to the experiences of the communities to be studied.
Unfortunately, social science researchers do not do a great job of sharing their measures in a way that allows social work practitioners and administrators to use them to evaluate the impact of interventions and programs on clients. Few scales are published under an open copyright license that allows other people to view it for free and share it with others. Instead, the best way to find a scale mentioned in an article is often to simply search for it in Google with “.pdf” or “.docx” in the query to see if someone posted a copy online (usually in violation of copyright law). As we discussed in Chapter 4, this is an issue of information privilege, or the structuring impact of oppression and discrimination on groups’ access to and use of scholarly information. As a student at a university with a research library, you can access the Mental Measurement Yearbook to look up scales and indexes that measure client or program outcomes while researchers unaffiliated with university libraries cannot do so. Similarly, the vast majority of scholarship in social work and allied disciplines does not share measures, data, or other research materials openly, a best practice in open and collaborative science. It is important to underscore these structural barriers to using valid and reliable scales in social work practice. An invalid or unreliable outcome test may cause ineffective or harmful programs to persist or may worsen existing prejudices and oppressions experienced by clients, communities, and practitioners.
But it’s not just about reflecting and identifying problems and biases in our measurement, operationalization, and conceptualization—what are we going to do about it? Consider this as you move through this book and become a more critical consumer of research. Sometimes there isn’t something you can do in the immediate sense—the literature base at this moment just is what it is. But how does that inform what you will do later?
A place to start: Stop oversimplifying race
We will address many more of the critical issues related to measurement in the next chapter. One way to get started in bringing cultural awareness to scientific measurement is through a critical examination of how we analyze race quantitatively. There are many important methodological objections to how we measure the impact of race. We encourage you to watch Dr. Abigail Sewell’s three-part workshop series called “Nested Models for Critical Studies of Race & Racism” for the Inter-university Consortium for Political and Social Research (ICPSR). She discusses how to operationalize and measure inequality, racism, and intersectionality and critiques researchers’ attempts to oversimplify or overlook racism when we measure concepts in social science. If you are interested in developing your social work research skills further, consider applying for financial support from your university to attend an ICPSR summer seminar like Dr. Sewell’s where you can receive more advanced and specialized training in using research for social change.
- Part 1: Creating Measures of Supraindividual Racism (2-hour video)
- Part 2: Evaluating Population Risks of Supraindividual Racism (2-hour video)
- Part 3: Quantifying Intersectionality (2-hour video)
Key Takeaways
- Social work researchers must be attentive to personal and institutional biases in the measurement process that affect marginalized groups.
- What is measured and how it is measured is shaped by power, and social workers must be critical and self-reflective in their research projects.
Exercises
Think about your current research question and the tool(s) that you will use to gather data. Even if you haven’t chosen your tools yet, think of some that you have encountered in the literature so far.
- How does your positionality and experience shape what variables you are choosing to measure and how you measure them?
- Evaluate the measures in your study for potential biases.
- If you are using measures developed by another researcher, investigate whether it is valid and reliable in other studies across cultures.
Media Attributions
- jose-martin-ramirez-carrasco-z2tinW7Z6Bw-unsplash © José Martín Ramírez Carrasco
- simone-pellegrini-L3QG_OBluT0-unsplash © Simone Pellegrini
- man-5573925_1280 © Mohamed Hassan
- detective-152085_1280 © OpenClipart-Vectors
- tommy-van-kessel-BXFY8_iii9M-unsplash © Tommy van Kessel
- markus-winkler-htShI76GLDM-unsplash © Markus Winkler
- Figure 11.1 Example Rating Scales for Closed-Ended Questionnaire Items © Rajiv S. Jhangiani, I-Chant A. Chiang, Carrie Cuttler, & Dana C. Leighton is licensed under a CC BY-NC-SA (Attribution NonCommercial ShareAlike) license
- survey-4441595_1920 © Christina Smith
- mockup-graphics-i1iqQRLULlg-unsplash © Mockup Graphics
- Test-retest reliability © Rajiv S. Jhangiani, I-Chant A. Chiang, Carrie Cuttler, & Dana C. Leighton is licensed under a CC BY-NC-SA (Attribution NonCommercial ShareAlike) license
- dartboard-5518055_1920 © FlitsArt
- error-63628_1920 © Gerd Altmann
- mitchell-griest-ImgBdiGAl4c-unsplash © Mitchell Griest
- man-5732103_1280 © Mohamed Hassan
- Milkie, M. A., & Warner, C. H. (2011). Classroom learning environments and the mental health of first grade children. Journal of Health and Social Behavior, 52, 4–22 ↵
- Kaplan, A. (1964). The conduct of inquiry: Methodology for behavioral science. San Francisco, CA: Chandler Publishing Company. ↵
- Earl Babbie offers a more detailed discussion of Kaplan’s work in his text. You can read it in: Babbie, E. (2010). The practice of social research (12th ed.). Belmont, CA: Wadsworth. ↵
- Kaplan, A. (1964). The conduct of inquiry: Methodology for behavioral science. San Francisco, CA: Chandler Publishing Company. ↵
- In this chapter, we will use the terms concept and construct interchangeably. While each term has a distinct meaning in research conceptualization, we do not believe this distinction is important enough to warrant discussion in this chapter. ↵
- Wong, Y. J., Steinfeldt, J. A., Speight, Q. L., & Hickman, S. J. (2010). Content analysis of Psychology of men & masculinity (2000–2008). Psychology of Men & Masculinity, 11(3), 170. ↵
- Kimmel, M. (2000). The gendered society. New York, NY: Oxford University Press; Kimmel, M. (2008). Masculinity. In W. A. Darity Jr. (Ed.), International encyclopedia of the social sciences (2nd ed., Vol. 5, p. 1–5). Detroit, MI: Macmillan Reference USA ↵
- Kimmel, M. & Aronson, A. B. (2004). Men and masculinities: A-J. Denver, CO: ABL-CLIO. ↵
- Krosnick, J.A. & Berent, M.K. (1993). Comparisons of party identification and policy preferences: The impact of survey question format. American Journal of Political Science, 27(3), 941-964. ↵
- Likert, R. (1932). A technique for the measurement of attitudes. Archives of Psychology,140, 1–55. ↵
- Stevens, S. S. (1946). On the Theory of Scales of Measurement. Science, 103(2684), 677-680. ↵
- Sullivan G. M. (2011). A primer on the validity of assessment instruments. Journal of graduate medical education, 3(2), 119–120. doi:10.4300/JGME-D-11-00075.1 ↵
- Sullivan G. M. (2011). A primer on the validity of assessment instruments. Journal of graduate medical education, 3(2), 119–120. doi:10.4300/JGME-D-11-00075.1 ↵
- Engel, R. & Schutt, R. (2013). The practice of research in social work (3rd. ed.). Thousand Oaks, CA: SAGE. ↵
- Engel, R. & Schutt, R. (2013). The practice of research in social work (3rd. ed.). Thousand Oaks, CA: SAGE. ↵
- Engel, R. & Schutt, R. (2013). The practice of research in social work (3rd. ed.). Thousand Oaks, CA: SAGE. ↵
- Engel, R. & Schutt, R. (2013). The practice of research in social work (3rd. ed.). Thousand Oaks, CA: SAGE. ↵
- Engel, R. & Schutt, R. (2013). The practice of research in social work (3rd. ed.). Thousand Oaks, CA: SAGE. ↵
- Jagadish, H. V., Stoyanovich, J., & Howe, B. (2021). COVID-19 Brings Data Equity Challenges to the Fore. Digital Government: Research and Practice, 2(2), 1-7. ↵
- Uttl, B., White, C. A., & Gonzalez, D. W. (2017). Meta-analysis of faculty's teaching effectiveness: Student evaluation of teaching ratings and student learning are not related. Studies in Educational Evaluation, 54, 22-42. ↵
- Benton, S. L., & Cashin, W. E. (2014). Student ratings of instruction in college and university courses. In Higher education: Handbook of theory and research (pp. 279-326). Springer, Dordrecht. ↵
- Clayson, D. E. (2018). Student evaluation of teaching and matters of reliability. Assessment & Evaluation in Higher Education, 43(4), 666-681. ↵
- Clayson, D. E. (2018). Student evaluation of teaching and matters of reliability. Assessment & Evaluation in Higher Education, 43(4), 666-681. ↵
- Boring, A., Ottoboni, K., & Stark, P. (2016). Student evaluations of teaching (mostly) do not measure teaching effectiveness. ScienceOpen Research. ↵
- Uttl, B., & Smibert, D. (2017). Student evaluations of teaching: teaching quantitative courses can be hazardous to one’s career. Peer Journal, 5, e3299. ↵
- Heffernan, T. (2021). Sexism, racism, prejudice, and bias: a literature review and synthesis of research surrounding student evaluations of courses and teaching. Assessment & Evaluation in Higher Education, 1-11. ↵
The process by which we describe and ascribe meaning to the key facts, concepts, or other phenomena under investigation in a research study.
In measurement, conditions that are easy to identify and verify through direct observation.
In measurement, conditions that are subtle and complex that we must use existing knowledge and intuition to define.
Conditions that are not directly observable and represent states of being, experiences, and ideas.
A mental image that summarizes a set of similar observations, feelings, or ideas
developing clear, concise definitions for the key concepts in a research question
concepts that are comprised of multiple elements
concepts that are expected to have a single underlying dimension
assuming that abstract concepts exist in some concrete, tangible way
process by which researchers spell out precisely how a concept will be measured in their study
Clues that demonstrate the presence, intensity, or other aspects of a concept in the real world
unprocessed data that researchers can analyze using quantitative and qualitative methods (e.g., responses to a survey or interview transcripts)
a characteristic that does not change in a study
The characteristics that make up a variable
variables whose values are organized into mutually exclusive groups but whose numerical values cannot be used in mathematical operations.
variables whose values are mutually exclusive and can be used in mathematical operations
The lowest level of measurement; categories cannot be mathematically ranked, though they are exhaustive and mutually exclusive
Exhaustive categories are options for closed ended questions that allow for every possible response (no one should feel like they can't find the answer for them).
Mutually exclusive categories are options for closed ended questions that do not overlap, so people only fit into one category or another, not both.
Level of measurement that follows nominal level. Has mutually exclusive categories and a hierarchy (rank order), but we cannot calculate a mathematical distance between attributes.
An ordered set of responses that participants must choose from.
A level of measurement that is continuous, can be rank ordered, is exhaustive and mutually exclusive, and for which the distance between attributes is known to be equal. But for which there is no zero point.
The highest level of measurement. Denoted by mutually exclusive categories, a hierarchy (order), values can be added, subtracted, multiplied, and divided, and the presence of an absolute zero.
measuring people’s attitude toward something by assessing their level of agreement with several statements about it
Composite (multi-item) scales in which respondents are asked to indicate their opinions or feelings toward a single statement using different pairs of adjectives framed as polar opposites.
A composite scale using a series of items arranged in increasing order of intensity of the construct of interest, from least intense to most intense.
measurements of variables based on more than one one indicator
An empirical structure for measuring items or indicators of the multiple dimensions of a concept.
a composite score derived from aggregating measures of multiple concepts (called components) using a set of rules and formulas
The ability of a measurement tool to measure a phenomenon the same way, time after time. Note: Reliability does not imply validity.
The extent to which scores obtained on a scale or other measure are consistent across time
The consistency of people’s responses across the items on a multiple-item measure. Responses about the same underlying construct should be correlated, though not perfectly.
The extent to which different observers are consistent in their assessment or rating of a particular characteristic or item.
The extent to which the scores from a measure represent the variable they are intended to.
The extent to which a measurement method appears “on its face” to measure the construct of interest
The extent to which a measure “covers” the construct of interest, i.e., it's comprehensiveness to measure the construct.
The extent to which people’s scores on a measure are correlated with other variables (known as criteria) that one would expect them to be correlated with.
A type of criterion validity. Examines how well a tool provides the same scores as an already existing tool administered at the same point in time.
A type of criterion validity that examines how well your tool predicts a future criterion.
The extent to which scores on a measure are not correlated with measures of variables that are conceptually distinct.
(also known as bias) refers to when a measure consistently outputs incorrect data, usually in one direction and due to an identifiable process
When a participant's answer to a question is altered due to the way in which a question is written. In essence, the question leads the participant to answer in a specific way.
Social desirability bias occurs when we create questions that lead respondents to answer in ways that don't reflect their genuine thoughts or feelings to avoid being perceived negatively.
In a measure, when people say yes to whatever the researcher asks, even when doing so contradicts previous answers.
Unpredictable error that does not result in scores that are consistently higher or lower on a given measure but are nevertheless inaccurate.
when a measure indicates the presence of a phenomenon, when in reality it is not present
when a measure does not indicate the presence of a phenomenon, when in reality it is present
the group of people whose needs your study addresses
The value in the middle when all our values are placed in numerical order. Also called the 50th percentile.
individuals or groups who have an interest in the outcome of the study you conduct
the people or organizations who control access to the population you want to study

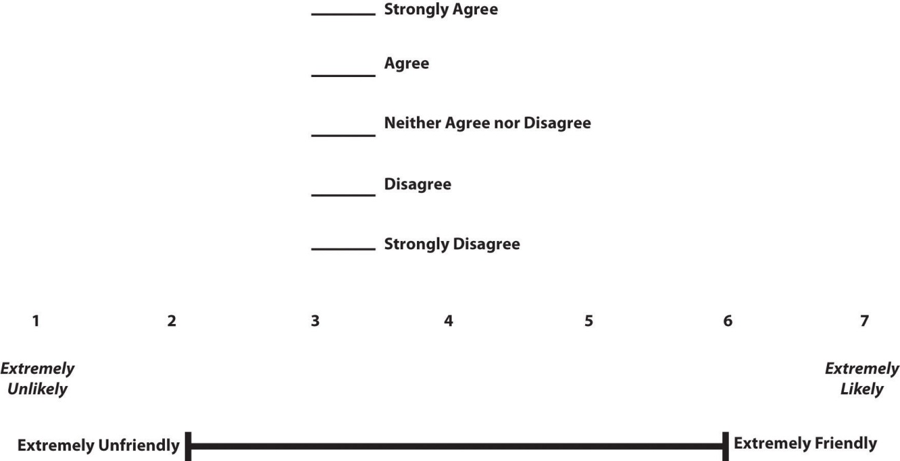