
Part 3: Using quantitative methods
12. Survey design
Chapter Outline
- What is a survey, and when should you use one? (14 minute read)
- Collecting data using surveys (29 minute read)
- Writing effective questions and questionnaires (38 minute read)
- Bias and cultural considerations (22 minute read)
Content warning: examples in this chapter contain references to drug use, racism in politics, COVD-19, undocumented immigration, basic needs insecurity in higher education, school discipline, drunk driving, poverty, child sexual abuse, colonization and Global North/West hegemony, and ethnocentrism in science.
12.1 What is a survey, and when should you use one?
Learning Objectives
Learners will be able to…
- Distinguish between survey as a research design and questionnaires used to measure concepts
- Identify the strengths and weaknesses of surveys
- Evaluate whether survey design fits with their research question
Students in my research methods classes often feel that surveys are self-explanatory. This feeling is understandable. Surveys are part of our everyday lives. Every time you call customer service, purchase a meal, or participate in a program, someone is handing you a survey to complete. Survey results are often discussed in the news, and perhaps you’ve even carried our a survey yourself. What could be so hard? Ask people a few quick questions about your research question and you’re done, right?
Students quickly learn that there is more to constructing a good survey than meets the eye. Survey design takes a great deal of thoughtful planning and often many rounds of revision, but it is worth the effort. As we’ll learn in this section, there are many benefits to choosing survey research as your data collection method particularly for student projects. We’ll discuss what a survey is, its potential benefits and drawbacks, and what research projects are the best fit for survey design.
Is survey research right for your project?
To answer this question, the first thing we need to do is distinguish between a survey and a questionnaire. They might seem like they are the same thing, and in normal non-research contexts, they are used interchangeably. In this textbook, we define a as a research design in which a researcher poses a set of predetermined questions to an entire group, or , of individuals. That set of questions is the , a research instrument consisting of a set of questions (items) intended to capture responses from participants in a standardized manner. Basically, researchers use questionnaires as part of survey research. Questionnaires are the tool. Surveys are one research design for using that tool.
Let’s contrast how survey research uses questionnaires with the other quantitative design we will discuss in this book—. Questionnaires in experiments are called and and they measure how participants change over time as a result of an intervention (e.g., a group therapy session) or a stimulus (e.g., watching a video of a political speech) introduced by the researcher. We will discuss experiments in greater detail in Chapter 13, but if testing an intervention or measuring how people react to something you do sounds like what you want to do with your project, experiments might be the best fit for you.

Surveys, on the other hand, do not measure the impact of an intervention or stimulus introduced by the researcher. Instead, surveys look for patterns that already exist in the world based on how people self-report on a questionnaire. simply means that the participants in your research study are answering questions about themselves, regardless of whether they are presented on paper, electronically, or read aloud by the researcher. Questionnaires structure self-report data into a standardized format—with everyone receiving the exact same questions and answer choices in the same order[1]—which makes comparing data across participants much easier. Researchers using surveys try to influence their participants as little as possible because they want honest answers.
Questionnaires are completed by individual people, so the is almost always individuals, rather than groups or organizations. Generally speaking, individuals provide the most informed data about their own lives and experiences, so surveys often also use individuals as the . Surveys are also helpful in analyzing dyads, families, groups, organizations, and communities, but regardless of the unit of analysis, the unit of observation for surveys is usually individuals. Keep this in mind as you think about sampling for your project.
In some cases, getting the most-informed person to complete your questionnaire may not be . As we discussed in Chapter 2 and Chapter 6, ethical duties to protect clients and vulnerable community members mean student research projects often study practitioners and other less-vulnerable populations rather than clients and community members. The ethical supervision needed via the IRB to complete projects that pose significant risks to participants takes time and effort, and as a result, student projects often rely on key informants like clinicians, teachers, and administrators who are less likely to be harmed by the survey. are people who are especially knowledgeable about your topic. If your study is about nursing, you should probably survey nurses. These considerations are more thoroughly addressed in Chapter 10. Sometimes, participants complete surveys on behalf of people in your target population who are infeasible to survey for some reason. Some examples of key informants include a head of household completing a survey about family finances or an administrator completing a survey about staff morale on behalf of their employees. In this case, the survey respondent is a , providing their best informed guess about the responses other people might have chosen if they were able to complete the survey independently. You are relying on an individual unit of observation (one person filling out a self-report questionnaire) and group or organization unit of analysis (the family or organization the researcher wants to make conclusions about). Proxies are commonly used when the target population is not capable of providing consent or appropriate answers, as in young children and people with disabilities.
Proxies are relying on their best judgment of another person’s experiences, and while that is valuable information, it may introduce bias and error into the research process. Student research projects, due to time and resource constraints, often include sampling people with second-hand knowledge, and this is simply one of many common limitations of their findings. Remember, every project has limitations. Social work researchers look for the most favorable choices in design and methodology, as there are no perfect projects. If you are planning to conduct a survey of people with second-hand knowledge of your topic, consider reworking your research question to be about something they have more direct knowledge about and can answer easily. One common missed opportunity I see is student researchers who want to understand client outcomes (unit of analysis) by surveying practitioners (unit of observation). If a practitioner has a caseload of 30 clients, it’s not really possible to answer a question like “how much progress have your clients made?” on a survey. Would they just average all 30 clients together? Instead, design a survey that asks them about their education, professional experience, and other things they know about first-hand. By making your unit of analysis and unit of observation the same, you can ensure the people completing your survey are able to provide informed answers.
Researchers may introduce measurement error if the person completing the questionnaire does not have adequate knowledge or has a biased opinion about the phenomenon of interest. For instance, many schools of social work market themselves based on the rankings of social work programs published by US News and World Report. Last updated in 2019, the methodology for these rankings is simply to send out a survey to deans, directors, and administrators at schools of social work. No graduation rates, teacher evaluations, licensure pass rates, accreditation data, or other considerations are a part of these rankings. It’s literally a popularity contest in which each school is asked to rank the others on a scale of 1-5, and ranked by highest average score. What if an informant is unfamiliar with a school or has a personal bias against a school?[2] This could significantly skew results. One might also question the validity of such a questionnaire in assessing something as important and economically impactful as the quality of social work education. We might envision how students might demand and create more authentic measures of school quality.
In summary, survey design best fits with research projects that have the following attributes:
- Researchers plan to collect their own raw data, rather than secondary analysis of existing data.
- Researchers have access to the most knowledgeable people (that you can feasibly and ethically sample) to complete the questionnaire.
- Research question is best answered with quantitative methods.
- Individuals are the unit of observation, and in many cases, the unit of analysis.
- Researchers will try to observe things objectively and try not to influence participants to respond differently.
- Research questions asks about indirect observables—things participants can self-report on a questionnaire.
- There are valid, reliable, and commonly used scales (or other self-report measures) for the variables in the research question.

Strengths of survey methods
Researchers employing survey research as a research design enjoy a number of benefits. First, surveys are an excellent way to gather lots of information from many people. In a study by Blackstone (2013)[3] on older people’s experiences in the workplace, researchers were able to mail a written questionnaire to around 500 people who lived throughout the state of Maine at a cost of just over $1,000. This cost included printing copies of a seven-page survey, printing a cover letter, addressing and stuffing envelopes, mailing the survey, and buying return postage for the survey. We realize that $1,000 is nothing to sneeze at, but just imagine what it might have cost to visit each of those people individually to interview them in person. You would have to dedicate a few weeks of your life at least, drive around the state, and pay for meals and lodging to interview each person individually. Researchers can double, triple, or even quadruple their costs pretty quickly by opting for an in-person method of data collection over a mailed survey. Thus, surveys are relatively cost-effective.
Related to the benefit of cost-effectiveness is a survey’s potential for generalizability. Because surveys allow researchers to collect data from very large samples for a relatively low cost, survey methods lend themselves to probability sampling techniques, which we discussed in Chapter 10. When used with probability sampling approaches, survey research is the best method to use when one hopes to gain a representative picture of the attitudes and characteristics of a large group. Unfortunately, student projects are quite often not able to take advantage of the generalizability of surveys because they use availability sampling rather than the more costly and time-intensive random sampling approaches that are more likely to elicit a representative sample. While the conclusions drawn from availability samples have far less generalizability, surveys are still a great choice for student projects and they provide data that can be followed up on by well-funded researchers to generate generalizable research.
Survey research is particularly adept at investigating . Indirect observables are things we have to ask someone to self-report because we cannot observe them directly, such as people’s preferences (e.g., political orientation), traits (e.g., self-esteem), attitudes (e.g., toward immigrants), beliefs (e.g., about a new law), behaviors (e.g., smoking or drinking), or factual information (e.g., income). Unlike qualitative studies in which these beliefs and attitudes would be detailed in unstructured conversations, surveys seek to systematize answers so researchers can make apples-to-apples comparisons across participants. Surveys are so flexible because you can ask about anything, and the variety of questions allows you to expand social science knowledge beyond what is naturally observable.
Survey research also tends to be a method of inquiry. This is because surveys are standardized in that the same questions, phrased in exactly the same way, as they are posed to participants. Other methods, such as qualitative interviewing, which we’ll learn about in Chapter 18, do not offer the same consistency that a quantitative survey offers. This is not to say that all surveys are always reliable. A poorly phrased question can cause respondents to interpret its meaning differently, which can reduce that question’s reliability. Assuming well-constructed questions and survey design, one strength of this methodology is its potential to produce reliable results.
The versatility of survey research is also an asset. Surveys are used by all kinds of people in all kinds of professions. They can measure anything that people can self-report. Surveys are also appropriate for exploratory, descriptive, and explanatory research questions (though exploratory projects may benefit more from qualitative methods). Moreover, they can be delivered in a number of flexible ways, including via email, mail, text, and phone. We will describe the many ways to implement a survey later on in this chapter.
In sum, the following are benefits of survey research:
- Cost-effectiveness
- Generalizability
- Variety
- Reliability
- Versatility

Weaknesses of survey methods
As with all methods of data collection, survey research also comes with a few drawbacks. First, while one might argue that surveys are flexible in the sense that you can ask any kind of question about any topic we want, once the survey is given to the first participant, there is nothing you can do to change the survey without biasing your results. Because surveys want to minimize the amount of influence that a researcher has on the participants, everyone gets the same questionnaire. Let’s say you mail a questionnaire out to 1,000 people and then discover, as responses start coming in, that your phrasing on a particular question seems to be confusing a number of respondents. At this stage, it’s too late for a do-over or to change the question for the respondents who haven’t yet returned their questionnaires. When conducting qualitative interviews or focus groups, on the other hand, a researcher can provide respondents further explanation if they’re confused by a question and can tweak their questions as they learn more about how respondents seem to understand them. Survey researchers often ask colleagues, students, and others to pilot test their questionnaire and catch any errors prior to sending it to participants; however, once researchers distribute the survey to participants, there is little they can do to change anything.
Depth can also be a problem with surveys. Survey questions are standardized; thus, it can be difficult to ask anything other than very general questions that a broad range of people will understand. Because of this, survey results may not provide as detailed of an understanding as results obtained using methods of data collection that allow a researcher to more comprehensively examine whatever topic is being studied. Let’s say, for example, that you want to learn something about voters’ willingness to elect an African American president. General Social Survey respondents were asked, “If your party nominated an African American for president, would you vote for him if he were qualified for the job?” (Smith, 2009).[4] Respondents were then asked to respond either yes or no to the question. But what if someone’s opinion was more complex than could be answered with a simple yes or no? What if, for example, a person was willing to vote for an African American man, but only if that person was a conservative, moderate, anti-abortion, antiwar, etc. Then we would miss out on that additional detail when the participant responded “yes,” to our question. Of course, you could add a question to your survey about moderate vs. radical candidates, but could you do that for all of the relevant attributes of candidates for all people? Moreover, how do you know that moderate or antiwar means the same thing to everyone who participates in your survey? Without having a conversation with someone and asking them follow up questions, survey research can lack enough detail to understand how people truly think.
In sum, potential drawbacks to survey research include the following:
- Inflexibility
- Lack of depth
- Problems specific to cross-sectional surveys, which we will address in the next section.
Secondary analysis of survey data
This chapter is designed to help you conduct your own survey, but that is not the only option for social work researchers. Look back to Chapter 2 and recall our discussion of . As we talked about previously, using data collected by another researcher can have a number of benefits. Well-funded researchers have the resources to recruit a large representative sample and ensure their measures are valid and reliable prior to sending them to participants. Before you get too far into designing your own data collection, make sure there are no existing data sets out there that you can use to answer your question. We refer you to Chapter 2 for all full discussion of the strengths and challenges of using secondary analysis of survey data.
Key Takeaways
- Strengths of survey research include its cost effectiveness, generalizability, variety, reliability, and versatility.
- Weaknesses of survey research include inflexibility and lack of potential depth. There are also weaknesses specific to cross-sectional surveys, the most common type of survey.
Exercises
If you are using quantitative methods in a student project, it is very likely that you are going to use survey design to collect your data.
- Check to make sure that your research question and study fit best with survey design using the criteria in this section
- Remind yourself of any limitations to generalizability based on your sampling frame.
- Refresh your memory on the operational definitions you will use for your dependent and independent variables.
12.2 Collecting data using surveys
Learning Objectives
Learners will be able to…
- Distinguish between cross-sectional and longitudinal surveys
- Identify the strengths and limitations of each approach to collecting survey data, including the timing of data collection and how the questionnaire is delivered to participants
As we discussed in the previous chapter, surveys are versatile and can be shaped and suited to most topics of inquiry. While that makes surveys a great research tool, it also means there are many options to consider when designing your survey. The two main considerations for designing surveys is how many times researchers will collect data from participants and how researchers contact participants and record responses to the questionnaire.
![]()
Cross-sectional surveys: A snapshot in time
Think back to the last survey you took. Did you respond to the questionnaire once or did you respond to it multiple times over a long period? are administered only one time. Chances are the last survey you took was a cross-sectional survey—a one-shot measure of a sample using a questionnaire. And chances are if you are conducting a survey to collect data for your project, it will be cross-sectional simply because it is more feasible to collect data once than multiple times.
Let’s take a very recent example, the COVID-19 pandemic. Enriquez and colleagues (2021)[5] wanted to understand the impact of the pandemic on undocumented college students’ academic performance, attention to academics, financial stability, mental and physical health, and other factors. In cooperation with offices of undocumented student support at eighteen campuses in California, the researchers emailed undocumented students a few times from March through June of 2020 and asked them to participate in their survey via an online questionnaire. Their survey presents an compelling look at how COVID-19 worsened existing economic inequities in this population.
Strengths and weaknesses of cross-sectional surveys
Cross-sectional surveys are great. They take advantage of many of the strengths of survey design. They are easy to administer since you only need to measure your participants once, which makes them highly suitable for student projects. Keeping track of participants for multiple measures takes time and energy, two resources always under constraint in student projects. Conducting a cross-sectional survey simply requires collecting a sample of people and getting them to fill out your questionnaire—nothing more.
That convenience comes with a tradeoff. When you only measure people at one point in time, you can miss a lot. The events, opinions, behaviors, and other phenomena that such surveys are designed to assess don’t generally remain the same over time. Because nomothetic causal explanations seek a general, universal truth, surveys conducted a decade ago do not represent what people think and feel today or twenty years ago. In student research projects, this weakness is often compounded by the use of availability sampling, which further limits the generalizability of the results in student research projects to other places and times beyond the sample collected by the researcher. Imagine generalizing results on the use of telehealth in social work prior to the COVID-19 pandemic or managers’ willingness to allow employees to telecommute. Both as a result of shocks to the system—like COVID-19—and the linear progression of cultural, economic and social change—like human rights movements—cross-sectional surveys can never truly give us a timeless causal explanation. In our example about undocumented students during COVID-19, you can say something about the way things were in the moment that you administered your survey, but it is difficult to know whether things remained that way for long after you administered your survey or describe patterns that go back far in time.
Of course, just as society changes over time, so do people. Because cross-sectional surveys only measure people at one point in time, they have difficulty establishing cause-and-effect relationships for individuals because they cannot clearly establish whether the cause came before the effect. If your research question were about how school discipline (our independent variable) impacts substance use (our dependent variable), you would want to make that any changes in our dependent variable, substance use, came after changes in school discipline. That is, if your hypothesis is that says school discipline causes increases in substance use, you must establish that school discipline came first and increases in substance use came afterwards. However, it is perhaps just as likely that increased substance use might cause increases in school discipline. If you sent a cross-sectional survey to students asking them about their substance use and disciplinary record, you would get back something like “tried drugs or alcohol 6 times” and “has been suspended 5 times.” You could see whether similar patterns existed in other students, but you wouldn’t be able to tell which was the cause or the effect.
Because of these limitations, cross-sectional surveys are limited in how well they can establish whether a nomothetic causal relationship is true or not. Surveys are still a key part of establishing causality. But they need additional help and support to make causal arguments. That might come from combining data across surveys in meta-analyses and systematic reviews, integrating survey findings with theories that explain causal relationships among variables in the study, as well as corroboration from research using other designs, theories, and paradigms. Scientists can establish causal explanations, in part, based on survey research. However, in keeping with the assumptions of postpositivism, the picture of reality that emerges from survey research is only our best approximation of what is objectively true about human beings in the social world. Science requires a multi-disciplinary conversation among scholars to continually improve our understanding.

Longitudinal surveys: Measuring change over time
One way to overcome this sometimes-problematic aspect of cross-sectional surveys is to administer a . Longitudinal surveys enable a researcher to make observations over some extended period of time. There are several types of longitudinal surveys, including trend, panel, and cohort surveys. We’ll discuss all three types here, along with retrospective surveys, which fall somewhere in between cross-sectional and longitudinal surveys.
The first type of longitudinal survey is called a . The main focus of a trend survey is, perhaps not surprisingly, trends. Researchers conducting trend surveys are interested in how people in a specific group change over time. Each time researchers gather data, they survey different people from the identified group because they are interested in the trends of the whole group, rather than changes in specific individuals. Let’s look at an example.
The Monitoring the Future Study is a trend study that described the substance use of high school children in the United States. It’s conducted annually by the National Institute on Drug Abuse (NIDA). Each year, the NIDA distributes surveys to children in high schools around the country to understand how substance use and abuse in that population changes over time. Perhaps surprisingly, fewer high school children reported using alcohol in the past month than at any point over the last 20 years—a fact that often surprises people because it cuts against the stereotype of adolescents engaging in ever-riskier behaviors. Nevertheless, recent data also reflected an increased use of e-cigarettes and the popularity of e-cigarettes with no nicotine over those with nicotine. By tracking these data points over time, we can better target substance abuse prevention programs towards the current issues facing the high school population.
Unlike trend surveys, panel surveys require the same people participate in the survey each time it is administered. As you might imagine, panel studies can be difficult and costly. Imagine trying to administer a survey to the same 100 people every year, for 5 years in a row. Keeping track of where respondents live, when they move, and when they change phone numbers takes resources that researchers often don’t have. However, when the researchers do have the resources to carry out a panel survey, the results can be quite powerful. The Youth Development Study (YDS), administered from the University of Minnesota, offers an excellent example of a panel study.
Since 1988, YDS researchers have administered an annual survey to the same 1,000 people. Study participants were in ninth grade when the study began, and they are now in their thirties. Several hundred papers, articles, and books have been written using data from the YDS. One of the major lessons learned from this panel study is that work has a largely positive impact on young people (Mortimer, 2003).[6] Contrary to popular beliefs about the impact of work on adolescents’ school performance and transition to adulthood, work increases confidence, enhances academic success, and prepares students for success in their future careers. Without this panel study, we may not be aware of the positive impact that working can have on young people.
Another type of longitudinal survey is a cohort survey. In a cohort survey, the participants have a defining characteristic that the researcher is interested in studying. The same people don’t necessarily participate from year to year, but all participants must meet whatever categorical criteria fulfill the researcher’s primary interest. Common cohorts that researchers study include people of particular generations or people born around the same time period, graduating classes, people who began work in a given industry at the same time, or perhaps people who have some specific historical experience in common. An example of this sort of research can be seen in Lindert and colleagues (2020)[7] work on healthy aging in men. Their article is a secondary analysis of longitudinal data collected as part of the Veterans Affairs Normative Aging Study conducted in 1985, 1988, and 1991.

Strengths and weaknesses of longitudinal surveys
All three types of longitudinal surveys share the strength that they permit a researcher to make observations over time. Whether a major world event takes place or participants mature, researchers can effectively capture the subsequent potential changes in the phenomenon or behavior of interest. This is the key strength of longitudinal surveys—their ability to establish temporality needed for nomothetic causal explanations. Whether your project investigates changes in society, communities, or individuals, longitudinal designs improve on cross-sectional designs by providing data at multiple points in time that better establish causality.
Of course, all of that extra data comes at a high cost. If a panel survey takes place over ten years, the research team must keep track of every individual in the study for those ten years, ensuring they have current contact information for their sample the whole time. Consider this study which followed people convicted of driving under the influence of drugs or alcohol (Kleschinsky et al., 2009).[8] It took an average of 8.6 contacts for participants to complete follow-up surveys, and while this was a difficult-to-reach population, researchers engaging in longitudinal research must prepare for considerable time and expense in tracking participants. Keeping in touch with a participant for a prolonged period of time likely requires building participant motivation to stay in the study, maintaining contact at regular intervals, and providing monetary compensation. Panel studies are not the only costly longitudinal design. Trend studies need to recruit a new sample every time they collect a new wave of data at additional cost and time.
In my years as a research methods instructor, I have never seen a longitudinal survey design used in a student research project because students do not have enough time to complete them. Cross-sectional surveys are simply the most convenient and feasible option. Nevertheless, social work researchers with more time to complete their studies use longitudinal surveys to understand causal relationships that they cannot manipulate themselves. A researcher could not ethically experiment on participants by assigning a jail sentence or relapse, but longitudinal surveys allow us to systematically investigate such sensitive phenomena ethically. Indeed, because longitudinal surveys observe people in everyday life, outside of the artificial environment of the laboratory (as in experiments), the generalizability of longitudinal survey results to real-world situations may make them superior to experiments, in some cases.
Table 12.1 summarizes these three types of longitudinal surveys.
| Sample type | Description |
| Trend | Researcher examines changes in trends over time; the same people do not necessarily participate in the survey more than once. |
| Panel | Researcher surveys the exact same sample several times over a period of time. |
| Cohort | Researcher identifies a defining characteristic and then regularly surveys people who have that characteristic. |
Retrospective surveys: Good, but not the best of both worlds
Retrospective surveys try to strike a middle ground between the two types of surveys. They are similar to other longitudinal studies in that they deal with changes over time, but like a cross-sectional study, data are collected only once. In a retrospective survey, participants are asked to report events from the past. By having respondents report past behaviors, beliefs, or experiences, researchers are able to gather longitudinal-like data without actually incurring the time or expense of a longitudinal survey. Of course, this benefit must be weighed against the possibility that people’s recollections of their pasts may be faulty. Imagine that you are participating in a survey that asks you to respond to questions about your feelings on Valentine’s Day. As last Valentine’s Day can’t be more than 12 months ago, there is a good chance that you are able to provide a pretty accurate response of how you felt. Now let’s imagine that the researcher wants to know how last Valentine’s Day compares to previous Valentine’s Days, so the survey asks you to report on the preceding six Valentine’s Days. How likely is it that you will remember how you felt at each one? Will your responses be as accurate as they might have been if your data were collected via survey once a year rather reporting the past few years today? The main limitation with retrospective surveys are that they are not as reliable as cross-section or longitudinal surveys. That said, retrospective surveys are a feasible way to collect longitudinal data when the researcher only has access to the population once, and for this reason, they may be worth the drawback of greater risk of bias and error in the measurement process.
Because quantitative research seeks to build nomothetic causal explanations, it is important to determine the order in which things happen. When using survey design to investigate causal relationships between variables in a research question, longitudinal surveys are certainly preferable because they can track changes over time and therefore provide stronger evidence for cause-and-effect relationships. As we discussed, the time and cost required to administer a longitudinal survey can be prohibitive, and most survey research in the scholarly literature is cross-sectional because it is more feasible to collect data once. Well designed cross-sectional surveys provide can provide important evidence for a causal relationship, even if it is imperfect. Once you decide how many times you will collect data from your participants, the next step is to figure out how to get your questionnaire in front of participants.

Self-administered questionnaires
If you are planning to conduct a survey for your research project, chances are you have thought about how you might deliver your survey to participants. If you don’t have a clear picture yet, look back at your work from Chapter 11 on the sampling approach for your project. How are you planning to recruit participants from your sampling frame? If you are considering contacting potential participants via phone or email, perhaps you want to collect your data using a phone or email survey attached to your recruitment materials. If you are planning to collect data from students, colleagues, or other people you most commonly interact with in-person, maybe you want to consider a pen-and-paper survey to collect your data conveniently. As you review the different approaches to administering surveys below, consider how each one matches with your sampling approach and the contact information you have for study participants. Ensure that your sampling approach is feasible conduct before building your survey design from it. For example, if you are planning to administer an online survey, make sure you have email addresses to send your questionnaire or permission to post your survey to an online forum.
Surveys are a versatile research approach. Survey designs vary not only in terms of when they are administered but also in terms of how they are administered. One common way to collect data is in the form of . Self-administered means that the research participant completes the questions independently, usually in writing. Paper questionnaires can be delivered to participants via mail or in person whenever you see your participants. Generally, student projects use in-person collection of paper questionnaires, as mail surveys require physical addresses, spending money, and waiting for the mail. It is common for academic researchers to administer surveys in large social science classes, so perhaps you have taken a survey that was given to you in-person during undergraduate classes. These professors were taking advantage of the same convenience sampling approach that student projects often do. If everyone in your sampling frame is in one room, going into that room and giving them a quick paper survey to fill out is a feasible and convenient way to collect data. Availability sampling may involve asking your sampling frame to complete your study during when they naturally meet—colleagues at a staff meeting, students in the student lounge, professors in a faculty meeting—and self-administered questionnaires are one way to take advantage of this natural grouping of your target population. Try to pick a time and situation when people have the downtime needed to complete your questionnaire, and you can maximize the likelihood that people will participate in your in-person survey. Of course, this convenience may come at the cost of privacy and confidentiality. If your survey addresses sensitive topics, participants may alter their responses because they are in close proximity to other participants while they complete the survey. Regardless of whether participants feel self-conscious or talk about their answers with one another, by potentially altering the participants’ honest response you may have introduced bias or error into your measurement of the variables in your research question.
Because student research projects often rely on availability sampling, collecting data using paper surveys from whoever in your sampling frame is convenient makes sense because the results will be of limited generalizability. But for researchers who aim to generalize (and students who want to publish their study!), self-administered surveys may be better distributed via the mail or electronically. While is very unusual for a student project to send a questionnaire via the mail, this method is used quite often in the scholarly literature and for good reason. Survey researchers who deliver their surveys via postal mail often provide some advance notice to respondents about the survey to get people thinking and preparing to complete it. They may also follow up with their sample a few weeks after their survey has been sent out. This can be done not only to remind those who have not yet completed the survey to please do so but also to thank those who have already returned the survey. Most survey researchers agree that this sort of follow-up is essential for improving mailed surveys’ return rates (Babbie, 2010). [6] Other helpful tools to increase response rate are to create an attractive and professional survey, offer monetary incentives, and provide a pre-addressed, stamped return envelope. These are also effective for other types of surveys.
While snail mail may not be feasible for student project, it is increasingly common for student projects and social science projects to use email and other modes of online delivery like social media to collect responses to a questionnaire. Researchers like online delivery for many reasons. It’s quicker than knocking on doors in a neighborhood for an in-person survey or waiting for mailed surveys to be returned. It’s cheap, too. There are many free tools like Google Forms and Survey Monkey (which includes a premium option). While you are affiliated with a university, you may have access to commercial research software like Redcap or Qualtrics which provide much more advanced tools for collecting survey data than free options. Online surveys can take advantage of the advantages of computer-mediated data collection by playing a video before asking a question, tracking how long participants take to answer each question, and making sure participants don’t fill out the survey more than once (to name a few examples. Moreover, survey data collected via online forms can be exported for analysis in spreadsheet software like Google Sheets or Microsoft Excel or statistics software like SPSS or JASP, a free and open-source alternative to SPSS. While the exported data still need to be checked before analysis, online distribution saves you the trouble of manually inputting every response a participant writes down on a paper survey into a computer to analyze.
The process of collecting data online depends on your sampling frame and approach to recruitment. If your project plans to reach out to people via email to ask them to participate in your study, you should attach your survey to your recruitment email. You already have their attention, and you may not get it again (even if you remind them). Think pragmatically. You will need access to the email addresses of people in your sampling frame. You may be able to piece together a list of email addresses based on public information (e.g., faculty email addresses are on their university webpage, practitioner emails are in marketing materials). In other cases, you may know of a pre-existing list of email addresses to which your target population subscribes (e.g., all undergraduate students in a social work program, all therapists at an agency), and you will need to gain the permission of the list’s administrator recruit using the email platform. Other projects will identify an online forum in which their target population congregates and recruit participants there. For example, your project might identify a Facebook group used by students in your social work program or practitioners in your local area to distribute your survey. Of course, you can post a survey to your personal social media account (or one you create for the survey), but depending on your question, you will need a detailed plan on how to reach participants with enough relevant knowledge about your topic to provide informed answers to your questionnaire.
Many of the suggestions that were provided earlier to improve the response rate of hard copy questionnaires also apply to online questionnaires, including the development of an attractive survey and sending reminder emails. One challenge not present in mail surveys is the spam filter or junk mail box. While people will at least glance at recruitment materials send via mail, email programs may automatically filter out recruitment emails so participants never see them at all. While the financial incentives that can be provided online differ from those that can be given in person or by mail, online survey researchers can still offer completion incentives to their respondents. Over the years, I’ve taken numerous online surveys. Often, they did not come with any incentive other than the joy of knowing that I’d helped a fellow social scientist do their job. However, some surveys have their perks. One survey offered a coupon code to use for $30 off any order at a major online retailer and another allowed the opportunity to be entered into a lottery with other study participants to win a larger gift, such as a $50 gift card or a tablet computer. Student projects should not pay participants unless they have grant funding to cover that cost, and there should be no expectations of any out-of-pocket costs for students to complete their research project.
One area in which online surveys are less suitable than mail or in-person surveys is when your target population includes individuals with limited, unreliable, or no access to the internet or individuals with limited computer skills. For these groups, an online survey is inaccessible. At the same time, online surveys offer the most feasible way to collect data anonymously. By posting recruitment materials to a Facebook group or list of practitioners at an agency, you can avoid collecting identifying information from people who participated in your study. For studies that address sensitive topics, online surveys also offer the opportunity to complete the survey privately (again, assuming participants have access to a phone or personal computer). If you have the person’s email address, physical address, or met them in-person, your participants are not anonymous, but if you need to collect data anonymously, online tools offer a feasible way to do so.
The best way to collect data using self-administered questionnaires depends on numerous factors. The strengths and weaknesses of in-person, mail, and electronic self-administered surveys are reviewed in Table 12.2. Ultimately, you must make the best decision based on its congruence with your sampling approach and what you can feasibly do. Decisions about survey design should be done with a deep appreciation for your study’s target population and how your design choices may impact their responses to your survey.
| In-person | Electronic | ||
| Cost | Depends: it’s easy if your participants congregate in an accessible location; but costly to go door-to-door to collect surveys | Depends: it’s too expensive for unfunded projects but a cost-effective option for funded projects | Strength: it’s free and easy to use online survey tools |
| Time | Depends: it’s easy if your participants congregate in an accessible location; but time-consuming to go door-to-door to collect surveys | Weakness: it can take a while for mail to travel | Strength: delivery is instantaneous |
| Response rate | Strength: it can be harder to ignore someone in person | Weakness: it is easy to ignore junk mail, solicitations | Weakness: it’s easy to ignore junk mail; spam filter may block you |
| Privacy | Weakness: it is very difficult to provide anonymity and people may have to respond in a public place, rather than privately in a safe place | Depends: it cannot provide true anonymity as other household members may see participants’ mail, but people can likely respond privately in a safe place | Strength: can collect data anonymously and respond privately in a safe place |
| Reaching difficult populations | Strength: by going where your participants already gather, you increase your likelihood of getting responses | Depends: it reaches those without internet, but misses those who change addresses often (e.g., college students) | Depends: it misses those who change phone or emails often or don’t use the internet; but reaches online communities |
| Interactivity | Weakness: paper questionnaires are not interactive | Weakness: paper questionnaires are not interactive | Strength: electronic questionnaires can include multimedia elements, interactive questions and response options |
| Data input | Weakness: researcher inputs data manually | Weakness: researcher inputs data manually | Strength: survey software inputs data automatically |

Quantitative interviews: Researcher-administered questionnaires
There are some cases in which it is not feasible to provide a written questionnaire to participants, either on paper or digitally. In this case, the questionnaire can be administered verbally by the researcher to respondents. Rather than the participant reading questions independently on paper or digital screen, the researcher reads questions and answer choices aloud to participants and records their responses for analysis. Another word for this kind of questionnaire is an . It’s called a schedule because each question and answer is posed in the exact same way each time.
Consistency is key in . By presenting each question and answer option in exactly the same manner to each interviewee, the researcher minimizes the potential for the , which encompasses any possible changes in interviewee responses based on how or when the researcher presents question-and-answer options. Additionally, in-person surveys may be video recorded and you can typically take notes without distracting the interviewee due to the closed-ended nature of survey questions, making them helpful for identifying how participants respond to the survey or which questions might be confusing.
Quantitative interviews can take place over the phone or in-person. Phone surveys are often conducted by political polling firms to understand how the electorate feels about certain candidates or policies. In both cases, researchers verbally pose questions to participants. For many years, live-caller polls (a live human being calling participants in a phone survey) were the gold-standard in political polling. Indeed, phone surveys were excellent for drawing representative samples prior to mobile phones. Unlike landlines, cell phone numbers are portable across carriers, associated with individuals as opposed to households, and do not change their first three numbers when people move to a new geographical area. For this reason, many political pollsters have moved away from random-digit phone dialing and toward a mix of data collection strategies like texting-based surveys or online panels to recruit a representative sample and generalizable results for the target population (Silver, 2021).[9]
I guess I should admit that I often decline to participate in phone studies when I am called. In my defense, it’s usually just a customer service survey! My point is that it is easy and even socially acceptable to abruptly hang up on an unwanted caller asking you to participate in a survey, and given the high incidence of spam calls, many people do not pick up the phone for numbers they do not know. We will discuss response rates in greater detail at the end of the chapter. One of the benefits of phone surveys is that a person can complete them in their home or a safe place. At the same time, a distracted participant who is cooking dinner, tending to children, or driving may not provide accurate answers to your questions. Phone surveys make it difficult to control the environment in which a person answers your survey. When administering a phone survey, the researcher can record responses on a paper questionnaire or directly into a computer program. For large projects in which many interviews must be conducted by research staff, computer-assisted telephone interviewing (CATI) ensures that each question and answer option are presented the same way and input into the computer for analysis. For student projects, you can read from a digital or paper copy of your questionnaire and record participants responses into a spreadsheet program like Excel or Google Sheets.
Interview schedules must be administered in such a way that the researcher asks the same question the same way each time. While questions on self-administered questionnaires may create an impression based on the way they are presented, having a researcher pose the questions verbally introduces additional variables that might influence a respondent. Controlling one’s wording, tone of voice, and pacing can be difficult over the phone, but it is even more challenging in-person because the researcher must also control their non-verbal expressions and behaviors that may bias survey respondents. Even a slight shift in emphasis or wording may bias the respondent to answer differently. As we’ve mentioned earlier, consistency is key with quantitative data collection—and human beings are not necessarily known for their consistency. But what happens if a participant asks a question of the researcher? Unlike self-administered questionnaires, quantitative interviews allow the participant to speak directly with the researcher if they need more information about a question. While this can help participants respond accurately, it can also introduce inconsistencies between how the survey administered to each participant. Ideally, the researcher should draft sample responses researchers might provide to participants if they are confused on certain survey items. The strengths and weaknesses of phone and in-person quantitative interviews are summarized in Table 12.3 below.
| In-person | Phone | |
| Cost | Depends: it’s easy if your participants congregate in an accessible location; but costly to go door-to-door to collect surveys | Strength: phone calls are free or low-cost |
| Time | Weakness: quantitative interviews take a long time because each question must be read aloud to each participant | Weakness: quantitative interviews take a long time because each question must be read aloud to each participant |
| Response rate | Strength: it can be harder to ignore someone in person | Weakness: it is easy to ignore unwanted or unexpected calls |
| Privacy | Weakness: it is very difficult to provide anonymity and people will have to respond in a public place, rather than privately in a safe place | Depends: it is difficult for the researcher to control the context in which the participant responds, which might be private or public, safe or unsafe |
| Reaching difficult populations | Strength: by going where your participants already gather, you increase your likelihood of getting responses | Weakness: it is easy to ignore unwanted or unexpected calls |
| Interactivity | Weakness: interview schedules are kept simple because questions are read aloud | Weakness: interview schedules are kept simple because questions are read aloud |
| Data input | Weakness: researcher inputs data manually | Weakness: researcher inputs data manually |
Students using survey design should settle on a delivery method that presents the most favorable tradeoff between strengths and challenges for their unique context. One key consideration is your sampling approach. If you already have the participant on the phone and they agree to be a part of your sample…you may as well ask them your survey questions right then if the participant can do so. These feasibility concerns make in-person quantitative interviews a poor fit for student projects. It is far easier and quicker to distribute paper surveys to a group of people it is to administer the survey verbally to each participant individually. Ultimately, you are the one who has to carry out your research design. Make sure you can actually follow your plan!
Key Takeaways
- Time is a factor in determining what type of survey a researcher administers; cross-sectional surveys are administered at one time, and longitudinal surveys are at multiple points in time.
- Retrospective surveys offer some of the benefits of longitudinal research while only collecting data once but may be less reliable.
- Self-administered questionnaires may be delivered in-person, online, or via mail.
- Interview schedules are used with in-person or phone surveys (a.k.a. quantitative interviews).
- Each way to administer surveys comes with benefits and drawbacks.
Exercises
In this section, we assume that you are using a cross-sectional survey design. But how will you deliver your survey? Recall your sampling approach you developed in Chapter 10. Consider the following questions when evaluating delivery methods for surveys.
- Can you attach your survey to your recruitment emails, calls, or other contacts with potential participants?
- What contact information (e.g., phone number, email address) do you need to deliver your survey?
- Do you need to maintain participant anonymity?
- Is there anything unique about your target population or sampling frame that may impact survey research?
Imagine you are a participant in your survey.
- Beginning with the first contact for recruitment into your study and ending with a completed survey, describe each step of the data collection process from the perspective of a person responding to your survey. You should be able to provide a pretty clear timeline of how your survey will proceed at this point, even if some of the details eventually change
12.3 Writing effective questions and questionnaires
Learning Objectives
Learners will be able to…
- Describe some of the ways that survey questions might confuse respondents and how to word questions and responses clearly
- Create mutually exclusive, exhaustive, and balanced response options
- Define fence-sitting and floating
- Describe the considerations involved in constructing a well-designed questionnaire
- Discuss why pilot testing is important
In the previous section, we reviewed how researchers collect data using surveys. Guided by their sampling approach and research context, researchers should choose the survey approach that provides the most favorable tradeoffs in strengths and challenges. With this information in hand, researchers need to write their questionnaire and revise it before beginning data collection. Each method of delivery requires a questionnaire, but they vary a bit based on how they will be used by the researcher. Since phone surveys are read aloud, researchers will pay more attention to how the questionnaire sounds than how it looks. Online surveys can use advanced tools to require the completion of certain questions, present interactive questions and answers, and otherwise afford greater flexibility in how questionnaires are designed. As you read this section, consider how your method of delivery impacts the type of questionnaire you will design. Because most student projects use paper or online surveys, this section will detail how to construct self-administered questionnaires to minimize the potential for bias and error.

Start with operationalization
The first thing you need to do to write effective survey questions is identify what exactly you wish to know. As silly as it sounds to state what seems so completely obvious, we can’t stress enough how easy it is to forget to include important questions when designing a survey. Begin by looking at your research question and refreshing your memory of the operational definitions you developed for those variables from Chapter 11. You should have a pretty firm grasp of your operational definitions before starting the process of questionnaire design. You may have taken those operational definitions from other researchers’ methods, found established scales and indices for your measures, or created your own questions and answer options.
Exercises
STOP! Make sure you have a complete operational definition for the dependent and independent variables in your research question. A complete operational definition contains the variable being measured, the measure used, and how the researcher interprets the measure. Let’s make sure you have what you need from Chapter 11 to begin writing your questionnaire.
List all of the dependent and independent variables in your research question.
- It’s normal to have one dependent or independent variable. It’s also normal to have more than one of either.
- Make sure that your research question (and this list) contain all of the variables in your hypothesis. Your hypothesis should only include variables from you research question.
For each variable in your list:
- Write out the measure you will use (the specific questions and answers) for each variable.
- If you don’t have questions and answers finalized yet, write a first draft and revise it based on what you read in this section.
- If you are using a measure from another researcher, you should be able to write out all of the questions and answers associated with that measure. If you only have the name of a scale or a few questions, you need to access to the full text and some documentation on how to administer and interpret it before you can finish your questionnaire.
- Describe how you will use each measure draw conclusions about the variable in the operational definition.
- For example, an interpretation might be “there are five 7-point Likert scale questions…point values are added across all five items for each participant…and scores below 10 indicate the participant has low self-esteem”
- Don’t introduce other variables into the mix here. All we are concerned with is how you will measure each variable by itself. The connection between variables is done using statistical tests, not operational definitions.
- Detail any validity or reliability issues uncovered by previous researchers using the same measures. If you have concerns about validity and reliability, note them, as well.
If you completed the exercise above and listed out all of the questions and answer choices you will use to measure the variables in your research question, you have already produced a pretty solid first draft of your questionnaire! Congrats! In essence, questionnaires are all of the self-report measures in your operational definitions for the independent, dependent, and control variables in your study arranged into one document and administered to participants. There are a few questions on a questionnaire (like name or ID#) that are not associated with the measurement of variables. These are the exception, and it’s useful to think of a questionnaire as a list of measures for variables. Of course, researchers often use more than one measure of a variable (i.e., ) so they can more confidently assert that their findings are true. A questionnaire should contain all of the measures researchers plan to collect about their variables by asking participants to self-report. As we will discuss in the final section of this chapter, triangulating across data sources (e.g., measuring variables using client files or student records) can avoid some of the common sources of bias in survey research.
Sticking close to your operational definitions is important because it helps you avoid an everything-but-the-kitchen-sink approach that includes every possible question that occurs to you. Doing so puts an unnecessary burden on your survey respondents. Remember that you have asked your participants to give you their time and attention and to take care in responding to your questions; show them your respect by only asking questions that you actually plan to use in your analysis. For each question in your questionnaire, ask yourself how this question measures a variable in your study. An operational definition should contain the questions, response options, and how the researcher will draw conclusions about the variable based on participants’ responses.
Writing questions
So, almost all of the questions on a questionnaire are measuring some variable. For many variables, researchers will create their own questions rather than using one from another researcher. This section will provide some tips on how to create good questions to accurately measure variables in your study. First, questions should be as clear and to the point as possible. This is not the time to show off your creative writing skills; a survey is a technical instrument and should be written in a way that is as direct and concise as possible. As I’ve mentioned earlier, your survey respondents have agreed to give their time and attention to your survey. The best way to show your appreciation for their time is to not waste it. Ensuring that your questions are clear and concise will go a long way toward showing your respondents the gratitude they deserve. the questionnaire with friends or colleagues can help identify these issues. This process is commonly called pretesting, but to avoid any confusion with pretesting in experimental design, we refer to it as pilot testing.
Related to the point about not wasting respondents’ time, make sure that every question you pose will be relevant to every person you ask to complete it. This means two things: first, that respondents have knowledge about whatever topic you are asking them about, and second, that respondents have experienced the events, behaviors, or feelings you are asking them to report. If you are asking participants for second-hand knowledge—asking clinicians about clients’ feelings, asking teachers about students’ feelings, and so forth—you may want to clarify that the variable you are asking about is the key informant’s perception of what is happening in the target population. A well-planned sampling approach ensures that participants are the most knowledgeable population to complete your survey.
If you decide that you do wish to include questions about matters with which only a portion of respondents will have had experience, make sure you know why you are doing so. For example, if you are asking about MSW student study patterns, and you decide to include a question on studying for the social work licensing exam, you may only have a small subset of participants who have begun studying for the graduate exam or took the bachelor’s-level exam. If you decide to include this question that speaks to a minority of participants’ experiences, think about why you are including it. Are you interested in how studying for class and studying for licensure differ? Are you trying to triangulate study skills measures? Researchers should carefully consider whether questions relevant to only a subset of participants is likely to produce enough valid responses for quantitative analysis.
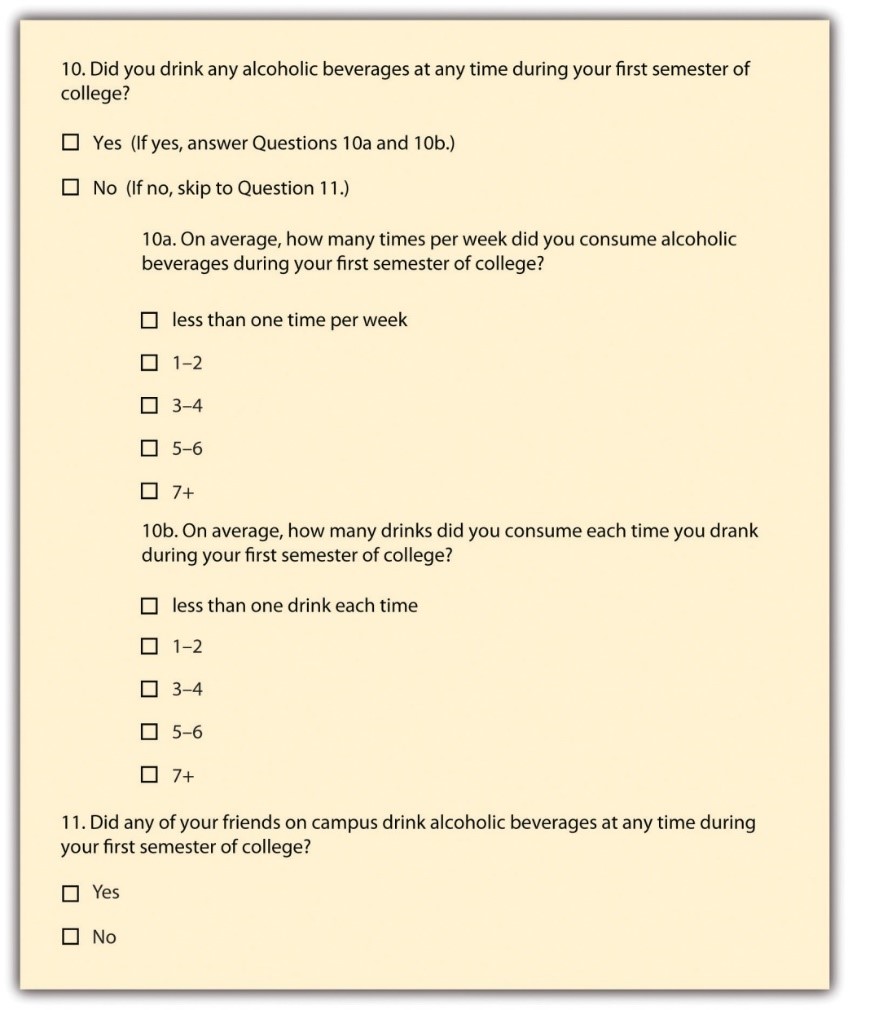
Many times, questions that are relevant to a subsample of participants are conditional on an answer to a previous question. A participant might select that they rent their home, and as a result, you might ask whether they carry renter’s insurance. That question is not relevant to homeowners, so it would be wise not to ask them to respond to it. In that case, the question of whether someone rents or owns their home is a , designed to identify some subset of survey respondents who are asked additional questions that are not relevant to the entire sample. Figure 12.1 presents an example of how to accomplish this on a paper survey by adding instructions to the participant that indicate what question to proceed to next based on their response to the first one. Using online survey tools, researchers can use filter questions to only present relevant questions to participants.
Researchers should eliminate questions that ask about things participants don’t know to minimize confusion. Assuming the question is relevant to the participant, other sources of confusion come from how the question is worded. The use of negative wording can be a source of potential confusion. Taking the question from Figure 12.1 about drinking as our example, what if we had instead asked, “Did you not abstain from drinking during your first semester of college?” This is a double negative, and it’s not clear how to answer the question accurately. It is a good idea to avoid negative phrasing, when possible. For example, “did you not drink alcohol during your first semester of college?” is less clear than “did you drink alcohol your first semester of college?”
You should also avoid using terms or phrases that may be regionally or culturally specific (unless you are absolutely certain all your respondents come from the region or culture whose terms you are using). When I first moved to southwest Virginia, I didn’t know what a holler was. Where I grew up in New Jersey, to holler means to yell. Even then, in New Jersey, we shouted and screamed, but we didn’t holler much. In southwest Virginia, my home at the time, a holler also means a small valley in between the mountains. If I used holler in that way on my survey, people who live near me may understand, but almost everyone else would be totally confused. A similar issue arises when you use jargon, or technical language, that people do not commonly know. For example, if you asked adolescents how they experience imaginary audience, they would find it difficult to link those words to the concepts from David Elkind’s theory. The words you use in your questions must be understandable to your participants. If you find yourself using jargon or slang, break it down into terms that are more universal and easier to understand.
Asking multiple questions as though they are a single question can also confuse survey respondents. There’s a specific term for this sort of question; it is called a . Figure 12.2 shows a double-barreled question. Do you see what makes the question double-barreled? How would someone respond if they felt their college classes were more demanding but also more boring than their high school classes? Or less demanding but more interesting? Because the question combines “demanding” and “interesting,” there is no way to respond yes to one criterion but no to the other.

Another thing to avoid when constructing survey questions is the problem of . We all want to look good, right? And we all probably know the politically correct response to a variety of questions whether we agree with the politically correct response or not. In survey research, social desirability refers to the idea that respondents will try to answer questions in a way that will present them in a favorable light. (You may recall we covered social desirability bias in Chapter 11.)
Perhaps we decide that to understand the transition to college, we need to know whether respondents ever cheated on an exam in high school or college for our research project. We all know that cheating on exams is generally frowned upon (at least I hope we all know this). So, it may be difficult to get people to admit to cheating on a survey. But if you can guarantee respondents’ confidentiality, or even better, their anonymity, chances are much better that they will be honest about having engaged in this socially undesirable behavior. Another way to avoid problems of social desirability is to try to phrase difficult questions in the most benign way possible. Earl Babbie (2010) [10] offers a useful suggestion for helping you do this—simply imagine how you would feel responding to your survey questions. If you would be uncomfortable, chances are others would as well.
Exercises
Try to step outside your role as researcher for a second, and imagine you were one of your participants. Evaluate the following:
- Is the question too general? Sometimes, questions that are too general may not accurately convey respondents’ perceptions. If you asked someone how they liked a certain book and provide a response scale ranging from “not at all” to “extremely well”, and if that person selected “extremely well,” what do they mean? Instead, ask more specific behavioral questions, such as “Will you recommend this book to others?” or “Do you plan to read other books by the same author?”
- Is the question too detailed? Avoid unnecessarily detailed questions that serve no specific research purpose. For instance, do you need the age of each child in a household or is just the number of children in the household acceptable? However, if unsure, it is better to err on the side of details than generality.
- Is the question presumptuous? Does your question make assumptions? For instance, if you ask, “what do you think the benefits of a tax cut would be?” you are presuming that the participant sees the tax cut as beneficial. But many people may not view tax cuts as beneficial. Some might see tax cuts as a precursor to less funding for public schools and fewer public services such as police, ambulance, and fire department. Avoid questions with built-in presumptions.
- Does the question ask the participant to imagine something? Is the question imaginary? A popular question on many television game shows is “if you won a million dollars on this show, how will you plan to spend it?” Most participants have never been faced with this large amount of money and have never thought about this scenario. In fact, most don’t even know that after taxes, the value of the million dollars will be greatly reduced. In addition, some game shows spread the amount over a 20-year period. Without understanding this “imaginary” situation, participants may not have the background information necessary to provide a meaningful response.
Finally, it is important to get feedback on your survey questions from as many people as possible, especially people who are like those in your sample. Now is not the time to be shy. Ask your friends for help, ask your mentors for feedback, ask your family to take a look at your survey as well. The more feedback you can get on your survey questions, the better the chances that you will come up with a set of questions that are understandable to a wide variety of people and, most importantly, to those in your sample.
In sum, in order to pose effective survey questions, researchers should do the following:
- Identify how each question measures an independent, dependent, or control variable in their study.
- Keep questions clear and succinct.
- Make sure respondents have relevant lived experience to provide informed answers to your questions.
- Use filter questions to avoid getting answers from uninformed participants.
- Avoid questions that are likely to confuse respondents—including those that use double negatives, use culturally specific terms or jargon, and pose more than one question at a time.
- Imagine how respondents would feel responding to questions.
- Get feedback, especially from people who resemble those in the researcher’s sample.
Exercises
Let’s complete a first draft of your questions. In the previous exercise, you listed all of the questions and answers you will use to measure the variables in your research question.
- In the previous exercise, you wrote out the questions and answers for each measure of your independent and dependent variables. Evaluate each question using the criteria listed above on effective survey questions.
- Type out questions for your control variables and evaluate them, as well. Consider what response options you want to offer participants.
Now, let’s revise any questions that do not meet your standards!
- Use the BRUSO model in Table 12.2 for an illustration of how to address deficits in question wording. Keep in mind that you are writing a first draft in this exercise, and it will take a few drafts and revisions before your questions are ready to distribute to participants.
| Criterion | Poor | Effective |
| B- Brief | “Are you now or have you ever been the possessor of a firearm?” | Have you ever possessed a firearm? |
| R- Relevant | “Who did you vote for in the last election?” | Note: Only include items that are relevant to your study. |
| U- Unambiguous | “Are you a gun person?” | Do you currently own a gun?” |
| S- Specific | How much have you read about the new gun control measure and sales tax?” | “How much have you read about the new sales tax on firearm purchases?” |
| O- Objective | “How much do you support the beneficial new gun control measure?” | “What is your view of the new gun control measure?” |

Writing response options
While posing clear and understandable questions in your survey is certainly important, so too is providing respondents with unambiguous response options. are the answers that you provide to the people completing your questionnaire. Generally, respondents will be asked to choose a single (or best) response to each question you pose. We call questions in which the researcher provides all of the response options . Keep in mind, closed-ended questions can also instruct respondents to choose multiple response options, rank response options against one another, or assign a percentage to each response option. But be cautious when experimenting with different response options! Accepting multiple responses to a single question may add complexity when it comes to quantitatively analyzing and interpreting your data.
Surveys need not be limited to closed-ended questions. Sometimes survey researchers include open-ended questions in their survey instruments as a way to gather additional details from respondents. An does not include response options; instead, respondents are asked to reply to the question in their own way, using their own words. These questions are generally used to find out more about a survey participant’s experiences or feelings about whatever they are being asked to report in the survey. If, for example, a survey includes closed-ended questions asking respondents to report on their involvement in extracurricular activities during college, an open-ended question could ask respondents why they participated in those activities or what they gained from their participation. While responses to such questions may also be captured using a closed-ended format, allowing participants to share some of their responses in their own words can make the experience of completing the survey more satisfying to respondents and can also reveal new motivations or explanations that had not occurred to the researcher. This is particularly important for mixed-methods research. It is possible to analyze open-ended response options quantitatively using content analysis (i.e., counting how often a theme is represented in a transcript looking for statistical patterns). However, for most researchers, qualitative data analysis will be needed to analyze open-ended questions, and researchers need to think through how they will analyze any open-ended questions as part of their data analysis plan. We will address qualitative data analysis in greater detail in Chapter 19.
To keep things simple, we encourage you to use only closed-ended response options in your study. While open-ended questions are not wrong, they are often a sign in our classrooms that students have not thought through all the way how to operationally define and measure their key variables. Open-ended questions cannot be operationally defined because you don’t know what responses you will get. Instead, you will need to analyze the qualitative data using one of the techniques we discuss in Chapter 19 to interpret your participants’ responses.
To write an effective response options for closed-ended questions, there are a couple of guidelines worth following. First, be sure that your response options are mutually exclusive. Look back at Figure 12.1, which contains questions about how often and how many drinks respondents consumed. Do you notice that there are no overlapping categories in the response options for these questions? This is another one of those points about question construction that seems fairly obvious but that can be easily overlooked. Response options should also be exhaustive. In other words, every possible response should be covered in the set of response options that you provide. For example, note that in question 10a in Figure 12.1, we have covered all possibilities—those who drank, say, an average of once per month can choose the first response option (“less than one time per week”) while those who drank multiple times a day each day of the week can choose the last response option (“7+”). All the possibilities in between these two extremes are covered by the middle three response options, and every respondent fits into one of the response options we provided.
Earlier in this section, we discussed double-barreled questions. Response options can also be double barreled, and this should be avoided. Figure 12.3 is an example of a question that uses double-barreled response options. Other tips about questions are also relevant to response options, including that participants should be knowledgeable enough to select or decline a response option as well as avoiding jargon and cultural idioms.
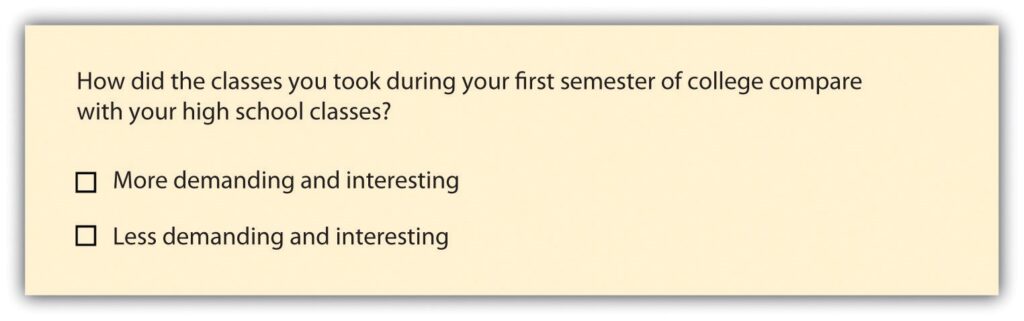
Even if you phrase questions and response options clearly, participants are influenced by how many response options are presented on the questionnaire. For Likert scales, five or seven response options generally allow about as much precision as respondents are capable of. However, numerical scales with more options can sometimes be appropriate. For dimensions such as attractiveness, pain, and likelihood, a 0-to-10 scale will be familiar to many respondents and easy for them to use. Regardless of the number of response options, the most extreme ones should generally be “balanced” around a neutral or modal midpoint. An example of an unbalanced rating scale measuring perceived likelihood might look like this:
Unlikely | Somewhat Likely | Likely | Very Likely | Extremely Likely
Because we have four rankings of likely and only one ranking of unlikely, the scale is unbalanced and most responses will be biased toward “likely” rather than “unlikely.” A balanced version might look like this:
Extremely Unlikely | Somewhat Unlikely | As Likely as Not | Somewhat Likely |Extremely Likely
In this example, the midpoint is halfway between likely and unlikely. Of course, a middle or neutral response option does not have to be included. Researchers sometimes choose to leave it out because they want to encourage respondents to think more deeply about their response and not simply choose the middle option by default. are respondents who choose neutral response options, even if they have an opinion. Some people will be drawn to respond, “no opinion” even if they have an opinion, particularly if their true opinion is the not a socially desirable opinion. , on the other hand, are those that choose a substantive answer to a question when really, they don’t understand the question or don’t have an opinion.
As you can see, floating is the flip side of fence-sitting. Thus, the solution to one problem is often the cause of the other. How you decide which approach to take depends on the goals of your research. Sometimes researchers specifically want to learn something about people who claim to have no opinion. In this case, allowing for fence-sitting would be necessary. Other times researchers feel confident their respondents will all be familiar with every topic in their survey. In this case, perhaps it is okay to force respondents to choose one side or another (e.g., agree or disagree) without a middle option (e.g., neither agree nor disagree) or to not include an option like “don’t know enough to say” or “not applicable.” There is no always-correct solution to either problem. But in general, including middle option in a response set provides a more exhaustive set of response options than one that excludes one.
The most important check before your finalize your response options is to align them with your operational definitions. As we’ve discussed before, your operational definitions include your measures (questions and responses options) as well as how to interpret those measures in terms of the variable being measured. In particular, you should be able to interpret all response options to a question based on your operational definition of the variable it measures. If you wanted to measure the variable “social class,” you might ask one question about a participant’s annual income and another about family size. Your operational definition would need to provide clear instructions on how to interpret response options. Your operational definition is basically like this social class calculator from Pew Research, though they include a few more questions in their definition.
To drill down a bit more, as Pew specifies in the section titled “how the income calculator works,” the interval/ratio data respondents enter is interpreted using a formula combining a participant’s four responses to the questions posed by Pew categorizing their household into three categories—upper, middle, or lower class. So, the operational definition includes the four questions comprising the measure and the formula or interpretation which converts responses into the three final categories that we are familiar with: lower, middle, and upper class.
It is interesting to note that even though participants inis an ordinal level of measurement. Whereas, Pew asks four questions that use an interval or ratio level of measurement (depending on the question). This means that respondents provide numerical responses, rather than choosing categories like lower, middle, and upper class. It’s perfectly normal for operational definitions to change levels of measurement, and it’s also perfectly normal for the level of measurement to stay the same. The important thing is that each response option a participant can provide is accounted for by the operational definition. Throw any combination of family size, location, or income at the Pew calculator, and it will define you into one of those three social class categories.
Unlike Pew’s definition, the operational definitions in your study may not need their own webpage to define and describe. For many questions and answers, interpreting response options is easy. If you were measuring “income” instead of “social class,” you could simply operationalize the term by asking people to list their total household income before taxes are taken out. Higher values indicate higher income, and lower values indicate lower income. Easy. Regardless of whether your operational definitions are simple or more complex, every response option to every question on your survey (with a few exceptions) should be interpretable using an operational definition of a variable. Just like we want to avoid an everything-but-the-kitchen-sink approach to questions on our questionnaire, you want to make sure your final questionnaire only contains response options that you will use in your study.
One note of caution on interpretation (sorry for repeating this). We want to remind you again that an operational definition should not mention more than one variable. In our example above, your operational definition could not say “a family of three making under $50,000 is lower class; therefore, they are more likely to experience food insecurity.” That last clause about food insecurity may well be true, but it’s not a part of the operational definition for social class. Each variable (food insecurity and class) should have its own operational definition. If you are talking about how to interpret the relationship between two variables, you are talking about your . We will discuss how to create your data analysis plan beginning in Chapter 14. For now, one consideration is that depending on the statistical test you use to test relationships between variables, you may need nominal, ordinal, or interval/ratio data. Your questions and response options should match the level of measurement you need with the requirements of the specific statistical tests in your data analysis plan. Once you finalize your data analysis plan, return to your questionnaire to match the level of measurement matches with the statistical test you’ve chosen.
In summary, to write effective response options researchers should do the following:
- Avoid wording that is likely to confuse respondents—including double negatives, use culturally specific terms or jargon, and double-barreled response options.
- Ensure response options are relevant to participants’ knowledge and experience so they can make an informed and accurate choice.
- Present mutually exclusive and exhaustive response options.
- Consider fence-sitters and floaters, and the use of neutral or “not applicable” response options.
- Define how response options are interpreted as part of an operational definition of a variable.
- Check level of measurement matches operational definitions and the statistical tests in the data analysis plan (once you develop one in the future)
Exercises
Look back at the response options you drafted in the previous exercise. Make sure you have a first draft of response options for each closed-ended question on your questionnaire.
- Using the criteria above, evaluate the wording of the response options for each question on your questionnaire.
- Revise your questions and response options until you have a complete first draft.
- Do your first read-through and provide a dummy answer to each question. Make sure you can link each response option and each question to an operational definition.
- Look ahead to Chapter 14 and consider how each item on your questionnaire will inform your data analysis plan.
From this discussion, we hope it is clear why researchers using quantitative methods spell out all of their plans ahead of time. Ultimately, there should be a straight line from operational definition through measures on your questionnaire to the data analysis plan. If your questionnaire includes response options that are not aligned with operational definitions or not included in the data analysis plan, the responses you receive back from participants won’t fit with your conceptualization of the key variables in your study. If you do not fix these errors and proceed with collecting unstructured data, you will lose out on many of the benefits of survey research and face overwhelming challenges in answering your research question.

Designing questionnaires
Based on your work in the previous section, you should have a first draft of the questions and response options for the key variables in your study. Now, you’ll also need to think about how to present your written questions and response options to survey respondents. It’s time to write a final draft of your questionnaire and make it look nice. Designing questionnaires takes some thought. First, consider the route of administration for your survey. What we cover in this section will apply equally to paper and online surveys, but if you are planning to use online survey software, you should watch tutorial videos and explore the features of of the survey software you will use.
Informed consent & instructions
Writing effective items is only one part of constructing a survey. For one thing, every survey should have a written or spoken introduction that serves two basic functions (Peterson, 2000).[11] One is to encourage respondents to participate in the survey. In many types of research, such encouragement is not necessary either because participants do not know they are in a study (as in naturalistic observation) or because they are part of a subject pool and have already shown their willingness to participate by signing up and showing up for the study. Survey research usually catches respondents by surprise when they answer their phone, go to their mailbox, or check their e-mail—and the researcher must make a good case for why they should agree to participate. Thus, the introduction should briefly explain the purpose of the survey and its importance, provide information about the sponsor of the survey (university-based surveys tend to generate higher response rates), acknowledge the importance of the respondent’s participation, and describe any incentives for participating.
The second function of the introduction is to establish . Remember that this involves describing to respondents everything that might affect their decision to participate. This includes the topics covered by the survey, the amount of time it is likely to take, the respondent’s option to withdraw at any time, confidentiality issues, and other ethical considerations we covered in Chapter 6. Written consent forms are not always used in survey research (when the research is of minimal risk and completion of the survey instrument is often accepted by the IRB as evidence of consent to participate), so it is important that this part of the introduction be well documented and presented clearly and in its entirety to every respondent.
Organizing items to be easy and intuitive to follow
The introduction should be followed by the substantive questionnaire items. But first, it is important to present clear instructions for completing the questionnaire, including examples of how to use any unusual response scales. Remember that the introduction is the point at which respondents are usually most interested and least fatigued, so it is good practice to start with the most important items for purposes of the research and proceed to less important items. Items should also be grouped by topic or by type. For example, items using the same rating scale (e.g., a 5-point agreement scale) should be grouped together if possible to make things faster and easier for respondents. Demographic items are often presented last because they are least interesting to participants but also easy to answer in the event respondents have become tired or bored. Of course, any survey should end with an expression of appreciation to the respondent.
Questions are often organized thematically. If our survey were measuring social class, perhaps we’d have a few questions asking about employment, others focused on education, and still others on housing and community resources. Those may be the themes around which we organize our questions. Or perhaps it would make more sense to present any questions we had about parents’ income and then present a series of questions about estimated future income. Grouping by theme is one way to be deliberate about how you present your questions. Keep in mind that you are surveying people, and these people will be trying to follow the logic in your questionnaire. Jumping from topic to topic can give people a bit of whiplash and may make participants less likely to complete it.
Using a matrix is a nice way of streamlining response options for similar questions. A is a question type that that lists a set of questions for which the answer categories are all the same. If you have a set of questions for which the response options are the same, it may make sense to create a matrix rather than posing each question and its response options individually. Not only will this save you some space in your survey but it will also help respondents progress through your survey more easily. A sample matrix can be seen in Figure 12.4.
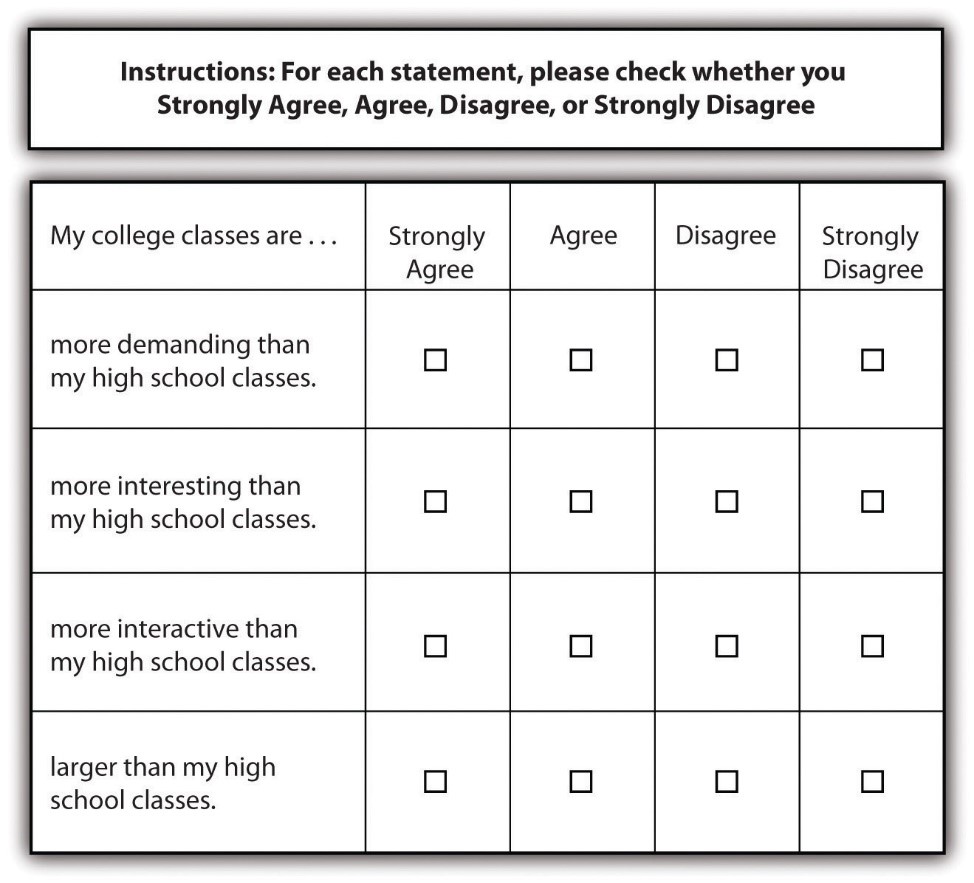
Once you have grouped similar questions together, you’ll need to think about the order in which to present those question groups. Most survey researchers agree that it is best to begin a survey with questions that will want to make respondents continue (Babbie, 2010; Dillman, 2000; Neuman, 2003).[12] In other words, don’t bore respondents, but don’t scare them away either. There’s some disagreement over where on a survey to place demographic questions, such as those about a person’s age, gender, and race. On the one hand, placing them at the beginning of the questionnaire may lead respondents to think the survey is boring, unimportant, and not something they want to bother completing. On the other hand, if your survey deals with some very sensitive topic, such as child sexual abuse or criminal convictions, you don’t want to scare respondents away or shock them by beginning with your most intrusive questions.
Your participants are human. They will react emotionally to questionnaire items, and they will also try to uncover your research questions and hypotheses. In truth, the order in which you present questions on a survey is best determined by the unique characteristics of your research. When feasible, you should consult with key informants from your target population determine how best to order your questions. If it is not feasible to do so, think about the unique characteristics of your topic, your questions, and most importantly, your sample. Keeping in mind the characteristics and needs of the people you will ask to complete your survey should help guide you as you determine the most appropriate order in which to present your questions. None of your decisions will be perfect, and all studies have limitations.
Questionnaire length
You’ll also need to consider the time it will take respondents to complete your questionnaire. Surveys vary in length, from just a page or two to a dozen or more pages, which means they also vary in the time it takes to complete them. How long to make your survey depends on several factors. First, what is it that you wish to know? Wanting to understand how grades vary by gender and year in school certainly requires fewer questions than wanting to know how people’s experiences in college are shaped by demographic characteristics, college attended, housing situation, family background, college major, friendship networks, and extracurricular activities. Keep in mind that even if your research question requires a sizable number of questions be included in your questionnaire, do your best to keep the questionnaire as brief as possible. Any hint that you’ve thrown in a bunch of useless questions just for the sake of it will turn off respondents and may make them not want to complete your survey.
Second, and perhaps more important, how long are respondents likely to be willing to spend completing your questionnaire? If you are studying college students, asking them to use their very free time to complete your survey may mean they won’t want to spend more than a few minutes on it. But if you find ask them to complete your survey during down-time between classes and there is little work to be done, students may be willing to give you a bit more of their time. Think about places and times that your sampling frame naturally gathers and whether you would be able to either recruit participants or distribute a survey in that context. Estimate how long your participants would reasonably have to complete a survey presented to them during this time. The more you know about your population (such as what weeks have less work and more free time), the better you can target questionnaire length.
The time that survey researchers ask respondents to spend on questionnaires varies greatly. Some researchers advise that surveys should not take longer than about 15 minutes to complete (as cited in Babbie 2010),[13] whereas others suggest that up to 20 minutes is acceptable (Hopper, 2010).[14] As with question order, there is no clear-cut, always-correct answer about questionnaire length. The unique characteristics of your study and your sample should be considered to determine how long to make your questionnaire. For example, if you planned to distribute your questionnaire to students in between classes, you will need to make sure it is short enough to complete before the next class begins.
When designing a questionnaire, a researcher should consider:
- Weighing strengths and limitations of the method of delivery, including the advanced tools in online survey software or the simplicity of paper questionnaires.
- Grouping together items that ask about the same thing.
- Moving any questions about sensitive items to the end of the questionnaire, so as not to scare respondents off.
- Moving any questions that engage the respondent to answer the questionnaire at the beginning, so as not to bore them.
- Timing the length of the questionnaire with a reasonable length of time you can ask of your participants.
- Dedicating time to visual design and ensure the questionnaire looks professional.
Exercises
Type out a final draft of your questionnaire in a word processor or online survey tool.
- Evaluate your questionnaire using the guidelines above, revise it, and get it ready to share with other student researchers.

Pilot testing and revising questionnaires
A good way to estimate the time it will take respondents to complete your questionnaire (and other potential challenges) is through . Pilot testing allows you to get feedback on your questionnaire so you can improve it before you actually administer it. It can be quite expensive and time consuming if you wish to pilot test your questionnaire on a large sample of people who very much resemble the sample to whom you will eventually administer the finalized version of your questionnaire. But you can learn a lot and make great improvements to your questionnaire simply by pilot testing with a small number of people to whom you have easy access (perhaps you have a few friends who owe you a favor). By pilot testing your questionnaire, you can find out how understandable your questions are, get feedback on question wording and order, find out whether any of your questions are boring or offensive, and learn whether there are places where you should have included filter questions. You can also time pilot testers as they take your survey. This will give you a good idea about the estimate to provide respondents when you administer your survey and whether you have some wiggle room to add additional items or need to cut a few items.
Perhaps this goes without saying, but your questionnaire should also have an attractive design. A messy presentation style can confuse respondents or, at the very least, annoy them. Be brief, to the point, and as clear as possible. Avoid cramming too much into a single page. Make your font size readable (at least 12 point or larger, depending on the characteristics of your sample), leave a reasonable amount of space between items, and make sure all instructions are exceptionally clear. If you are using an online survey, ensure that participants can complete it via mobile, computer, and tablet devices. Think about books, documents, articles, or web pages that you have read yourself—which were relatively easy to read and easy on the eyes and why? Try to mimic those features in the presentation of your survey questions. While online survey tools automate much of visual design, word processors are designed for writing all kinds of documents and may need more manual adjustment as part of visual design.
Realistically, your questionnaire will continue to evolve as you develop your data analysis plan over the next few chapters. By now, you should have a complete draft of your questionnaire grounded in an underlying logic that ties together each question and response option to a variable in your study. Once your questionnaire is finalized, you will need to submit it for ethical approval from your professor or the IRB. If your study requires IRB approval, it may be worthwhile to submit your proposal before your questionnaire is completely done. Revisions to IRB protocols are common and it takes less time to review a few changes to questions and answers than it does to review the entire study, so give them the whole study as soon as you can. Once the IRB approves your questionnaire, you cannot change it without their okay.
Key Takeaways
- A questionnaire is comprised of self-report measures of variables in a research study.
- Make sure your survey questions will be relevant to all respondents and that you use filter questions when necessary.
- Effective survey questions and responses take careful construction by researchers, as participants may be confused or otherwise influenced by how items are phrased.
- The questionnaire should start with informed consent and instructions, flow logically from one topic to the next, engage but not shock participants, and thank participants at the end.
- Pilot testing can help identify any issues in a questionnaire before distributing it to participants, including language or length issues.
Exercises
It’s a myth that researchers work alone! Get together with a few of your fellow students and swap questionnaires for pilot testing.
- Use the criteria in each section above (questions, response options, questionnaires) and provide your peers with the strengths and weaknesses of their questionnaires.
- See if you can guess their research question and hypothesis based on the questionnaire alone.
12.4 Bias and cultural considerations
Learning Objectives
Learners will be able to…
- Identify the logic behind survey design as it relates to nomothetic causal explanations and quantitative methods.
- Discuss sources of bias and error in surveys.
- Apply criticisms of survey design to ensure more equitable research.
The logic of survey design
As you may have noticed with survey designs, everything about them is intentional—from the delivery method, to question wording, to what response options are offered. It’s helpful to spell out the underlying logic behind survey design and how well it meets the criteria for nomothetic causal explanations. Because we are trying to isolate the causal relationship between our dependent and independent variable, we must try to control for as many possible confounding factors as possible. Researchers using survey design do this in multiple ways:
- Using well-established, valid, and reliable measures of key variables, including triangulating variables using multiple measures
- Measuring control variables and including them in their statistical analysis
- Avoiding biased wording, presentation, or procedures that might influence the sample to respond differently
- Pilot testing questionnaires, preferably with people similar to the sample
In other words, survey researchers go through a lot of trouble to make sure they are not the ones causing the changes they observe in their study. Of course, every study falls a little short of this ideal bias-free design, and some studies fall far short of it. This section is all about how bias and error can inhibit the ability of survey results to meaningfully tell us about causal relationships in the real world.
Bias in questionnaires, questions, and response options
The use of surveys is based on methodological assumptions common to research in the postpositivist paradigm. Figure 12.5 presents a model the methodological assumptions behind survey design—what researchers assume is the cognitive processes that people engage in when responding to a survey item (Sudman, Bradburn, & Schwarz, 1996).[15] Respondents must interpret the question, retrieve relevant information from memory, form a tentative judgment, convert the tentative judgment into one of the response options provided (e.g., a rating on a 1-to-7 scale), and finally edit their response as necessary.
Consider, for example, the following questionnaire item:
- How many alcoholic drinks do you consume in a typical day?
-
- a lot more than average
- somewhat more than average
- average
- somewhat fewer than average
- a lot fewer than average
Although this item at first seems straightforward, it poses several difficulties for respondents. First, they must interpret the question. For example, they must decide whether “alcoholic drinks” include beer and wine (as opposed to just hard liquor) and whether a “typical day” is a typical weekday, typical weekend day, or both. Even though Chang and Krosnick (2003)[16] found that asking about “typical” behavior has been shown to be more valid than asking about “past” behavior, their study compared “typical week” to “past week” and may be different when considering typical weekdays or weekend days).
Once respondents have interpreted the question, they must retrieve relevant information from memory to answer it. But what information should they retrieve, and how should they go about retrieving it? They might think vaguely about some recent occasions on which they drank alcohol, they might carefully try to recall and count the number of alcoholic drinks they consumed last week, or they might retrieve some existing beliefs that they have about themselves (e.g., “I am not much of a drinker”). Then they must use this information to arrive at a tentative judgment about how many alcoholic drinks they consume in a typical day. For example, this mental calculation might mean dividing the number of alcoholic drinks they consumed last week by seven to come up with an average number per day. Then they must format this tentative answer in terms of the response options actually provided. In this case, the options pose additional problems of interpretation. For example, what does “average” mean, and what would count as “somewhat more” than average? Finally, they must decide whether they want to report the response they have come up with or whether they want to edit it in some way. For example, if they believe that they drink a lot more than average, they might not want to report that for fear of looking bad in the eyes of the researcher, so instead, they may opt to select the “somewhat more than average” response option.
At first glance, this question is clearly worded and includes a set of mutually exclusive, exhaustive, and balanced response options. However, it is difficult to follow the logic of what is truly being asked. Again, this complexity can lead to unintended influences on respondents’ answers. Confounds like this are often referred to as because they are not related to the content of the item but to the context in which the item appears (Schwarz & Strack, 1990).[17] For example, there is an when the order in which the items are presented affects people’s responses. One item can change how participants interpret a later item or change the information that they retrieve to respond to later items. For example, researcher Fritz Strack and his colleagues asked college students about both their general life satisfaction and their dating frequency (Strack, Martin, & Schwarz, 1988).[18] When the life satisfaction item came first, the correlation between the two was only −.12, suggesting that the two variables are only weakly related. But when the dating frequency item came first, the correlation between the two was +.66, suggesting that those who date more have a strong tendency to be more satisfied with their lives. Reporting the dating frequency first made that information more accessible in memory so that they were more likely to base their life satisfaction rating on it.
The response options provided can also have unintended effects on people’s responses (Schwarz, 1999).[19] For example, when people are asked how often they are “really irritated” and given response options ranging from “less than once a year” to “more than once a month,” they tend to think of major irritations and report being irritated infrequently. But when they are given response options ranging from “less than once a day” to “several times a month,” they tend to think of minor irritations and report being irritated frequently. People also tend to assume that middle response options represent what is normal or typical. So if they think of themselves as normal or typical, they tend to choose middle response options (i.e., fence-sitting). For example, people are likely to report watching more television when the response options are centered on a middle option of 4 hours than when centered on a middle option of 2 hours. To mitigate against order effects, rotate questions and response items when there is no natural order. Counterbalancing or randomizing the order of presentation of the questions in online surveys are good practices for survey questions and can reduce response order effects that show that among undecided voters, the first candidate listed in a ballot receives a 2.5% boost simply by virtue of being listed first![20]
Other context effects that can confound the causal relationship under examination in a survey include social desirability bias, recall bias, and common method bias. As we discussed in Chapter 11, occurs when we create questions that lead respondents to answer in ways that don’t reflect their genuine thoughts or feelings to avoid being perceived negatively. With negative questions such as, “do you think that your project team is dysfunctional?”, “is there a lot of office politics in your workplace?”, or “have you ever illegally downloaded music files from the Internet?”, the researcher may not get truthful responses. This tendency among respondents to “spin the truth” in order to portray themselves in a socially desirable manner is called social desirability bias, which hurts the validity of responses obtained from survey research. There is practically no way of overcoming social desirability bias in a questionnaire survey outside of wording questions using nonjudgmental language. However, in a quantitative interview, a researcher may be able to spot inconsistent answers and ask probing questions or use personal observations to supplement respondents’ comments.
As you can see, participants’ responses to survey questions often depend on their motivation, memory, and ability to respond. Particularly when dealing with events that happened in the distant past, respondents may not adequately remember their own motivations or behaviors, or perhaps their memory of such events may have evolved with time and are no longer retrievable. This phenomenon is know as . For instance, if a respondent is asked to describe their utilization of computer technology one year ago, their response may not be accurate due to difficulties with recall. One possible way of overcoming the recall bias is by anchoring the respondent’s memory in specific events as they happened, rather than asking them to recall their perceptions and motivations from memory.
Cross-sectional and retrospective surveys are particularly vulnerable to recall bias as well as common method bias. can occur when measuring both independent and dependent variables at the same time (like a cross-section survey) and using the same instrument (like a questionnaire). In such cases, the phenomenon under investigation may not be adequately separated from measurement artifacts. Standard statistical tests are available to test for common method bias, such as Harmon’s single-factor test (Podsakoff et al. 2003),[21], Lindell and Whitney’s (2001)[22] market variable technique, and so forth. This bias can be potentially avoided if the independent and dependent variables are measured at different points in time, using a longitudinal survey design, or if these variables are measured using different data sources, such as medical or student records rather than self-report questionnaires.

Bias in recruitment and response to surveys
So far, we have discussed errors that researchers make when they design questionnaires that accidentally influence participants to respond one way or another. However, even well designed questionnaires can produce biased results when administered to survey respondents because of the biases in who actually responds to your survey.
Survey research is notorious for its low response rates. A response rate of 15-20% is typical in a mail survey, even after two or three reminders. If the majority of the targeted respondents fail to respond to a survey, then a legitimate concern is whether non-respondents are not responding due to a systematic reason, which may raise questions about the validity and generalizability of the study’s results, especially as this relates to the representativeness of the sample. This is known as . For instance, dissatisfied customers tend to be more vocal about their experience than satisfied customers, and are therefore more likely to respond to satisfaction questionnaires. Hence, any respondent sample is likely to have a higher proportion of dissatisfied customers than the underlying population from which it is drawn.[23] In this instance, the results would not be generalizable beyond this one biased sample. Here are several strategies for addressing non-response bias:
- Advance notification: A short letter sent in advance to the targeted respondents soliciting their participation in an upcoming survey can prepare them and improve likelihood of response. The letter should state the purpose and importance of the study, mode of data collection (e.g., via a phone call, a survey form in the mail, etc.), and appreciation for their cooperation. A variation of this technique may request the respondent to return a postage-paid postcard indicating whether or not they are willing to participate in the study.
- Ensuring that content is relevant: If a survey examines issues of relevance or importance to respondents, then they are more likely to respond.
- Creating a respondent-friendly questionnaire: Shorter survey questionnaires tend to elicit higher response rates than longer questionnaires. Furthermore, questions that are clear, inoffensive, and easy to respond to tend to get higher response rates.
- Having the project endorsed: For organizational surveys, it helps to gain endorsement from a senior executive attesting to the importance of the study to the organization. Such endorsements can be in the form of a cover letter or a letter of introduction, which can improve the researcher’s credibility in the eyes of the respondents.
- Providing follow-up requests: Multiple follow-up requests may coax some non-respondents to respond, even if their responses are late.
- Ensuring that interviewers are properly trained: Response rates for interviews can be improved with skilled interviewers trained on how to request interviews, use computerized dialing techniques to identify potential respondents, and schedule callbacks for respondents who could not be reached.
- Providing incentives: Response rates, at least with certain populations, may increase with the use of incentives in the form of cash or gift cards, giveaways such as pens or stress balls, entry into a lottery, draw or contest, discount coupons, the promise of contribution to charity, and so forth.
- Providing non-monetary incentives: Organizations in particular are more prone to respond to non-monetary incentives than financial incentives. An example of such a non-monetary incentive sharing trainings and other resources based on the results of a project with a key stakeholder.
- Making participants fully aware of confidentiality and privacy: Finally, assurances that respondents’ private data or responses will not fall into the hands of any third party may help improve response rates.
Nonresponse bias impairs the ability of the researcher to generalize from the total number of respondents in the sample to the overall sampling frame. Of course, this assumes that the sampling frame is itself representative and generalizable to the larger target population. is present when the people in our sampling frame or the approach we use to sample them results in a sample that does not represent our population in some way. Telephone surveys conducted by calling a random sample of publicly available telephone numbers will systematically exclude people with unlisted telephone numbers, mobile phone numbers, and will include a disproportionate number of respondents who have land-line telephone service and stay home during much of the day, such as people who are unemployed, disabled, or of advanced age. Likewise, online surveys tend to include a disproportionate number of students and younger people who are more digitally connected, and systematically exclude people with limited or no access to computers or the Internet, such as the poor and the elderly. A different kind of sampling bias relates to generalizing from key informants to a target population, such as asking teachers (or parents) about the academic learning of their students (or children) or asking CEOs about operational details in their company. These sampling frames may provide a clearer picture of what key informants think and feel, rather than the target population.

Cultural bias
The acknowledgement that most research in social work and other adjacent fields is overwhelmingly based on so-called WEIRD (Western, educated, industrialized, rich and democratic) populations—a topic we discussed in Chapter 10—has given way to intensified research funding, publication, and visibility of collaborative cross-cultural studies across the social sciences that expand the geographical range of study populations. Many of the so-called non-WEIRD communities who increasingly participate in research are Indigenous, from low- and middle-income countries in the global South, live in post-colonial contexts, and/or are marginalized within their political systems, revealing and reproducing power differentials between researchers and researched (Whiteford & Trotter, 2008).[24] Cross-cultural research has historically been rooted in racist, capitalist ideas and motivations (Gordon, 1991).[25] Scholars have long debated whether research aiming to standardize cross-cultural measurements and analysis is tacitly engaged and/or continues to be rooted in colonial and imperialist practices (Kline et al., 2018; Stearman, 1984).[26] Given this history, it is critical that scientists reflect upon these issues and be accountable to their participants and colleagues for their research practices. We argue that cross-cultural research be grounded in the recognition of the historical, political, sociological and cultural forces acting on the communities and individuals of focus. These perspectives are often contrasted with ‘science’; here we argue that they are necessary as a foundation for the study of human behavior.
We stress that our goal is not to review the literature on colonial or neo-colonial research practices, to provide a comprehensive primer on decolonizing approaches to field research, nor to identify or admonish past harms in these respects—harms to which many of the authors of this piece would readily admit. Furthermore, we acknowledge that we ourselves are writing from a place of privilege as researchers educated and trained in disciplines with colonial pasts. Our goal is simply to help students understand the broader issues in cross-cultural studies for appropriate consideration of diverse communities and culturally appropriate methodologies for student research projects.
Equivalence of measures across cultures
Data collection methods largely stemming from WEIRD intellectual traditions are being exported to a range of cultural contexts. This is often done with insufficient consideration of the translatability (e.g. equivalence or applicability) or implementation of such concepts and methods in different contexts, as already well documented (e.g., Hruschka et al., 2018).[27] For example, in a developmental psychology study conducted by Broesch and colleagues (2011),[28] the research team exported a task to examine the development and variability of self-recognition in children across cultures. Typically, this milestone is measured by surreptitiously placing a mark on a child’s forehead and allowing them to discover their reflective image and the mark in a mirror. While self-recognition in WEIRD contexts typically manifests in children by 18 months of age, the authors tested found that only 2 out of 82 children (aged 1–6 years) ‘passed’ the test by removing the mark using the reflected image. The authors’ interpretation of these results was that the test produced false negatives and instead measured implicit compliance to the local authority figure who placed the mark on the child. This raises the possibility that the mirror test may lack construct validity in cross-cultural contexts—in other words, that it may not measure the theoretical construct it was designed to measure.
As we discussed previously, survey researchers want to make sure everyone receives the same questionnaire, but how can we be sure everyone understands the questionnaire in the same way? means that a measure produces comparable data when employed in different cultural populations (Van de Vijver & Poortinga, 1992).[29] If concepts differ in meaning across cultures, may better explain what is going on with your key variables better than your hypotheses. Cultural bias may result because of poor item translation, inappropriate content of items, and unstandardized procedures (Waltz et al., 2010).[30] Of particular importance is , or “when the construct measured is not identical across cultures or when behaviors that characterize the construct are not identical across cultures” (Meiring et al., 2005, p. 2)[31] Construct bias emerges when there is: a) disagreement about the appropriateness of content, b) inadequate sampling, c) underrepresentation of the construct, and d) incomplete overlap of the construct across cultures (Van de Vijver & Poortinga, 1992).[32]
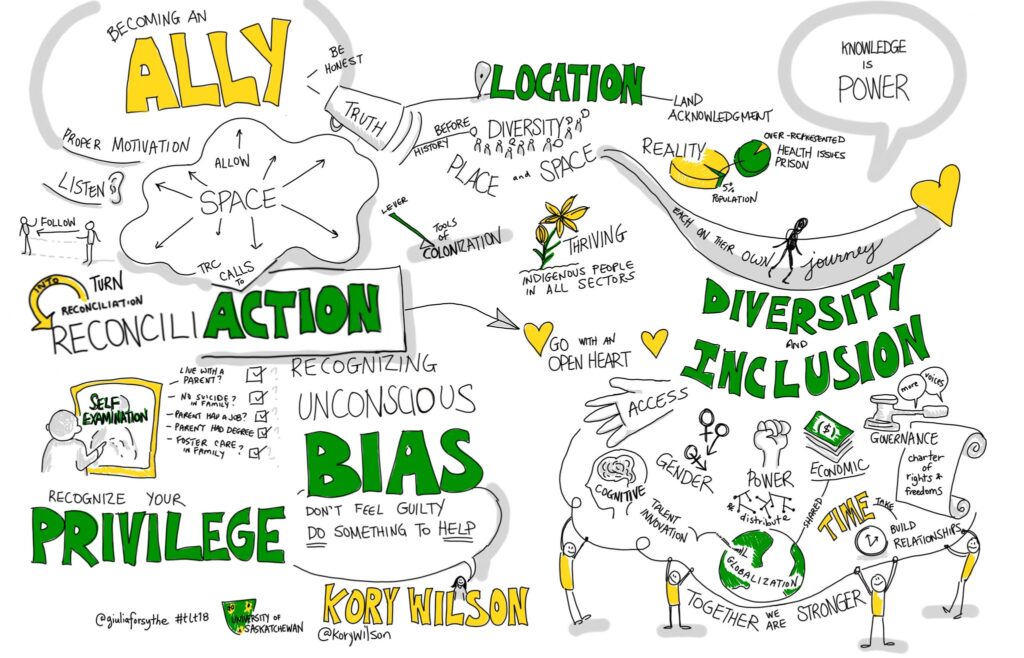
Addressing cultural bias
To address these issues, we propose that careful scrutiny of (a) study site selection, (b) community involvement and (c) culturally appropriate research methods. Particularly for those initiating collaborative cross-cultural projects, we focus here on pragmatic and implementable steps. For student researchers, it is important to be aware of these issues and assess for them in the strengths and limitations of your own study, though the degree to which you can feasibly implement some of these measures will be impaired by a lack of resources.
Study site selection
Researchers are increasingly interested in cross-cultural research applicable outside of WEIRD contexts., but this has sometimes led to an uncritical and haphazard inclusion of ‘non-WEIRD’ populations in cross-cultural research without further regard for why specific populations should be included (Barrett, 2020).[33] One particularly egregious example is the grouping of all non-Western populations as a comparative sample to the cultural West (i.e. the ‘West versus rest’ approach) is often unwittingly adopted by researchers performing cross-cultural research (Henrich, 2010).[34] Other researcher errors include the exoticization of particular cultures or viewing non-Western cultures as a window into the past rather than cultures that have co-evolved over time.
Thus, some of the cultural biases in survey research emerge when researchers fail to identify a clear theoretical justification for inclusion of any subpopulation—WEIRD or not—based on knowledge of the relevant cultural and/or environmental context (see Tucker, 2017[35] for a good example). For example, a researcher asking about satisfaction with daycare must acquire the relevant cultural and environmental knowledge about a daycare that caters exclusively to Orthodox Jewish families. Simply including this study site without doing appropriate background research and identifying a specific aspect of this cultural group that is of theoretical interest in your study (e.g., spirituality and parenthood) indicates a lack of rigor in research. It undercuts the validity and generalizability of your findings by introducing sources of cultural bias that are unexamined in your study.
Sampling decisions are also important as they involve unique ethical and social challenges. For example, foreign researchers (as sources of power, information and resources) represent both opportunities for and threats to community members. These relationships are often complicated by power differentials due to unequal access to wealth, education and historical legacies of colonization. As such, it is important that investigators are alert to the possible bias among individuals who initially interact with researchers, to the potential negative consequences for those excluded, and to the (often unspoken) power dynamics between the researcher and their study participants (as well as among and between study participants).
We suggest that a necessary first step is to carefully consult existing resources outlining best practices for ethical principles of research before engaging in cross-cultural research. Many of these resources have been developed over years of dialogue in various academic and professional societies (e.g. American Anthropological Association, International Association for Cross Cultural Psychology, International Union of Psychological Science). Furthermore, communities themselves are developing and launching research-based codes of ethics and providing carefully curated open-access materials such as those from the Indigenous Peoples’ Health Research Centre, often written in consultation with ethicists in low- to middle-income countries (see Schroeder et al., 2019).[36]
Community involvement
Too often researchers engage in ‘extractive’ research, whereby a researcher selects a study community and collects the necessary data to exclusively further their own scientific and/or professional goals without benefiting the community. This reflects a long history of colonialism in social science. Extractive methods lead to methodological flaws and alienate participants from the scientific process, poisoning the well of scientific knowledge on a macro level. Many researchers are associated with institutions tainted with colonial, racist and sexist histories, sentiments and in some instances perpetuating into the present. Much cross-cultural research is carried out in former or contemporary colonies, and in the colonial language. Explicit and implicit power differentials create ethical challenges that can be acknowledged by researchers and in the design of their study (see Schuller, 2010[37] for an example in which the power and politics of various roles played by researchers).
An understanding of cultural norms may ensure that data collection and questionnaire design are culturally and linguistically relevant. This can be achieved by implementing several complementary strategies. A first step may be to collaborate with members of the study community to check the relevance of the instruments being used. Incorporating perspectives from the study community from the outset can reduce the likelihood of making scientific errors in measurement and inference (First Nations Information Governance Centre, 2014).[38]
An additional approach is to use mixed methods in data collection, such that each method ‘checks’ the data collected using the other methods. A recent paper by Fisher and Poortinga (2018)[39] provides suggestions for a rigorous methodological approach to conducting cross-cultural comparative psychology, underscoring the importance of using multiple methods with an eye towards a convergence of evidence. A mixed-method approach can incorporate a variety of qualitative methods over and on top of a quantitative survey including open-ended questions, focus groups, and interviews.
Research design and methods
It is critical that researchers translate the language, technological references and stimuli as well as examine the underlying cultural context of the original method for assumptions that rely upon WEIRD epistemologies (Hrushcka, 2020).[40] This extends to non-complex visual aids, attempting to ensure that even scales measure what the researcher is intending (see Purzycki and Lang, 2019[41] for discussion on the use of a popular economic experiment in small-scale societies).
For more information on assessing cultural equivalence, consult this free training from RTI International, a well-regarded non-profit research firm, entitled “The essential role of language in survey design” and this free training from the Center for Capacity Building in Survey Methods and Statistics entitled “Questionnaire design: For surveys in 3MC (multinational, multiregional, and multi cultural) contexts. These trainings guide researchers using survey design through the details of evaluating and writing survey questions using culturally sensitive language. Moreover, if you are planning to conduct cross-cultural research, you should consult this guide for assessing measurement equivalency and bias across cultures, as well.
Key Takeaways
- Bias can come from both how questionnaire items are presented to participants as well as how participants are recruited and respond to surveys.
- Cultural bias emerges from the differences in how people think and behave across cultures.
- Cross-cultural research requires a theoretically-informed sampling approach, evaluating measurement equivalency across cultures, and generalizing findings with caution.
Exercises
Review your questionnaire and assess it for potential sources of bias.
- Include the results of pilot testing from the previous exercise.
- Make any changes to your questionnaire (or sampling approach) you think would reduce the potential for bias in your study.
Create a first draft of your limitations section by identifying sources of bias in your survey.
- Write a bulleted list or paragraph or the potential sources of bias in your study.
- Remember that all studies, especially student-led studies, have limitations. To the extent you can address these limitations now and feasibly make changes, do so. But keep in mind that your goal should be more to correctly describe the bias in your study than to collect bias-free results. Ultimately, your study needs to get done!
Media Attributions
- to-do-4483048_1920 © Mohamed Hassan
- assessment-6078645_1280 © Mohamed Hassan
- man-3591573_1920 © Geralt
- polaroid-1277003_1920 © Pete Linforth
- photographer-2032135_1920 © Gerd Altmann
- human-2944065_1920 © Gerd Altmann
- survey-1594962_1920 © Andreas Breitling
- christina-wocintechchat-com-LQ1t-8Ms5PY-unsplash © Christina
- clayton-robbins-7r7-7RLdwCU-unsplash © Clayton Robbins
- celpax-OtV1OXDX94I-unsplash © Celpax
- Figure 12.2 Double-barreled question © Amy Blackstone adapted by Matt DeCarlo is licensed under a CC BY-NC-SA (Attribution NonCommercial ShareAlike) license
- hadija-saidi-jCfDzOQ2-C8-unsplash © Hadija Saidi
- Figure 12.3 Double-barreled response options © Amy Blackstone adapted by Matt DeCarlo is licensed under a CC BY-NC-SA (Attribution NonCommercial ShareAlike) license
- experience-3239623_1920 © Mohamed Hassan
- feedback-4062738_1920 © Mohamed Hassan
- 9.1 © Rajiv S. Jhangiani, I-Chant A. Chiang, Carrie Cuttler, and Dana C. Leighton is licensed under a CC BY-NC-SA (Attribution NonCommercial ShareAlike) license
- email-4009691_1920 © Gerd Altmann
- me-150143_1280 © OpenClipart-Vectors
- 41789870962_5240bba38e_k © Giulia Forsythe is licensed under a CC BY (Attribution) license
- Unless researchers change the order of questions as part of their methodology and ensuring accurate responses to questions ↵
- Not that there are any personal vendettas I'm aware of in academia...everyone gets along great here... ↵
- Blackstone, A. (2013). Harassment of older adults in the workplace. In P. Brownell & J. J. Kelly (eds.) Ageism and mistreatment of older workers. Springer ↵
- Smith, T. W. (2009). Trends in willingness to vote for a Black and woman for president, 1972–2008. GSS Social Change Report No. 55. Chicago, IL: National Opinion Research Center ↵
- Enriquez , L. E., Rosales , W. E., Chavarria, K., Morales Hernandez, M., & Valadez, M. (2021). COVID on Campus: Assessing the Impact of the Pandemic on Undocumented College Students. AERA Open. https://doi.org/10.1177/23328584211033576 ↵
- Mortimer, J. T. (2003). Working and growing up in America. Cambridge, MA: Harvard University Press. ↵
- Lindert, J., Lee, L. O., Weisskopf, M. G., McKee, M., Sehner, S., & Spiro III, A. (2020). Threats to Belonging—Stressful Life Events and Mental Health Symptoms in Aging Men—A Longitudinal Cohort Study. Frontiers in psychiatry, 11, 1148. ↵
- Kleschinsky, J. H., Bosworth, L. B., Nelson, S. E., Walsh, E. K., & Shaffer, H. J. (2009). Persistence pays off: follow-up methods for difficult-to-track longitudinal samples. Journal of studies on alcohol and drugs, 70(5), 751-761. ↵
- Silver, N. (2021, March 25). The death of polling is greatly exaggerated. FiveThirtyEight. Retrieved from: https://fivethirtyeight.com/features/the-death-of-polling-is-greatly-exaggerated/ ↵
- Babbie, E. (2010). The practice of social research (12th ed.). Belmont, CA: Wadsworth. ↵
- Peterson, R. A. (2000). Constructing effective questionnaires. Thousand Oaks, CA: Sage. ↵
- Babbie, E. (2010). The practice of social research (12th ed.). Belmont, CA: Wadsworth; Dillman, D. A. (2000). Mail and Internet surveys: The tailored design method (2nd ed.). New York, NY: Wiley; Neuman, W. L. (2003). Social research methods: Qualitative and quantitative approaches (5th ed.). Boston, MA: Pearson. ↵
- Babbie, E. (2010). The practice of social research (12th ed.). Belmont, CA: Wadsworth. ↵
- Hopper, J. (2010). How long should a survey be? Retrieved from http://www.verstaresearch.com/blog/how-long-should-a-survey-be ↵
- Sudman, S., Bradburn, N. M., & Schwarz, N. (1996). Thinking about answers: The application of cognitive processes to survey methodology. San Francisco, CA: Jossey-Bass. ↵
- Chang, L., & Krosnick, J.A. (2003). Measuring the frequency of regular behaviors: Comparing the ‘typical week’ to the ‘past week’. Sociological Methodology, 33, 55-80. ↵
- Schwarz, N., & Strack, F. (1990). Context effects in attitude surveys: Applying cognitive theory to social research. In W. Stroebe & M. Hewstone (Eds.), European review of social psychology (Vol. 2, pp. 31–50). Chichester, UK: Wiley. ↵
- Strack, F., Martin, L. L., & Schwarz, N. (1988). Priming and communication: The social determinants of information use in judgments of life satisfaction. European Journal of Social Psychology, 18, 429–442. ↵
- Schwarz, N. (1999). Self-reports: How the questions shape the answers. American Psychologist, 54, 93–105. ↵
- Miller, J.M. & Krosnick, J.A. (1998). The impact of candidate name order on election outcomes. Public Opinion Quarterly, 62(3), 291-330. ↵
- Podsakoff, P. M., MacKenzie, S. B., Lee, J. Y., & Podsakoff, N. P. (2003). Common method biases in behavioral research: a critical review of the literature and recommended remedies. Journal of Applied Psychology, 88(5), 879. ↵
- Lindell, M. K., & Whitney, D. J. (2001). Accounting for common method variance in cross-sectional research designs. Journal of Applied Psychology, 86(1), 114. ↵
- This is why my ratemyprofessor.com score is so low. Or that's what I tell myself. ↵
- Whiteford, L. M., & Trotter II, R. T. (2008). Ethics for anthropological research and practice. Waveland Press. ↵
- Gordon, E. T. (1991). Anthropology and liberation. In F V Harrison (ed.) Decolonizing anthropology: Moving further toward an anthropology for liberation (pp. 149-167). Arlington, VA: American Anthropological Association. ↵
- Kline, M. A., Shamsudheen, R., & Broesch, T. (2018). Variation is the universal: Making cultural evolution work in developmental psychology. Philosophical Transactions of the Royal Society B: Biological Sciences, 373(1743), 20170059. Stearman, A. M. (1984). The Yuquí connection: Another look at Sirionó deculturation. American Anthropologist, 86(3), 630-650. ↵
- Hruschka, D. J., Munira, S., Jesmin, K., Hackman, J., & Tiokhin, L. (2018). Learning from failures of protocol in cross-cultural research. Proceedings of the National Academy of Sciences, 115(45), 11428-11434. ↵
- Broesch, T., Callaghan, T., Henrich, J., Murphy, C., & Rochat, P. (2011). Cultural variations in children’s mirror self-recognition. Journal of Cross-Cultural Psychology, 42(6), 1018-1029. ↵
- Van de Vijver, F. J., & Poortinga, Y. H. (1992). Testing in culturally heterogeneous populations: When are cultural loadings undesirable?. European Journal of Psychological Assessment. ↵
- Waltz, C. F., Strickland, O. L., & Lenz, E. R. (Eds.). (2010). Measurement in nursing and health research (4th ed.). Springer. ↵
- Meiring, D., Van de Vijver, A. J. R., Rothmann, S., & Barrick, M. R. (2005). Construct, item and method bias of cognitive and personality tests in South Africa. SA Journal of Industrial Psychology, 31(1), 1-8. ↵
- Van de Vijver, F. J., & Poortinga, Y. H. (1992). Testing in culturally heterogeneous populations: When are cultural loadings undesirable?. European Journal of Psychological Assessment. ↵
- Barrett, H. C. (2020). Deciding what to observe: Thoughts for a post-WEIRD generation. Evolution and Human Behavior, 41(5), 445-453. ↵
- Henrich, J., Heine, S. J., & Norenzayan, A. (2010). Beyond WEIRD: Towards a broad-based behavioral science. Behavioral and Brain Sciences, 33(2-3), 111. ↵
- Tucker, B. (2017). From risk and time preferences to cultural models of causality: on the challenges and possibilities of field experiments, with examples from rural Southwestern Madagascar. Impulsivity, 61-114. ↵
- Schroeder, D., Chatfield, K., Singh, M., Chennells, R., & Herissone-Kelly, P. (2019). Equitable research partnerships: a global code of conduct to counter ethics dumping. Springer Nature. ↵
- Schuller, M. (2010). From activist to applied anthropologist to anthropologist? On the politics of collaboration. Practicing Anthropology, 32(1), 43-47. ↵
- First Nations Information Governance Centre. (2014). Ownership, control, access and possession (OCAP): The path to First Nations information governance. ↵
- Fischer, R., & Poortinga, Y. H. (2018). Addressing methodological challenges in culture-comparative research. Journal of Cross-Cultural Psychology, 49(5), 691-712. ↵
- Hruschka, D. J. (2020). What we look with” is as important as “What we look at. Evolution and Human Behavior, 41(5), 458-459. ↵
- Purzycki, B. G., & Lang, M. (2019). Identity fusion, outgroup relations, and sacrifice: a cross-cultural test. Cognition, 186, 1-6. ↵
The use of questionnaires to gather data from multiple participants.
the group of people you successfully recruit from your sampling frame to participate in your study
A research instrument consisting of a set of questions (items) intended to capture responses from participants in a standardized manner
Refers to research that is designed specifically to answer the question of whether there is a causal relationship between two variables.
A measure of a participant's condition before they receive an intervention or treatment.
A measure of a participant's condition after an intervention or, if they are part of the control/comparison group, at the end of an experiment.
a participant answers questions about themselves
the entities that a researcher actually observes, measures, or collects in the course of trying to learn something about her unit of analysis (individuals, groups, or organizations)
entity that a researcher wants to say something about at the end of her study (individual, group, or organization)
whether you can practically and ethically complete the research project you propose
Someone who is especially knowledgeable about a topic being studied.
a person who completes a survey on behalf of another person
In measurement, conditions that are subtle and complex that we must use existing knowledge and intuition to define.
The ability of a measurement tool to measure a phenomenon the same way, time after time. Note: Reliability does not imply validity.
study publicly available information or data that has been collected by another person
When a researcher collects data only once from participants using a questionnaire
Researcher collects data from participants at multiple points over an extended period of time using a questionnaire.
A type of longitudinal survey where the researchers gather data at multiple times, but each time they ask different people from the group they are studying because their concern is capturing the sentiment of the group, not the individual people they survey.
A questionnaire that is distributed to participants (in person, by mail, virtually) to complete independently.
A questionnaire that is read to respondents
when a researcher administers a questionnaire verbally to participants
any possible changes in interviewee responses based on how or when the researcher presents question-and-answer options
Triangulation of data refers to the use of multiple types, measures or sources of data in a research project to increase the confidence that we have in our findings.
Testing out your research materials in advance on people who are not included as participants in your study.
items on a questionnaire designed to identify some subset of survey respondents who are asked additional questions that are not relevant to the entire sample
a question that asks more than one thing at a time, making it difficult to respond accurately
When a participant answers in a way that they believe is socially the most acceptable answer.
the answers researchers provide to participants to choose from when completing a questionnaire
questions in which the researcher provides all of the response options
Questions for which the researcher does not include response options, allowing for respondents to answer the question in their own words
respondents to a survey who choose neutral response options, even if they have an opinion
respondents to a survey who choose a substantive answer to a question when really, they don’t understand the question or don’t have an opinion
An ordered outline that includes your research question, a description of the data you are going to use to answer it, and the exact analyses, step-by-step, that you plan to run to answer your research question.
A process through which the researcher explains the research process, procedures, risks and benefits to a potential participant, usually through a written document, which the participant than signs, as evidence of their agreement to participate.
a type of survey question that lists a set of questions for which the response options are all the same in a grid layout
unintended influences on respondents’ answers because they are not related to the content of the item but to the context in which the item appears.
when the order in which the items are presented affects people’s responses
Social desirability bias occurs when we create questions that lead respondents to answer in ways that don't reflect their genuine thoughts or feelings to avoid being perceived negatively.
When respondents have difficult providing accurate answers to questions due to the passage of time.
Common method bias refers to the amount of spurious covariance shared between independent and dependent variables that are measured at the same point in time.
If the majority of the targeted respondents fail to respond to a survey, then a legitimate concern is whether non-respondents are not responding due to a systematic reason, which may raise questions about the validity of the study’s results, especially as this relates to the representativeness of the sample.
Sampling bias is present when our sampling process results in a sample that does not represent our population in some way.
the concept that scores obtained from a measure are similar when employed in different cultural populations
spurious covariance between your independent and dependent variables that is in fact caused by systematic error introduced by culturally insensitive or incompetent research practices
"when the construct measured is not identical across cultures or when behaviors that characterize the construct are not identical across cultures" (Meiring et al., 2005, p. 2)
