
Part 2: Conceptualizing your research project
8. Reasoning and causality
Chapter Outline
- Inductive and deductive reasoning (15 minute read)
- Nomothetic causal relationships (17 minute read)
- Idiographic causal relationships (12 minute read)
- Mixed methods research (8 minute read)
Content warning: examples in this chapter include references to sexual harassment, domestic violence, gender-based violence, the child welfare system, substance use disorders, neonatal abstinence syndrome, child abuse, racism, and sexism.
8.1 Inductive and deductive reasoning
Learning Objectives
Learners will be able to…
- Describe inductive and deductive reasoning and provide examples of each
- Identify how inductive and deductive reasoning are complementary
Congratulations! You survived the chapter on theories and paradigms. My experience has been that many students have a difficult time thinking about theories and paradigms because they perceive them as “intangible” and thereby hard to connect to social work research. I even had one student who said she got frustrated just reading the word “philosophy.”
Rest assured, you do not need to become a theorist or philosopher to be an effective social worker or researcher. However, you should have a good sense of what theory or theories will be relevant to your project, as well as how this theory, along with your working question, fit within the three broad research paradigms we reviewed. If you don’t have a good idea about those at this point, it may be a good opportunity to pause and read more about the theories related to your topic area.
Theories structure and inform social work research. The converse is also true: research can structure and inform theory. The reciprocal relationship between theory and research often becomes evident to students when they consider the relationships between theory and research in inductive and deductive approaches to research. In both cases, theory is crucial. But the relationship between theory and research differs for each approach.
While inductive and deductive approaches to research are quite different, they can also be complementary. Let’s start by looking at each one and how they differ from one another. Then we’ll move on to thinking about how they complement one another.
Inductive reasoning
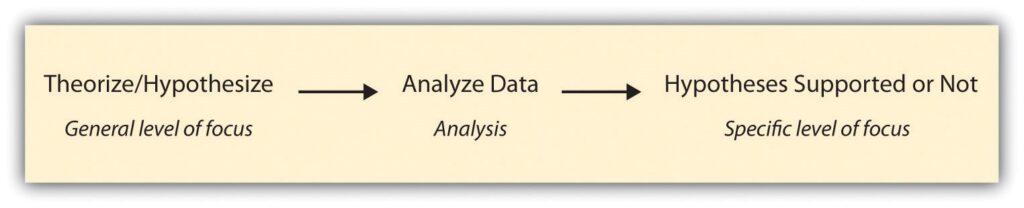
A researcher using begins by collecting data that is relevant to their topic of interest. Once a substantial amount of data have been collected, the researcher will then step back from data collection to get a bird’s eye view of their data. At this stage, the researcher looks for patterns in the data, working to develop a theory that could explain those patterns. Thus, when researchers take an inductive approach, they start with a particular set of observations and move to a more general set of propositions about those experiences. In other words, they move from data to theory, or from the specific to the general. Figure 8.1 outlines the steps involved with an inductive approach to research.

There are many good examples of inductive research, but we’ll look at just a few here. One fascinating study in which the researchers took an inductive approach is Katherine Allen, Christine Kaestle, and Abbie Goldberg’s (2011)[1] study of how boys and young men learn about menstruation. To understand this process, Allen and her colleagues analyzed the written narratives of 23 young cisgender men in which the men described how they learned about menstruation, what they thought of it when they first learned about it, and what they think of it now. By looking for patterns across all 23 cisgender men’s narratives, the researchers were able to develop a general theory of how boys and young men learn about this aspect of girls’ and women’s biology. They conclude that sisters play an important role in boys’ early understanding of menstruation, that menstruation makes boys feel somewhat separated from girls, and that as they enter young adulthood and form romantic relationships, young men develop more mature attitudes about menstruation. Note how this study began with the data—men’s narratives of learning about menstruation—and worked to develop a theory.
In another inductive study, Kristin Ferguson and colleagues (Ferguson, Kim, & McCoy, 2011)[2] analyzed empirical data to better understand how to meet the needs of young people who are homeless. The authors analyzed focus group data from 20 youth at a homeless shelter. From these data they developed a set of recommendations for those interested in applied interventions that serve homeless youth. The researchers also developed hypotheses for others who might wish to conduct further investigation of the topic. Though Ferguson and her colleagues did not test their hypotheses, their study ends where most deductive investigations begin: with a theory and a hypothesis derived from that theory. Section 8.4 discusses the use of mixed methods research as a way for researchers to test hypotheses created in a previous component of the same research project.
You will notice from both of these examples that inductive reasoning is most commonly found in studies using qualitative methods, such as focus groups and interviews. Because inductive reasoning involves the creation of a new theory, researchers need very nuanced data on how the key concepts in their working question operate in the real world. Qualitative data is often drawn from lengthy interactions and observations with the individuals and phenomena under examination. For this reason, inductive reasoning is most often associated with qualitative methods, though it is used in both quantitative and qualitative research.
Deductive reasoning
If inductive reasoning is about creating theories from raw data, is about testing theories using data. Researchers using deductive reasoning take the steps described earlier for inductive research and reverse their order. They start with a compelling social theory, create a about how the world should work, collect raw data, and analyze whether their hypothesis was confirmed or not. That is, deductive approaches move from a more general level (theory) to a more specific (data); whereas inductive approaches move from the specific (data) to general (theory).
A deductive approach to research is the one that people typically associate with scientific investigation. Students in English-dominant countries that may be confused by inductive vs. deductive research can rest part of the blame on Sir Arthur Conan Doyle, creator of the Sherlock Holmes character. As Craig Vasey points out in his breezy introduction to logic book chapter, Sherlock Holmes more often used inductive rather than deductive reasoning (despite claiming to use the powers of deduction to solve crimes). By noticing subtle details in how people act, behave, and dress, Holmes finds patterns that others miss. Using those patterns, he creates a theory of how the crime occurred, dramatically revealed to the authorities just in time to arrest the suspect. Indeed, it is these flashes of insight into the patterns of data that make Holmes such a keen inductive reasoner. In social work practice, rather than detective work, inductive reasoning is supported by the intuitions and practice wisdom of social workers, just as Holmes’ reasoning is sharpened by his experience as a detective.
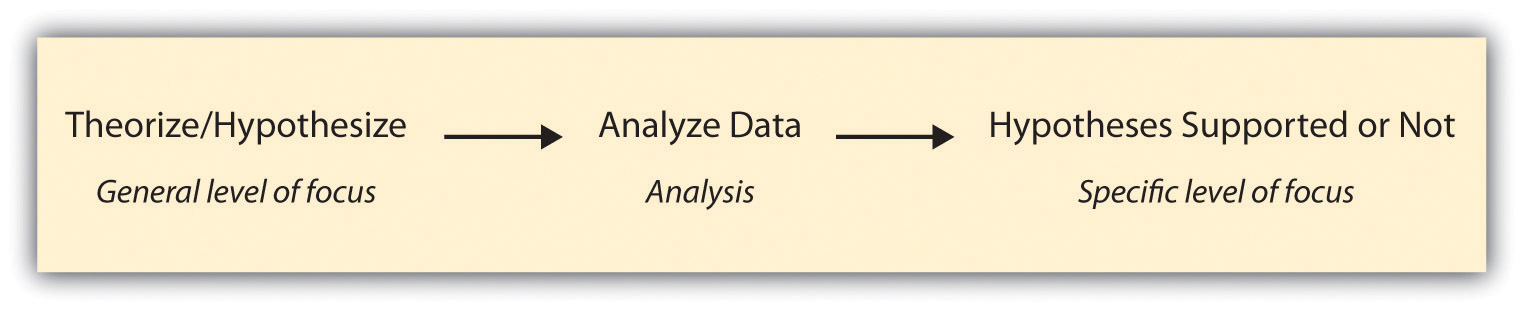
So, if deductive reasoning isn’t Sherlock Holmes’ observation and pattern-finding, how does it work? It starts with what you have already done in Chapters 3 and 4, reading and evaluating what others have done to study your topic. It continued with Chapter 5, discovering what theories already try to explain how the concepts in your working question operate in the real world. Tapping into this foundation of knowledge on their topic, the researcher studies what others have done, reads existing theories of whatever phenomenon they are studying, and then tests hypotheses that emerge from those theories. Figure 8.2 outlines the steps involved with a deductive approach to research.
While not all researchers follow a deductive approach, many do. We’ll now take a look at a couple excellentrecent examples of deductive research.
In a study of US law enforcement responses to hate crimes, Ryan King and colleagues (King, Messner, & Baller, 2009)[3] hypothesized that law enforcement’s response would be less vigorous in areas of the country that had a stronger history of racial violence. The authors developed their hypothesis from prior research and theories on the topic. They tested the hypothesis by analyzing data on states’ lynching histories and hate crime responses. Overall, the authors found support for their hypothesis and illustrated an important application of critical race theory.
In another recent deductive study, Melissa Milkie and Catharine Warner (2011)[4] studied the effects of different classroom environments on first graders’ mental health. Based on prior research and theory, Milkie and Warner hypothesized that negative classroom features, such as a lack of basic supplies and heat, would be associated with emotional and behavioral problems in children. One might associate this research with Maslow’s hierarchy of needs or systems theory. The researchers found support for their hypothesis, demonstrating that policymakers should be paying more attention to the mental health outcomes of children’s school experiences, just as they track academic outcomes (American Sociological Association, 2011).[5]
Complementary approaches
While inductive and deductive approaches to research seem quite different, they can actually be rather complementary. In some cases, researchers will plan for their study to include multiple components, one inductive and the other deductive. In other cases, a researcher might begin a study with the plan to conduct either inductive or deductive research, but then discovers along the way that the other approach is needed to help illuminate findings. Here is an example of each such case.
Dr. Amy Blackstone (n.d.), author of Principles of sociological inquiry: Qualitative and quantitative methods, relates a story about her on sexual harassment.
We began the study knowing that we would like to take both a deductive and an inductive approach in our work. We therefore administered a quantitative survey, the responses to which we could analyze in order to test hypotheses, and also conducted qualitative interviews with a number of the survey participants. The survey data were well suited to a deductive approach; we could analyze those data to test hypotheses that were generated based on theories of harassment. The interview data were well suited to an inductive approach; we looked for patterns across the interviews and then tried to make sense of those patterns by theorizing about them.
For one paper (Uggen & Blackstone, 2004)[6], we began with a prominent feminist theory of the sexual harassment of adult women and developed a set of hypotheses outlining how we expected the theory to apply in the case of younger women’s and men’s harassment experiences. We then tested our hypotheses by analyzing the survey data. In general, we found support for the theory that posited that the current gender system, in which heteronormative men wield the most power in the workplace, explained workplace sexual harassment—not just of adult women but of younger women and men as well. In a more recent paper (Blackstone, Houle, & Uggen, 2006),[7] we did not hypothesize about what we might find but instead inductively analyzed interview data, looking for patterns that might tell us something about how or whether workers’ perceptions of harassment change as they age and gain workplace experience. From this analysis, we determined that workers’ perceptions of harassment did indeed shift as they gained experience and that their later definitions of harassment were more stringent than those they held during adolescence. Overall, our desire to understand young workers’ harassment experiences fully—in terms of their objective workplace experiences, their perceptions of those experiences, and their stories of their experiences—led us to adopt both deductive and inductive approaches in the work. (Blackstone, n.d., p. 21)[8]
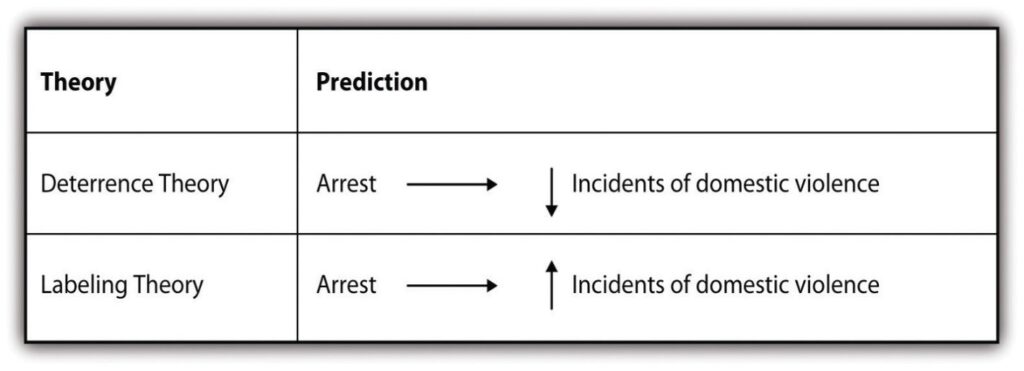
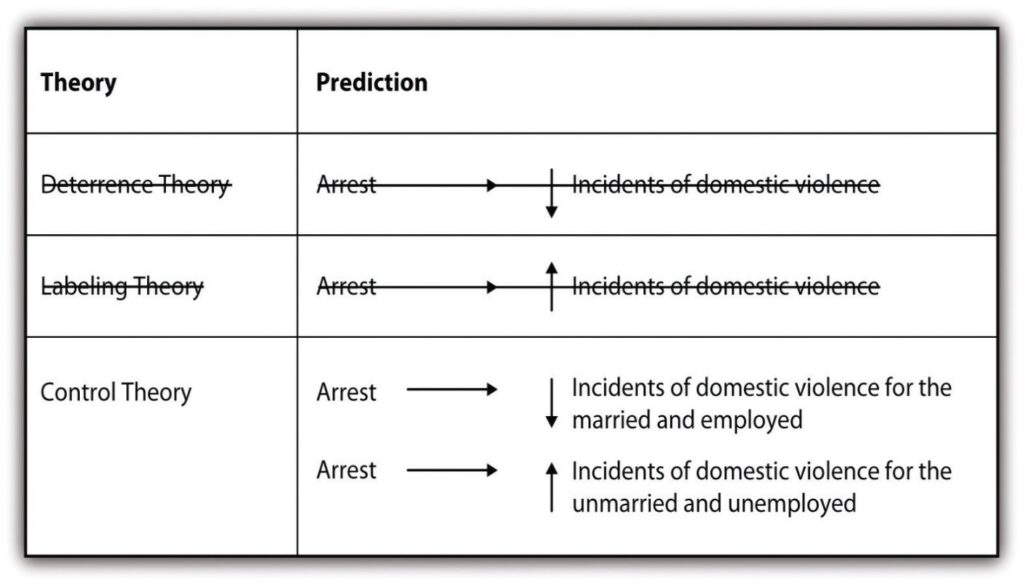
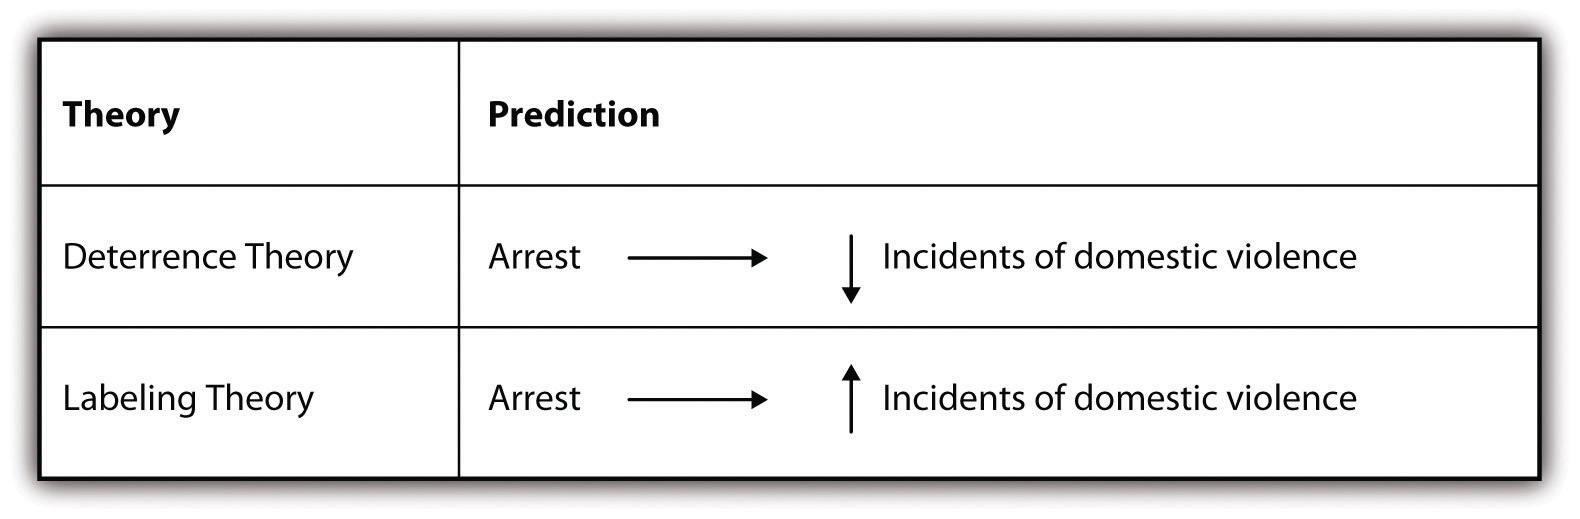
Researchers may not always set out to employ both approaches in their work but sometimes find that their use of one approach leads them to the other. One such example is described eloquently in Russell Schutt’s Investigating the Social World (2006).[9] As Schutt describes, researchers Sherman and Berk (1984)[10] conducted an experiment to test two competing theories of the effects of punishment on deterring deviance (in this case, domestic violence).Specifically, Sherman and Berk hypothesized that deterrence theory (see Williams, 2005[11] for more information on that theory) would provide a better explanation of the effects of arresting accused batterers than labeling theory. Deterrence theory predicts that arresting an accused spouse batterer will reduce future incidents of violence. Conversely, labeling theory predicts that arresting accused spouse batterers will increase future incidents (see Policastro & Payne, 2013[12] for more information on that theory). Figure 8.3 summarizes the two competing theories and the hypotheses Sherman and Berk set out to test.
Research from these follow-up studies were mixed. In some cases, arrest deterred future incidents of violence. In other cases, it did not. This left the researchers with new data that they needed to explain. The researchers therefore took an inductive approach in an effort to make sense of their latest empirical observations. The new studies revealed that arrest seemed to have a deterrent effect for those who were married and employed, but that it led to increased offenses for those who were unmarried and unemployed. Researchers thus turned to control theory, which posits that having some stake in conformity through the social ties provided by marriage and employment, as the better explanation (see Davis et al., 2000[14] for more information on this theory).
What the original Sherman and Berk study, along with the follow-up studies, show us is that we might start with a deductive approach to research, but then, if confronted by new data we must make sense of, we may move to an inductive approach. We will expand on these possibilities in section 8.4 when we discuss mixed methods research.
Ethical and critical considerations
Deductive and inductive reasoning, just like other components of the research process comes with ethical and cultural considerations for researchers. Specifically, deductive research is limited by existing theory. Because scientific inquiry has been shaped by oppressive forces such as sexism, racism, and colonialism, what is considered theory is largely based in Western, white-male-dominant culture. Thus, researchers doing deductive research may artificially limit themselves to ideas that were derived from this context. Non-Western researchers, international social workers, and practitioners working with non-dominant groups may find deductive reasoning of limited help if theories do not adequately describe other cultures.
While these flaws in deductive research may make inductive reasoning seem more appealing, on closer inspection you’ll find similar issues apply. A researcher using inductive reasoning applies their intuition and lived experience when analyzing participant data. They will take note of particular themes, conceptualize their definition, and frame the project using their unique psychology. Since everyone’s internal world is shaped by their cultural and environmental context, inductive reasoning conducted by Western researchers may unintentionally reinforcing lines of inquiry that derive from cultural oppression.
Inductive reasoning is also shaped by those invited to provide the data to be analyzed. For example, I recently worked with a student who wanted to understand the impact of child welfare supervision on children born dependent on opiates and methamphetamine. Due to the potential harm that could come from interviewing families and children who are in foster care or under child welfare supervision, the researcher decided to use inductive reasoning and to only interview child welfare workers.
Talking to practitioners is a good idea for feasibility, as they are less vulnerable than clients. However, any theory that emerges out of these observations will be substantially limited, as it would be devoid of the perspectives of parents, children, and other community members who could provide a more comprehensive picture of the impact of child welfare involvement on children. Notice that each of these groups has less power than child welfare workers in the service relationship. Attending to which groups were used to inform the creation of a theory and the power of those groups is an important critical consideration for social work researchers.
As you can see, when researchers apply theory to research they must wrestle with the history and hierarchy around knowledge creation in that area. In deductive studies, the researcher is positioned as the expert, similar to the positivist paradigm presented in Chapter 5. We’ve discussed a few of the limitations on the knowledge of researchers in this subsection, but the position of the “researcher as expert” is inherently problematic. However, it should also not be taken to an extreme. A researcher who approaches inductive inquiry as a naïve learner is also inherently problematic. Just as competence in social work practice requires a baseline of knowledge prior to entering practice, so does competence in social work research. Because a truly naïve intellectual position is impossible—we all have preexisting ways we view the world and are not fully aware of how they may impact our thoughts—researchers should be well-read in the topic area of their research study but humble enough to know that there is always much more to learn.
Key Takeaways
- Inductive reasoning begins with a set of empirical observations, seeking patterns in those observations, and then theorizing about those patterns.
- Deductive reasoning begins with a theory, developing hypotheses from that theory, and then collecting and analyzing data to test the truth of those hypotheses.
- Inductive and deductive reasoning can be employed together for a more complete understanding of the research topic.
- Though researchers don’t always set out to use both inductive and deductive reasoning in their work, they sometimes find that new questions arise in the course of an investigation that can best be answered by employing both approaches.
Exercises
- Identify one theory and how it helps you understand your topic and working question.
I encourage you to find a specific theory from your topic area, rather than relying only on the broad theoretical perspectives like systems theory or the strengths perspective. Those broad theoretical perspectives are okay…but I promise that searching for theories about your topic will help you conceptualize and design your research project.
- Using the theory you identified, describe what you expect the answer to be to your working question.
8.2 Nomothetic causal explanations
Learning Objectives
Learners will be able to…
- Define and provide an example of idiographic causal relationships
- Describe the role of causality in quantitative research as compared to qualitative research
- Identify, define, and describe each of the main criteria for nomothetic causal relationships
- Describe the difference between and provide examples of independent, dependent, and control variables
- Define hypothesis, state a clear hypothesis, and discuss the respective roles of quantitative and qualitative research when it comes to hypotheses
refers to the idea that one event, behavior, or belief will result in the occurrence of another, subsequent event, behavior, or belief. In other words, it is about cause and effect. It seems simple, but you may be surprised to learn there is more than one way to explain how one thing causes another. How can that be? How could there be many ways to understand causality?
Think back to our discussion in Section 5.3 on paradigms [insert chapter link plus link to section 1.2]. You’ll remember the positivist paradigm as the one that believes in objectivity. Positivists look for causal explanations that are universally true for everyone, everywhere because they seek objective truth. Interpretivists, on the other hand, look for causal explanations that are true for individuals or groups in a specific time and place because they seek subjective truths. Remember that for interpretivists, there is not one singular truth that is true for everyone, but many truths created and shared by others.
“Are you trying to generalize or nah?”
One of my favorite classroom moments occurred in the early days of my teaching career. Students were providing peer feedback on their working questions. I overheard one group who was helping someone rephrase their research question. A student asked, “Are you trying to generalize or nah?” Teaching is full of fun moments like that one. Answering that one question can help you understand how to conceptualize and design your research project.
are incredibly powerful. They allow scientists to make predictions about what will happen in the future, with a certain margin of error. Moreover, they allow scientists to —that is, make claims about a large population based on a smaller sample of people or items. Generalizing is important. We clearly do not have time to ask everyone their opinion on a topic or test a new intervention on every person. We need a type of causal explanation that helps us predict and estimate truth in all situations.
Generally, nomothetic causal relationships work best for explanatory research projects [INSERT SECTION LINK]. They also tend to use quantitative research: by boiling things down to numbers, one can use the universal language of mathematics to use statistics to explore those relationships. On the other hand, descriptive and exploratory projects often fit better with idiographic causality. These projects do not usually try to generalize, but instead investigate what is true for individuals, small groups, or communities at a specific point in time. You will learn about this type of causality in the next section. Here, we will assume you have an explanatory working question. For example, you may want to know about the risk and protective factors for a specific diagnosis or how a specific therapy impacts client outcomes.
What do nomothetic causal explanations look like?
Nomothetic causal explanations express relationships between . The term variable has a scientific definition. This one from Gillespie & Wagner (2018) “a logical grouping of attributes that can be observed and measured and is expected to vary from person to person in a population” (p. 9).[15] More practically, variables are the key concepts in your working question. You know, the things you plan to observe when you actually do your research project, conduct your surveys, complete your interviews, etc. These things have two key properties. First, they vary, as in they do not remain constant. “Age” varies by number. “Gender” varies by category. But they both vary. Second, they have attributes. So the variable “health professions” has attributes or categories, such as social worker, nurse, counselor, etc.
It’s also worth reviewing what is not a variable. Well, things that don’t change (or vary) aren’t variables. If you planned to do a study on how gender impacts earnings but your study only contained women, that concept would not vary. Instead, it would be a constant. Another common mistake I see in students’ explanatory questions is mistaking an attribute for a variable. “Men” is not a variable. “Gender” is a variable. “Virginia” is not a variable. The variable is the “state or territory” in which someone or something is physically located.
When one variable causes another, we have what researchers call independent and dependent variables. For example, in a study investigating the impact of spanking on aggressive behavior, spanking would be the independent variable and aggressive behavior would be the dependent variable. An is the cause, and a is the effect. Why are they called that? Dependent variables depend on independent variables. If all of that gets confusing, just remember the graphical relationship in Figure 8.5.

Exercises
Write out your working question, as it exists now. As we said previously in the subsection, we assume you have an explanatory research question for learning this section.
- Write out a diagram similar to Figure 8.5.
- Put your independent variable on the left and the dependent variable on the right.
Check:
- Can your variables vary?
- Do they have different attributes or categories that vary from person to person?
- How does the theory you identified in section 8.1 help you understand this causal relationship?
If the theory you’ve identified isn’t much help to you or seems unrelated, it’s a good indication that you need to read more literature about the theories related to your topic.
For some students, your working question may not be specific enough to list an independent or dependent variable clearly. You may have “risk factors” in place of an independent variable, for example. Or “effects” as a dependent variable. If that applies to your research question, get specific for a minute even if you have to revise this later. Think about which specific risk factors or effects you are interested in. Consider a few options for your independent and dependent variable and create diagrams similar to Figure 8.5.
Finally, you are likely to revisit your working question so you may have to come back to this exercise to clarify the causal relationship you want to investigate.
For a ten-cent word like “nomothetic,” these causal relationships should look pretty basic to you. They should look like “x causes y.” Indeed, you may be looking at your causal explanation and thinking, “wow, there are so many other things I’m missing in here.” In fact, maybe my dependent variable sometimes causes changes in my independent variable! For example, a working question asking about poverty and education might ask how poverty makes it more difficult to graduate college or how high college debt impacts income inequality after graduation. Nomothetic causal relationships are slices of reality. They boil things down to two (or often more) key variables and assert a one-way causal explanation between them. This is by design, as they are trying to generalize across all people to all situations. The more complicated, circular, and often contradictory causal explanations are idiographic, which we will cover in the next section of this chapter.
Developing a hypothesis
A is a statement describing a researcher’s expectation regarding what they anticipate finding. Hypotheses in quantitative research are a nomothetic causal relationship that the researcher expects to determine is true or false. A hypothesis is written to describe the expected relationship between the independent and dependent variables. In other words, write the answer to your working question using your variables. That’s your hypothesis! Make sure you haven’t introduced new variables into your hypothesis that are not in your research question. If you have, write out your hypothesis as in Figure 8.5.
A good hypothesis should be testable using social science research methods. That is, you can use a social science research project (like a survey or experiment) to test whether it is true or not. A good hypothesis is also specific about the relationship it explores. For example, a student project that hypothesizes, “families involved with child welfare agencies will benefit from Early Intervention programs,” is not specific about what benefits it plans to investigate. For this student, I advised her to take a look at the empirical literature and theory about Early Intervention and see what outcomes are associated with these programs. This way, she could more clearly state the dependent variable in her hypothesis, perhaps looking at reunification, attachment, or developmental milestone achievement in children and families under child welfare supervision.
Your hypothesis should be an informed prediction based on a theory or model of the social world. For example, you may hypothesize that treating mental health clients with warmth and positive regard is likely to help them achieve their therapeutic goals. That hypothesis would be based on the humanistic practice models of Carl Rogers. Using previous theories to generate hypotheses is an example of deductive research. If Rogers’ theory of unconditional positive regard is accurate, a study comparing clinicians who used it versus those who did not would show more favorable treatment outcomes for clients receiving unconditional positive regard.
Let’s consider a couple of examples. In research on sexual harassment (Uggen & Blackstone, 2004),[16] one might hypothesize, based on feminist theories of sexual harassment, that more females than males will experience specific sexually harassing behaviors. What is the causal relationship being predicted here? Which is the independent and which is the dependent variable? In this case, researchers hypothesized that a person’s sex (independent variable) would predict their likelihood to experience sexual harassment (dependent variable).

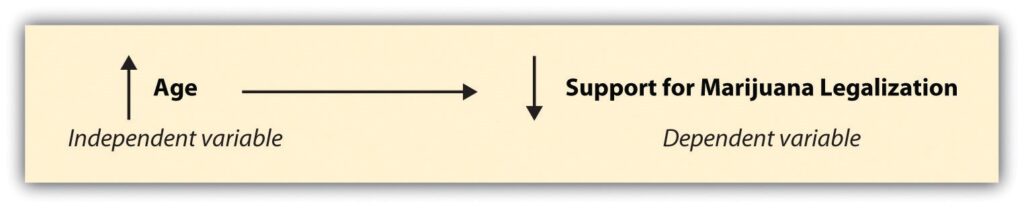
Sometimes researchers will hypothesize that a relationship will take a specific direction. As a result, an increase or decrease in one area might be said to cause an increase or decrease in another. For example, you might choose to study the relationship between age and support for legalization of marijuana. Perhaps you’ve taken a sociology class and, based on the theories you’ve read, you hypothesize that age is negatively related to support for marijuana legalization.[17] What have you just hypothesized?
You have hypothesized that as people get older, the likelihood of their supporting marijuana legalization decreases. Thus, as age (your independent variable) moves in one direction (up), support for marijuana legalization (your dependent variable) moves in another direction (down). So, a (or positive correlation) involve two variables going in the same direction and an (or negative correlation) involve two variables going in opposite directions. If writing hypotheses feels tricky, it is sometimes helpful to draw them out and depict each of the two hypotheses we have just discussed.
It’s important to note that once a study starts, it is unethical to change your hypothesis to match the data you find. For example, what happens if you conduct a study to test the hypothesis from Figure 8.7 on support for marijuana legalization, but you find no relationship between age and support for legalization? It means that your hypothesis was incorrect, but that’s still valuable information. It would challenge what the existing literature says on your topic, demonstrating that more research needs to be done to figure out the factors that impact support for marijuana legalization. Don’t be embarrassed by negative results, and definitely don’t change your hypothesis to make it appear correct all along!
Criteria for establishing a nomothetic causal relationship
Let’s say you conduct your study and you find evidence that supports your hypothesis, as age increases, support for marijuana legalization decreases. Success! Causal explanation complete, right? Not quite.
You’ve only established one of the criteria for causality. The criteria for causality must include all of the following: covariation, plausibility, temporality, and nonspuriousness. In our example from Figure 8.7, we have established only one criteria—covariation. When variables , they vary together. Both age and support for marijuana legalization vary in our study. Our sample contains people of varying ages and varying levels of support for marijuana legalization. If, for example, we only included 16-year-olds in our study, age would be a constant, not a variable.
Just because there might be some correlation between two variables does not mean that a causal relationship between the two is really plausible. means that in order to make the claim that one event, behavior, or belief causes another, the claim has to make sense. It makes sense that people from previous generations would have different attitudes towards marijuana than younger generations. People who grew up in the time of Reefer Madness or the hippies may hold different views than those raised in an era of legalized medicinal and recreational use of marijuana. Plausibility is of course helped by basing your causal explanation in existing theoretical and empirical findings.
Once we’ve established that there is a plausible relationship between the two variables, we also need to establish whether the cause occurred before the effect, the criterion of . A person’s age is a quality that appears long before any opinions on drug policy, so temporally the cause comes before the effect. It wouldn’t make any sense to say that support for marijuana legalization makes a person’s age increase. Even if you could predict someone’s age based on their support for marijuana legalization, you couldn’t say someone’s age was caused by their support for legalization of marijuana.
Finally, scientists must establish nonspuriousness. A is one in which an association between two variables appears to be causal but can in fact be explained by some third variable. This third variable is often called a or confounding variable because it clouds and confuses the relationship between your independent and dependent variable, making it difficult to discern the true causal relationship is.
Continuing with our example, we could point to the fact that older adults are less likely to have used marijuana recreationally. Maybe it is actually recreational use of marijuana that leads people to be more open to legalization, not their age. In this case, our confounding variable would be recreational marijuana use. Perhaps the relationship between age and attitudes towards legalization is a spurious relationship that is accounted for by previous use. This is also referred to as the third variable problem, where a seemingly true causal relationship is actually caused by a third variable not in the hypothesis. In this example, the relationship between age and support for legalization could be more about having tried marijuana than the age of the person.
Quantitative researchers are sensitive to the effects of potentially spurious relationships. As a result, they will often measure these third variables in their study, so they can control for their effects in their statistical analysis. These are called , and they refer to potentially confounding variables whose effects are controlled for mathematically in the data analysis process. Control variables can be a bit confusing, and we will discuss them more in Chapter 10, but think about it as an argument between you, the researcher, and a critic.
Researcher: “The older a person is, the less likely they are to support marijuana legalization.”
Critic: “Actually, it’s more about whether a person has used marijuana before. That is what truly determines whether someone supports marijuana legalization.”
Researcher: “Well, I measured previous marijuana use in my study and mathematically controlled for its effects in my analysis. Age explains most of the variation in attitudes towards marijuana legalization.”
Let’s consider a few additional, real-world examples of spuriousness. Did you know, for example, that high rates of ice cream sales have been shown to cause drowning? Of course, that’s not really true, but there is a positive relationship between the two. In this case, the third variable that causes both high ice cream sales and increased deaths by drowning is time of year, as the summer season sees increases in both (Babbie, 2010).[18]
Here’s another good one: it is true that as the salaries of Presbyterian ministers in Massachusetts rise, so too does the price of rum in Havana, Cuba. Well, duh, you might be saying to yourself. Everyone knows how much ministers in Massachusetts love their rum, right? Not so fast. Both salaries and rum prices have increased, true, but so has the price of just about everything else (Huff & Geis, 1993).[19]
Finally, research shows that the more firefighters present at a fire, the more damage is done at the scene. What this statement leaves out, of course, is that as the size of a fire increases so too does the amount of damage caused as does the number of firefighters called on to help (Frankfort-Nachmias & Leon-Guerrero, 2011).[20] In each of these examples, it is the presence of a confounding variable that explains the apparent relationship between the two original variables.
In sum, the following criteria must be met for a nomothetic causal relationship:
- The two variables must vary together.
- The relationship must be plausible.
- The cause must precede the effect in time.
- The relationship must be nonspurious (not due to a confounding variable).
The hypothetico-dedutive method
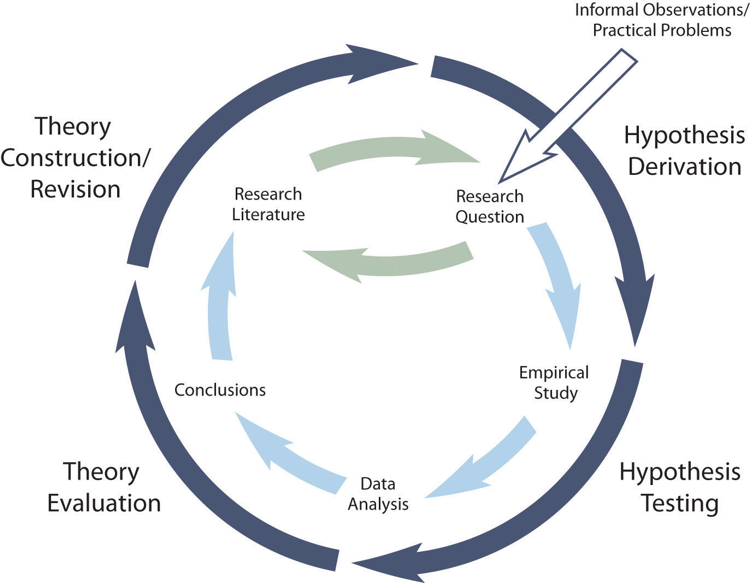
The primary way that researchers in the positivist paradigm use theories is sometimes called the (although this term is much more likely to be used by philosophers of science than by scientists themselves). Researchers choose an existing theory. Then, they make a prediction about some new phenomenon that should be observed if the theory is correct. Again, this prediction is called a hypothesis. The researchers then conduct an empirical study to test the hypothesis. Finally, they reevaluate the theory in light of the new results and revise it if necessary.
This process is usually conceptualized as a cycle because the researchers can then derive a new hypothesis from the revised theory, conduct a new empirical study to test the hypothesis, and so on. As Figure 8.8 shows, this approach meshes nicely with the process of conducting a research project—creating a more detailed model of “theoretically motivated” or “theory-driven” research. Together, they form a model of theoretically motivated research.

Keep in mind the hypothetico-deductive method is only one way of using social theory to inform social science research. It starts with describing one or more existing theories, deriving a hypothesis from one of those theories, testing your hypothesis in a new study, and finally reevaluating the theory based on the results data analyses. This format works well when there is an existing theory that addresses the research question—especially if the resulting hypothesis is surprising or conflicts with a hypothesis derived from a different theory.
But what if your research question is more interpretive? What if it is less about theory-testing and more about theory-building? This is what our next chapter covers: the process of inductively deriving theory from people’s stories and experiences. This process looks different than that depicted in Figure 8.8. It still starts with your research question and answering that question by conducting a research study. But instead of testing a hypothesis you created based on a theory, you will create a theory of your own that explain the data you collected. This format works well for qualitative research questions and for research questions that existing theories do not address.
Key Takeaways
- In positivist and quantitative studies, the goal is often to understand the more general causes of some phenomenon rather than the idiosyncrasies of one particular instance, as in an idiographic causal relationship.
- Nomothetic causal explanations focus on objectivity, prediction, and generalization.
- Criteria for nomothetic causal relationships require the relationship be plausible and nonspurious; and that the cause must precede the effect in time.
- In a nomothetic causal relationship, the independent variable causes changes in the dependent variable.
- Hypotheses are statements, drawn from theory, which describe a researcher’s expectation about a relationship between two or more variables.
Exercises
- Write out your working question and hypothesis.
- Defend your hypothesis in a short paragraph, using arguments based on the theory you identified in section 8.1.
- Review the criteria for a nomothetic causal relationship. Critique your short paragraph about your hypothesis using these criteria.
- Are there potentially confounding variables, issues with time order, or other problems you can identify in your reasoning?
8.3 Idiographic causal relationships
Learning Objectives
Learners will be able to…
- Define and provide an example of an idiographic causal explanation
- Differentiate between idiographic and nomothetic causal relationships
- Link idiographic and nomothetic causal relationships with the process of theory building and theory testing
- Describe how idiographic and nomothetic causal explanations can be complementary
We began the previous section with a definition of causality, or the idea that “one event, behavior, or belief will result in the occurrence of another, subsequent event, behavior, or belief.” Then, we described one kind of causality: a simple cause-and-effect relationship supported by existing theory and research on the topic, also known as a nomothetic causal relationship. But what if there is not a lot of literature on your topic? What if your question is more exploratory than explanatory? Then, you need a different kind of causal explanation, one that accounts for the complexity of human interactions.
How can we build causal relationships if we are just describing or exploring a topic? Recall the definitions of , , and from Chapter 2. Wouldn’t we need to do explanatory research to build any kind of causal explanation? Explanatory research attempts to establish nomothetic causal relationships: an independent variable is demonstrated to cause change in a dependent variable. Exploratory and descriptive qualitative research contains some causal relationships, but they are actually descriptions of the causal relationships established by the study participants.
What do idiographic causal explanations look like?
An tries to identify the many, interrelated causes that account for the phenomenon the researcher is investigating. So, if idiographic causal explanations do not look like Figure 8.5, 8.6, or 8.7 what do they look like? Instead of saying “x causes y,” your participants will describe their experiences with “x,” which they will tell you was caused and influenced by a variety of other factors, as interpreted through their unique perspective, time, and environment. As we stated before, idiographic causal explanations are messy. Your job as a social science researcher is to accurately describe the patterns in what your participants tell you.
Let’s think about this using an example. If I asked you why you decided to become a social worker, what might you say? For me, I would say that I wanted to be a mental health clinician since I was in high school. I was interested in how people thought, and I was privileged enough to have psychology courses at my local high school. I thought I wanted to be a psychologist, but at my second internship in my undergraduate program, my supervisors advised me to become a social worker because the license provided greater authority for independent practice and flexibility for career change. Once I found out social workers were like psychologists who also raised trouble about social justice, I was hooked.
That’s not a simple explanation at all! But it’s definitely a causal explanation. It is my individual, subjective truth of a complex process. If we were to ask multiple social workers the same question, we might find out that many social workers begin their careers based on factors like personal experience with a disability or social injustice, positive experiences with social workers, or a desire to help others. No one factor is the “most important factor,” like with nomothetic causal relationships. Instead, a complex web of factors, contingent on context, emerge when you interpret what people tell you about their lives.
Understanding “why?”
In creating an idiographic explanation, you are still asking “why?” But the answer is going to be more complex. Those complexities are described in Table 8.1 as well as this short video comparing nomothetic and idiographic relationships.
| Nomothetic causal relationships | Idiographic causal relationships | |
|---|---|---|
| Paradigm | Positivist | Interpretivist |
| Purpose of research | Prediction & generalization | Understanding & particularity |
| Reasoning | Deductive | Inductive |
| Purpose of research | Explanatory | Exploratory or descriptive |
| Research methods | Quantitative | Qualitative |
| Causality | Simple: cause and effect | Complex: context-dependent, sometimes circular or contradictory |
| Role of theory | Theory testing | Theory building |
Remember our question from the last section, “Are you trying to generalize or nah?” If you answered nah (or no, like a normal person), you are trying to establish an idiographic causal explanation. The purpose of that explanation isn’t to predict the future or generalize to larger populations, but to describe the here-and-now as it is experienced by individuals within small groups and communities. Idiographic explanations are focused less on what is generally experienced by all people but more on the particularities of what specific individuals in a unique time and place experience.
Researchers seeking idiographic causal relationships are not trying to generalize or predict, so they have no need to reduce phenomena to mathematics. In fact, only examining things that can be counted can rob a causal relationship of its meaning and context. Instead, the goal of idiographic causal relationships is understanding, rather than prediction. Idiographic causal relationships are formed by interpreting people’s stories and experiences. Usually, these are expressed through words. Not all qualitative studies use word data, as some can use interpretations of visual or performance art. However, the vast majority of qualitative studies do use word data, like the transcripts from interviews and focus groups or documents like journal entries or meeting notes. Your participants are the experts on their lives—much like in social work practice—and as in practice, people’s experiences are embedded in their cultural, historical, and environmental context.
Idiographic causal explanations are powerful because they can describe the complicated and interconnected nature of human life. Nomothetic causal explanations, by comparison, are simplistic. Think about if someone asked you why you wanted to be a social worker. Your story might include a couple of vignettes from your education and early employment. It might include personal experience with the social welfare system or family traditions. Maybe you decided on a whim to enroll in a social work course during your graduate program. The impact of each of these events on your career is unique to you.
Idiographic causal explanations are concerned with individual stories, their idiosyncrasies, and the patterns that emerge when you collect and analyze multiple people’s stories. This is the inductive reasoning we discussed at the beginning of this chapter. Often, idiographic causal explanations begin by collecting a lot of qualitative data, whether though interviews, focus groups, or looking at available documents or cultural artifacts. Next, the researcher looks for patterns in the data and arrives at a tentative theory for how the key ideas in people’s stories are causally related.
Unlike nomothetic causal relationships, there are no formal criteria (e.g., covariation) for establishing causality in idiographic causal relationships. In fact, some criteria like temporality and nonspuriousness may be violated. For example, if an adolescent client says, “It’s hard for me to tell whether my depression began before my drinking, but both got worse when I was expelled from my first high school,” they are recognizing that it may not so simple that one thing causes another. Sometimes, there is a reciprocal relationship where one variable (depression) impacts another (alcohol abuse), which then feeds back into the first variable (depression) and into other variables as well (school). Other criteria, such as covariation and plausibility, still make sense, as the relationships you highlight as part of your idiographic causal explanation should still be plausible and its elements should vary together.
Theory building and theory testing
As we learned in the previous section, nomothetic causal explanations are created by researchers applying deductive reasoning to their topic and creating hypotheses using social science theories. Much of what we think of as social science is based on this hypothetico-deductive method, but this leaves out the other half of the equation. Where do theories come from? Are they all just revisions of one another? How do any new ideas enter social science?
Through inductive reasoning and idiographic causal explanations!
Let’s consider a social work example. If you plan to study domestic and sexual violence, you will likely encounter the Power and Control Wheel, also known as the Duluth Model (Figure 8.9). The wheel is a model designed to depict the process of domestic violence. The wheel was developed based on qualitative focus groups conducted by sexual and domestic violence advocates in Duluth, MN. This video explains more about the Duluth Model of domestic abuse.
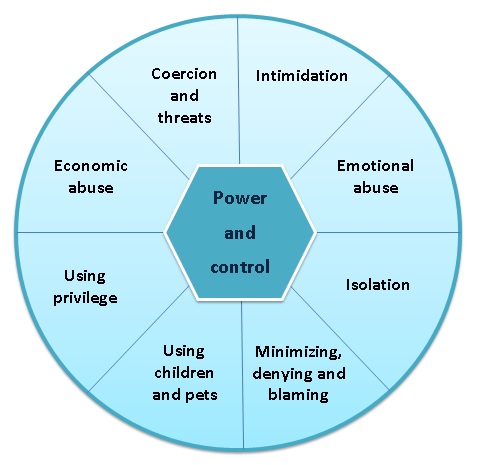
The Power and Control Wheel is an example of what an idiographic causal relationship looks like. By contrast, look back at the previous section’s Figure 8.5, 8.6, and 8.7 on nomothetic causal relationships between independent and dependent variables. See how much more complex idiographic causal explanations are?! They are complex, but not difficult to understand. At the center of domestic abuse is power and control, and while not every abuser would say that is what they were doing, that is the understanding of the survivors who informed this theoretical model. Their power and control is maintained through a variety of abusive tactics from social isolation to use of privilege to avoid consequences.
What about the role of hypotheses in idiographic causal explanations? In nomothetic causal explanations, researchers create hypotheses using existing theory and then test them for accuracy. Hypotheses in idiographic causality are much more tentative, and are probably best considered as “hunches” about what they think might be true. Importantly, they might indicate the researcher’s prior knowledge and biases before the project begins, but the goal of idiographic research is to let your participants guide you rather than existing social work knowledge. Continuing with our Duluth Model example, advocates likely had some tentative hypotheses about what was important in a relationship with domestic violence. After all, they worked with this population for years prior to the creation of the model. However, it was the stories of the participants in these focus groups that led the Power and Control Wheel explanation for domestic abuse.
As qualitative inquiry unfolds, hypotheses and hunches are likely to emerge and shift as researchers learn from what their participants share. Because the participants are the experts in idiographic causal relationships, a researcher should be open to emerging topics and shift their research questions and hypotheses accordingly. This is in contrast to hypotheses in quantitative research, which remain constant throughout the study and are shown to be true or false.
Over time, as more qualitative studies are done and patterns emerge across different studies and locations, more sophisticated theories emerge that explain phenomena across multiple contexts. Once a theory is developed from qualitative studies, a quantitative researcher can seek to test that theory. For example, a quantitative researcher may hypothesize that men who hold traditional gender roles are more likely to engage in domestic violence. That would make sense based on the Power and Control Wheel model, as the category of “using male privilege” speaks to this relationship. In this way, qualitatively-derived theory can inspire a hypothesis for a quantitative research project, as we will explore in the next section.
Complementary approaches
If idiographic and nomothetic still seem like obscure philosophy terms, let’s consider another example. Imagine you are working for a community-based non-profit agency serving people with disabilities. You are putting together a report to lobby the state government for additional funding for community support programs. As part of that lobbying, you are likely to rely on both nomothetic and idiographic causal relationships.
If you looked at nomothetic causal relationships, you might learn how previous studies have shown that, in general, community-based programs like yours are linked with better health and employment outcomes for people with disabilities. Nomothetic causal explanations seek to establish that community-based programs are better for everyone with disabilities, including people in your community.
If you looked at idiographic causal explanations, you would use stories and experiences of people in community-based programs. These individual stories are full of detail about the lived experience of being in a community-based program. You might use one story from a client in your lobbying campaign, so policymakers can understand the lived experience of what it’s like to be a person with a disability in this program. For example, a client who said “I feel at home when I’m at this agency because they treat me like a family member,” or “this is the agency that helped me get my first paycheck,” can communicate richer, more complex causal relationships.
Neither kind of causal explanation is better than the other. A decision to seek idiographic causal explanations means that you will attempt to explain or describe your phenomenon exhaustively, attending to cultural context and subjective interpretations. A decision to seek nomothetic causal explanations, on the other hand, means that you will try to explain what is true for everyone and predict what will be true in the future. In short, idiographic explanations have greater depth, and nomothetic explanations have greater breadth.
Most importantly, social workers understand the value of both approaches to understanding the social world. A social worker helping a client with substance abuse issues seeks idiographic explanations when they ask about that client’s life story, investigate their unique physical environment, or probe how their family relationships. At the same time, a social worker also uses nomothetic explanations to guide their interventions. Nomothetic explanations may help guide them to minimize risk factors and maximize protective factors or use an evidence-based therapy, relying on knowledge about what in general helps people with substance abuse issues.
So, which approach speaks to you? Are you interested in learning about (a) a few people’s experiences in a great deal of depth, or (b) a lot of people’s experiences more superficially, while also hoping your findings can be generalized to a greater number of people? The answer to this question will drive your research question and project. These approaches provide different types of information and both types are valuable.
Key Takeaways
- Idiographic causal explanations focus on subjectivity, context, and meaning.
- Idiographic causal explanations are best suited to exploratory research questions and qualitative methods.
- Idiographic causal explanations are used to create new theories in social science.
Exercises
- Explore the literature on the theory you identified in section 8.1.
- Read about the origins of your theory. Who developed it and from what data?
- See if you can find a figure like Figure 8.9 in an article or book chapter that depicts the key concepts in your theory and how those concepts are related to one another causally. Write out a short statement on the causal relationships contained in the figure.
8.4 Mixed methods research
Learning Objectives
Learners will be able to…
- Define sequence and emphasis and describe how they work in qualitative research
- List five reasons why researchers use mixed methods
As we discussed in the previous sections, while we contrast idiographic vs. nomothetic causality or inductive vs. deductive reasoning, the truth is that researchers combine both of these approaches when they conduct research. While these processes can occur in any kind of study, mixed methods research is an excellent example of how researchers use both approaches to logic and reasoning to improve understanding of a given topic.
So far in this textbook, we have talked about quantitative and qualitative methods as an either/or choice—you can choose quantitative methods or qualitative methods. However, researchers often use both quantitative methods inside of their research projects. This is called .
For example, I recently completed a study with administrators of state-level services for people with intellectual and developmental disabilities. They implemented a program called self-direction, which allows people with disabilities greater self-determination over their supports. In this study, my research partners and I used a mixed methods approach to describe the implementation of self-direction across the United States. We distributed a short, electronic questionnaire and conducted phone interviews with program administrators. While we could have just sent out a questionnaire that asked states to provide basic information on their program (size, qualifications, services offered, etc.), that would not provide us much information about some of the issues administrators faced during program implementation. Similarly, we could have interviewed program administrators without the questionnaire, but then we wouldn’t know enough about the programs to ask good questions. Instead, we chose to use both qualitative and quantitative methods to provide a more comprehensive picture of program implementation.
Sequence and emphasis
There are many different mixed methods designs, each with their own strengths and limitations (see Creswell & Clarke, 2017[21] for a more thorough introduction). However, a more simplified synthesis of mixed methods approaches is provided by Engel and Schutt (2016)[22] using two key terms. refers to the order that each method is used. Researchers can use both methods at the same time or concurrently. Or, they can use one and then the other, or sequentially.
For our study of self-direction, we used a sequential design by sending out a questionnaire first, conducting some analysis, and then conducting the interview. We used the quantitative questionnaire to gather basic information about the programs before we began the interviews, so our questions were specific to the features of each program. If we wanted to use a concurrent design for some reason, we could have asked quantitative questions during the interview. However, we felt this would waste the administrators’ time looking up information and would break up rhythm of the interviews.
The other key term in mixed methods research is . In our mixed methods study, the qualitative data was the most important data. The quantitative data was mainly used to provide background information for the qualitative interviews, and our study write up focused mostly on the qualitative information. Thus, qualitative methods were prioritized in our study. Of course, many other studies emphasize quantitative methods over qualitative methods. In these studies, qualitative data is used mainly to provide context for the quantitative findings.
For example, demonstrating quantitatively that a particular therapy works is important. By adding a qualitative component, researchers could find out how the participants experienced the intervention, how clients understood the therapy’s effects, and the meaning the therapy had on their lives. This data would add depth and context to the findings and allow researchers to improve the therapeutic technique in the future.
A similar practice is when researchers use qualitative methods to solicit feedback on a quantitative scale or measure. The experiences of individuals allow researchers to refine the measure before they conduct the quantitative component of their study. Finally, it is possible that researchers are equally interested in qualitative and quantitative information. In studies of equal emphasis, researchers consider both methods as the focus of the research project.
Why researchers use mixed methods
Mixed methods research is more than just sticking an open-ended question at the end of a quantitative survey. Mixed methods researchers use mixed methods for both pragmatic and synergistic reasons. That is, they use both methods because it makes sense with their research questions and because they will get the answers they want by combining the two approaches.
Mixed methods also allow you to use both inductive and deductive reasoning. As we’ve discussed, qualitative research follows inductive logic, moving from data to empirical generalizations or theory. In a mixed methods study, a researcher could use the results from a qualitative component to create a theory that could be tested in a subsequent quantitative component. The quantitative component would use deductive logic, using the theory derived from qualitative data to create and test a hypothesis. In this way, mixed methods use the strengths of both inductive and deductive reasoning. Quantitative allows the researcher to test existing ideas. Qualitative allows the researcher to create new ideas.
With these two concepts in mind, we can start to see why researchers use mixed methods in the real world. I mentioned previously that our research project used a sequential design because we wanted to use our quantitative data to shape what qualitative questions we asked our participants. Mixed methods are often used this way, to initiate ideas with one method to study with another. For example, researchers could begin a mixed methods project by using qualitative methods to interview or conduct a focus group with participants. Based on their responses, the researchers could then formulate a survey to give out to a larger group of people to see how common the themes from the focus groups were. This is the inverse of what we did in our project, which was to use a quantitative survey to inform a more detailed qualitative interview.
In addition to providing information for subsequent investigation, using both quantitative and qualitative information provides additional context for the data. For example, in our questionnaire for the study on self-direction, we asked participants to list what services people could purchase. The qualitative data followed up on that answer by asking whether the administrators had added or taken away any services, how they decided that these services would be covered and not others, and what problems that arose around providing these services. With that information, we could analyze what services were offered, why they were offered, and how administrators made those decisions. In this way, we learned the lived experience of program administrators, not just the basic information about their programs.
Finally, another purpose of mixed methods research is to corroborate data from both quantitative and qualitative sources. Ideally, your qualitative and quantitative results should support each other. For example, if interviews with participants showed a relationship between two concepts, that relationship should also be present in the qualitative data you collected. Differences between quantitative and qualitative data require an explanation. Perhaps there are outliers or extreme cases that pushed your data in one direction, for example.
In summary, these are a few of the many reasons researchers use mixed methods. They are summarized below:
- Triangulation, or convergence on the same phenomenon to improve validity
- Complementarity, which aims to get at related but different facets of a phenomenon
- Development, or the use of results from one phase or a study to develop another phase
- Initiation, or the intentional analysis of inconsistent qualitative and quantitative findings to derive new insights
- Expansion, or using multiple components to extend the scope of a study (Burnett, 2012, p. 77).[23]
A word of caution
The use of mixed methods has many advantages. However, undergraduate researchers should approach mixed methods with caution. Conducting a mixed methods study may mean doubling or even tripling your work. You must conceptualize a component using quantitative methods, another using qualitative methods, and think about how they fit together. This may mean creating a questionnaire, then writing an interview guide, and thinking through how the data on each measure relate to one another—more work than using one quantitative or qualitative method alone. Similarly, in sequential studies, the researcher must collect and analyze data from one component and then conceptualize and conduct the second component. This may also impact how long a project may take. Before beginning a mixed methods project, you should have a clear vision for what the project will entail and how each methodology will contribute to that vision. Always remember that you should make your project feasible enough for you to conduct with the time, money, and other resources you have at your disposal right now.
Key Takeaways
- Mixed methods studies vary in sequence and emphasis.
- Mixed methods allow the research to corroborate findings, provide context, follow up on ideas, and use the strengths of each method.
Exercises
- Look at the literature on your topic, and see if you can find a study that uses mixed methods.
- Describe the sequence and importance that the researchers places on the quantitative and qualitative components.
- Identify why the researchers used mixed methods and how the project would have been different had researchers used only one (qualitative or quantitative) component.
Media Attributions
- Inductive reasoning © Blackstone, A. is licensed under a CC BY-NC-SA (Attribution NonCommercial ShareAlike) license
- Figure 6.2: Deductive reasoning © Blackstone, A. is licensed under a CC BY-NC-SA (Attribution NonCommercial ShareAlike) license
- 40 © Blackstone, A. is licensed under a CC BY-NC-SA (Attribution NonCommercial ShareAlike) license
- 46 © DeCarlo, M. is licensed under a CC BY-NC-SA (Attribution NonCommercial ShareAlike) license
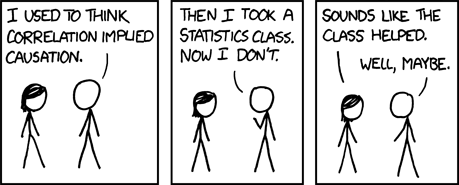
- correlation © Munroe, R. is licensed under a CC BY-NC (Attribution NonCommercial) license
- 4.4 © Rajiv S. Jhangiani, I-Chant A. Chiang, Carrie Cuttler, & Dana C. Leighton is licensed under a CC BY-NC-SA (Attribution NonCommercial ShareAlike) license
- Power_and_control_wheel © Carole Henson is licensed under a CC BY-SA (Attribution ShareAlike) license
- Allen, K. R., Kaestle, C. E., & Goldberg, A. E. (2011). More than just a punctuation mark: How boys and young men learn about menstruation. Journal of Family Issues, 32, 129–156. ↵
- Ferguson, K. M., Kim, M. A., & McCoy, S. (2011). Enhancing empowerment and leadership among homeless youth in agency and community settings: A grounded theory approach. Child and Adolescent Social Work Journal, 28, 1–22 ↵
- King, R. D., Messner, S. F., & Baller, R. D. (2009). Contemporary hate crimes, law enforcement, and the legacy of racial violence. American Sociological Review, 74, 291–315. ↵
- Milkie, M. A., & Warner, C. H. (2011). Classroom learning environments and the mental health of first grade children. Journal of Health and Social Behavior, 52, 4–22. ↵
- The American Sociological Association wrote a press release on Milkie and Warner’s findings: American Sociological Association. (2011). Study: Negative classroom environment adversely affects children’s mental health. Retrieved from: https://www.sciencedaily.com/releases/2011/03/110309073717.htm ↵
- Uggen, C., & Blackstone, A. (2004). Sexual harassment as a gendered expression of power. American Sociological Review, 69, 64–92. ↵
- Blackstone, A., Houle, J., & Uggen, C. “At the time I thought it was great”: Age, experience, and workers’ perceptions of sexual harassment. Presented at the 2006 meetings of the American Sociological Association. ↵
- Blackstone, A. (2012). Inductive or deductive? Two different approaches. Principles of sociological inquiry: Qualitative and quantitative methods. Saylor Foundation. ↵
- Schutt, R. K. (2006). Investigating the social world: The process and practice of research. Thousand Oaks, CA: Pine Forge Press. ↵
- Sherman, L. W., & Berk, R. A. (1984). The specific deterrent effects of arrest for domestic assault. American Sociological Review, 49, 261–272. ↵
- Williams, K. R. (2005). Arrest and intimate partner violence: Toward a more complete application of deterrence theory. Aggression and Violent Behavior, 10(6), 660-679. ↵
- Policastro, C., & Payne, B. K. (2013). The blameworthy victim: Domestic violence myths and the criminalization of victimhood. Journal of Aggression, Maltreatment & Trauma, 22(4), 329-347. ↵
- Berk, R., Campbell, A., Klap, R., & Western, B. (1992). The deterrent effect of arrest in incidents of domestic violence: A Bayesian analysis of four field experiments. American Sociological Review, 57, 698–708; Pate, A., & Hamilton, E. (1992). Formal and informal deterrents to domestic violence: The Dade county spouse assault experiment. American Sociological Review, 57, 691–697; Sherman, L., & Smith, D. (1992). Crime, punishment, and stake in conformity: Legal and informal control of domestic violence. American Sociological Review, 57, 680–690. ↵
- Taylor, B. G., Davis, R. C., & Maxwell, C. D. (2001). The effects of a group batterer treatment program: A randomized experiment in Brooklyn. Justice Quarterly, 18(1), 171-201. ↵
- Wagner III, W. E., & Gillespie, B. J. (2018). Using and interpreting statistics in the social, behavioral, and health sciences. SAGE Publications. ↵
- Uggen, C., & Blackstone, A. (2004). Sexual harassment as a gendered expression of power. American Sociological Review, 69, 64–92. ↵
- In fact, there are empirical data that support this hypothesis. Gallup has conducted research on this very question since the 1960s. For more on their findings, see Carroll, J. (2005). Who supports marijuana legalization? Retrieved from http://www.gallup.com/poll/19561/who-supports-marijuana-legalization.aspx ↵
- Babbie, E. (2010). The practice of social research (12th ed.). Belmont, CA: Wadsworth. ↵
- Huff, D. & Geis, I. (1993). How to lie with statistics. New York, NY: W. W. Norton & Co. ↵
- Frankfort-Nachmias, C. & Leon-Guerrero, A. (2011). Social statistics for a diverse society. Washington, DC: Pine Forge Press. ↵
- Creswell, J. W., & Clark, V. L. P. (2017). Designing and conducting mixed methods research. Sage publications. ↵
- Engel, R. J. & Schutt, R. K. (2016). The practice of research in social work (4th ed.). Washington, DC: SAGE Publishing. ↵
- Burnett, D. (2012). Inscribing knowledge: Writing research in social work. In W. Green & B. L. Simon (Eds.), The Columbia guide to social work writing (pp. 65-82). New York, NY: Columbia University Press. ↵
when a researcher starts with a set of observations and then moves from particular experiences to a more general set of propositions about those experiences
starts by reading existing theories, then testing hypotheses and revising or confirming the theory
a statement describing a researcher’s expectation regarding what they anticipate finding
when researchers use both quantitative and qualitative methods in a project
the idea that one event, behavior, or belief will result in the occurrence of another, subsequent event, behavior, or belief
provides a more general, sweeping explanation that is universally true for all people
(as in generalization) to make claims about a large population based on a smaller sample of people or items
“a logical grouping of attributes that can be observed and measured and is expected to vary from person to person in a population” (Gillespie & Wagner, 2018, p. 9)
causes a change in the dependent variable
a variable that depends on changes in the independent variable
Occurs when two variables move together in the same direction - as one increases, so does the other, or, as one decreases, so does the other
occurs when two variables change in opposite directions - one goes up, the other goes down and vice versa
when the values of two variables change at the same time
as a criteria for causal relationship, the relationship must make logical sense and seem possible
as a criteria for causal relationship, the cause must come before the effect
when a relationship between two variables appears to be causal but can in fact be explained by influence of a third variable
a variable whose influence makes it difficult to understand the relationship between an independent and dependent variable
a confounding variable whose effects are accounted for mathematically in quantitative analysis to isolate the relationship between an independent and dependent variable
A cyclical process of theory development, starting with an observed phenomenon, then developing or using a theory to make a specific prediction of what should happen if that theory is correct, testing that prediction, refining the theory in light of the findings, and using that refined theory to develop new hypotheses, and so on.
conducted during the early stages of a project, usually when a researcher wants to test the feasibility of conducting a more extensive study or if the topic has not been studied in the past
research that describes or defines a particular phenomenon
explains why particular phenomena work in the way that they do; answers “why” questions
attempts to explain or describe your phenomenon exhaustively, based on the subjective understandings of your participants
in mixed methods research, this refers to the order each method is used
in mixed methods research, this refers to the order in which each method is used, either concurrently or sequentially
