
Neuroanatomy & Neuroscience Methods
Austin Lim
Additional Videos and Readings
Video– Author/Source: Scientific Frontiers; Severed Corpus Callosum
PBS’ Scientific American Frontiers interviews brain scientist Mike Gazzaniga and his patient, Joe, who had surgery to treat epileptic seizures. The surgery cut the corpus callosum, disconnecting the two sides of his brain, which allows the two sides to interpret information and process muscle movements and speech separately.
Pediatrician Nadine Burke Harris explains that the repeated stress of abuse, neglect and parents struggling with mental health or substance abuse issues has real, tangible effects on the development of the brain. This unfolds across a lifetime, to the point where those who’ve experienced high levels of trauma are at triple the risk for heart disease and lung cancer. An impassioned plea for pediatric medicine to confront the prevention and treatment of trauma, head-on.
Reflection Readings
Amstrong – 2015 – AMA Journal of Ethics – The myth of the normal brain: embracing neurodiversity
Chapter 2: Anatomy of the Nervous System
To physically take something apart is a great way to learn about the relationship between structure and function. Engineers and electricians use schematics to help them figure out what parts connect to where, and architects may use blueprints to aid them in the creation of a building. You can learn a lot about a system by understanding the function of the individual components and how they interact with one another. The whole is often greater than the sum of their parts, and a failure of one part to perform its duty can have wide reaching consequences.
The nervous system is one of the most complex systems that we know of. Parts of this system malfunction frequently, and the results are a wide range of neurological disorders that affect humans, from injury to genetic disorders.
The gross anatomy of the nervous system is an important foundation to the studies of other aspects of neuroscience. This chapter covers some of the major anatomical structures in the nervous system, starting with the brain, working down the spinal cord, all the way out to nonnervous tissue. The end of this chapter will also cover the many support structures that allow the nervous system to carry out their jobs.
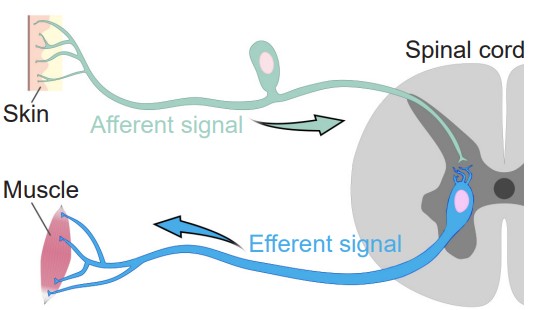
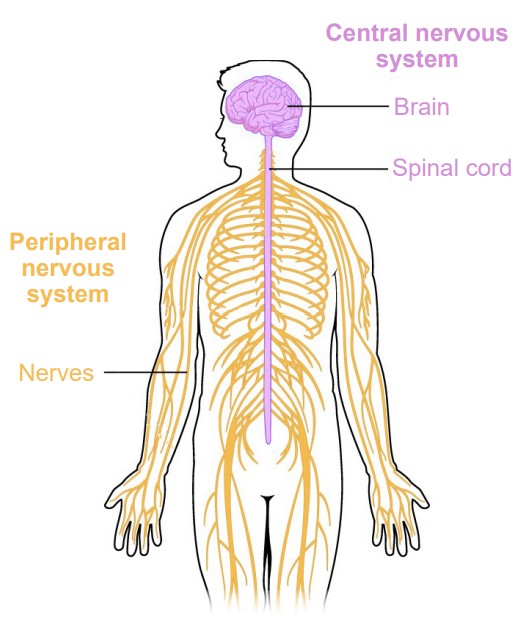
Broadly speaking, the nervous system can be divided into two main categories: The and the . Simply put, the CNS is the brain and spinal cord, while the PNS is all the other nerve cells in the body. The two systems are not isolated from each other; information passes rapidly between the PNS and the CNS, and vice versa. When a signal that originates in the PNS moves to the CNS, we sometimes say that the signal is incoming or ascending, while the CNS to PNS direction is outgoing or descending. Information that arrives into the CNS is also called an , while information leaving the CNS is an . These two terms are frequently confused, but you can use the knowledge of other words that start with “e” to remember that an “exit” or an “escape” is something that moves away. Alternatively, an efferent signal is something that has an effect on the outside world, while an afferent signal affects the person.
Central Nervous System (CNS)
Anatomically, the CNS consists of two organs, the brain and the spinal cord. The brain is the main organ where movement originates, where thoughts and plans develop, and where consciousness is housed. The brain is what pushes us to act on our drives and desires, where language begins, and where memories are stored. At 160 mm ( ~6 in) long and 90 mm tall ( ~3.5 in), it has a total volume of about 1400 cubic centimeters and would fill about a third of a gallon. The intact adult brain weighs about 1.5 kg (3 pounds), which is barely 2% of total body weight. Despite this relatively small size, it is extremely power hungry, and uses up about one-fifth of the body’s total energy expenditure.
Anatomical language of the brain
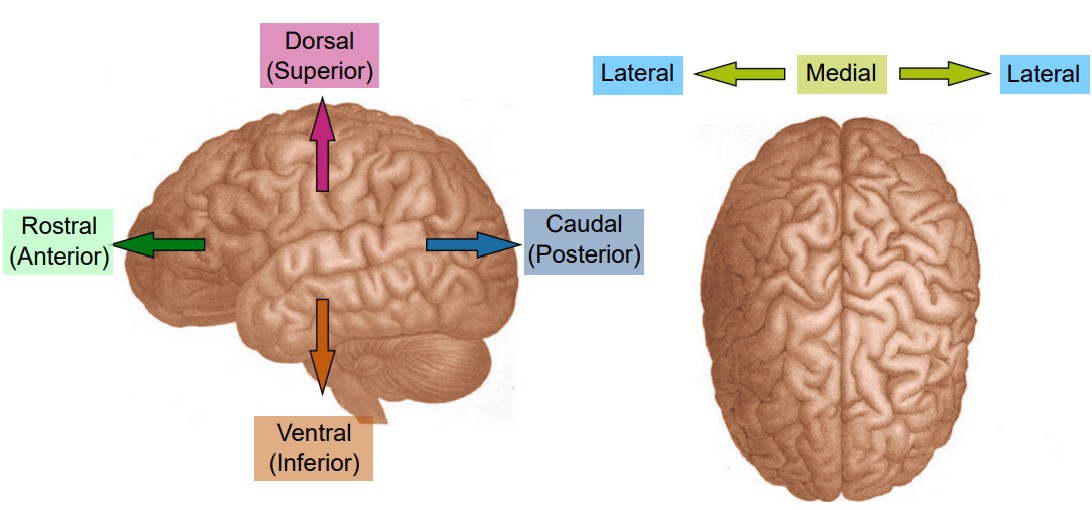
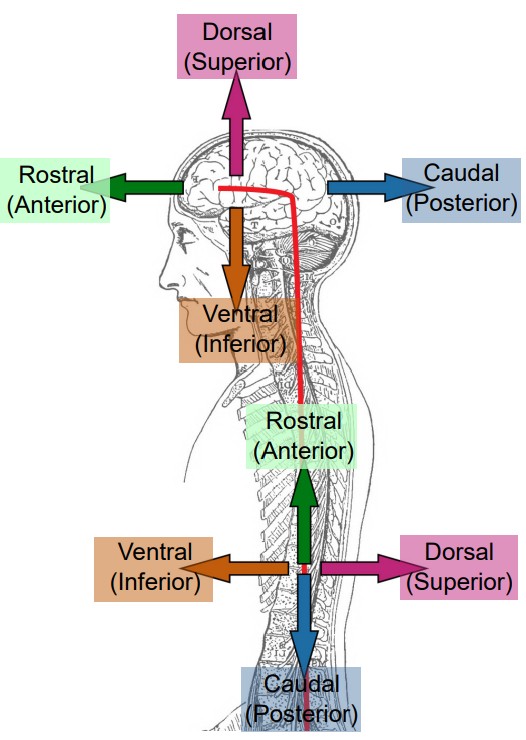
When talking about parts of the brain, it is helpful to have a set of words that can describe the location of various anatomical structures unambiguously. Think of the following three pairs of anatomical words as the “north, east, south, west” of the brain.
Consider a person who is facing sideways. Here, we’d like to use language that can describe anatomical structures that are along the “front of the head” to the “back of the head” axis. Parts of the brain that is more forward is called , which comes from the Latin word meaning beak. To describe structures towards the back part of the brain, we use , the opposite of rostral. Another pair of words that describes this same directional axis is and : ante- meaning “before” and post- meaning “after”. Often, rostral and anterior are used interchangeably, as are caudal and posterior.
Another axis that should be considered is the top-to-bottom direction. Brain structures that are above, or closer to the top of the head, are described as being , while the structures that are below are . As before, you may see another pair of words that share the same meaning. Sometimes, is used to describe a structure on top, while is used to describe a structure below.
Now, imagine that the person has turned to face towards you. The third axis can be demonstrated seen in this orientation. Brain structures that are closer to the center of the brain are described as being , while structures that are closer to the sides of the brain are .
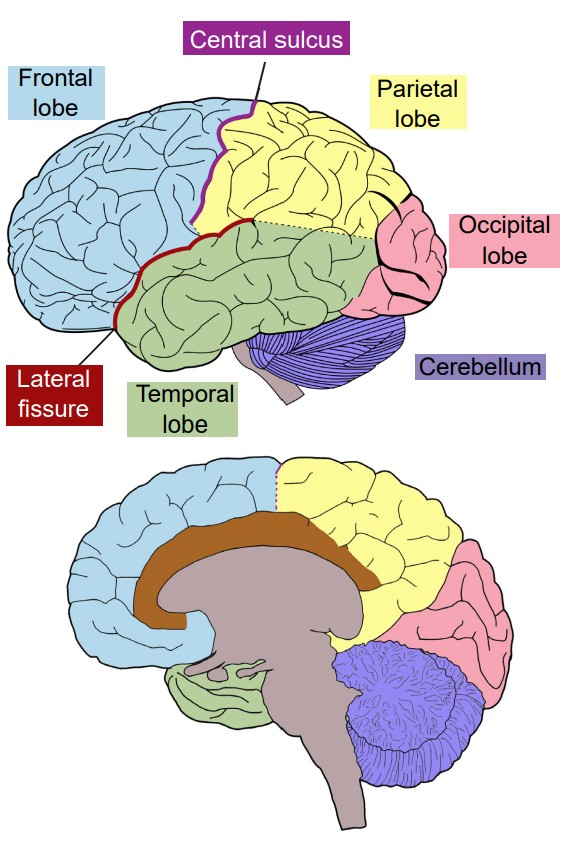
Neuroanatomists use these words to describe the relationship of one structure to another. For example, in Fig 2.7 which shows the four lobes of the brain, the frontal lobe is anterior or rostral to the parietal lobe, and the parietal lobe is dorsal to the temporal lobe. These anatomical words can also be combined to subdivide complex brain regions. The thalamus has many small subsections, such as the dorsomedial nucleus or the ventropostero-lateral nucleus. Naming structures with this anatomical language is useful in identifying where they are located in a brain scan or autopsy, but these words tell us nothing about function.
Visualizing the brain
As a three dimensional structure, the brain can be sectioned for visualization or analysis in several ways. Here, we will describe the three main orientations, each at right angles to the others.
One projection of the brain is called a slice. Imagine that you were looking at a brain of a person who was looking to the left. If the brain was cut into several sections vertically, slicing from anterior to posterior, the brain would be cut into coronal slices. “Corona” comes from the Latin word for crown, since looking at the brain cut into slices parallel to a crown would be a coronal section.
Another way to image the brain is called a projection. In a horizontal slice, cuts are made along the dorsal-ventral direction, from the top of the brain to the bottom. Given that the person is standing up, horizontal slices are parallel to the plane of the ground. Another way to think of the horizontal plane is through brain imaging techniques where a person moves headfirst into a scanner. Here, the machines are capturing horizontal images where each progressive image is a snapshot of the brain slightly more ventral than the last.
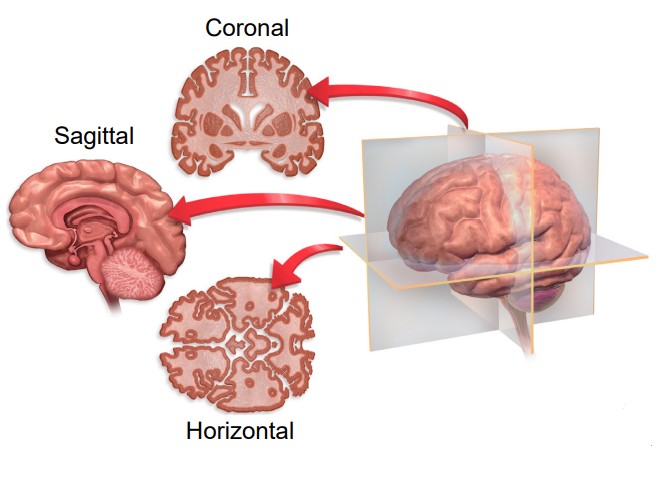
The third and last direction is a slice. The parasagittal section takes cuts parallel to the midline, slicing in the medial / lateral plane. If a person was facing you, and brain sections were taken across from left to right, these would be parasagittal sections. Notably, because the parasagittal section only samples from one hemisphere of the brain at a time, parasagittal slices are never symmetrical. The word -sagittal comes from the Latin word meaning arrow, like the zodiac sign Sagittarius (If you were an archer drawing back a bow and arrow, a parasagittal slice would be parallel to that plane).
In a sliced section of the brain, you might notice that brain tissue has different colored areas. Some brain tissue is pale and almost white, and these areas are described as . Generally, white matter represents pathways of communication. For neurons to send signals rapidly, the cells can be modified in a way that adds several layers of fatty lipids called . This modification causes light to reflect, causing it to appear white to the eye (think of the strips of fat that you might see in a steak). Other sections of brain tissue have a darker pink / gray color, appropriately called . These areas are usually dense with cell bodies.
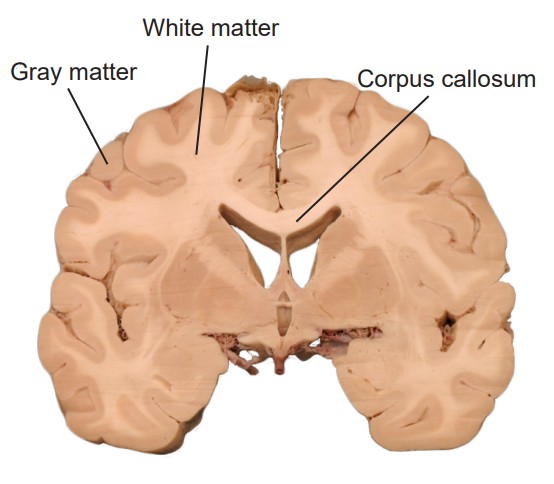
The brain has two very similar halves, the left and right hemisphere. Oftentimes, in the neurotypical individual, information passes between both hemispheres rapidly: what one hemisphere senses or learns, so does the other hemisphere. It is the white matter tracts that allow for this transfer of information. When a white matter pathway crosses from one hemisphere to another, we call it a decussation. In coronal or horizontal brain slices, you may be able to observe the main white matter tract that allows for the passage of information between the two hemispheres, called the .
Brain structures through development
The brain is often divided into five groups based on their developmental origin. When the embryo first starts to form, cells are classified into three main germ layers: the ectoderm, mesoderm, and endoderm. Of the three, the ectoderm eventually develops into the nervous system. The ectoderm layer folds into itself, and after merging at the surface, creates the . This neural tube forms during the third to fourth week of gestation. The cells of the neural tube will eventually become the components of the CNS.
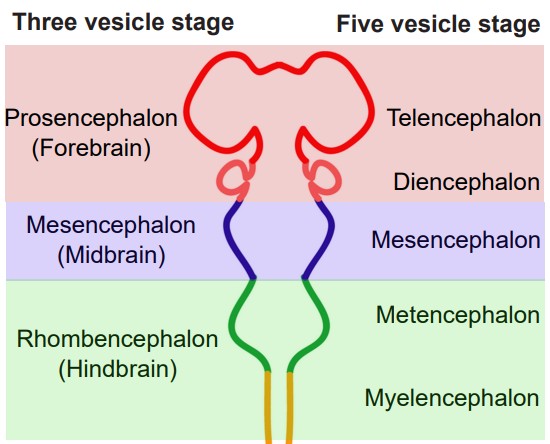
Early in development, the neural tube has three distinct compartments. At this time, the undeveloped nervous system is appropriately called the “three-vesicle stage.” One week later, parts of this progenitor nervous system divide; this becomes the “five-vesicle stage.” The names of the five vesicles can be used to describe either the stages through development, or a grouping of structures that eventually form in adulthood. From posterior to anterior, they are:
1. Rhombencephalon, or hindbrain
Evolutionarily speaking, the rhombencephalon represents the oldest part of the CNS. These structures likely evolved some 570 million years ago. As these structures develop into the five-vesicle stage, they become subdivided into two regions:
a. Myelencephalon
The myelencephalon develops into the , a structure that is found at the posterior end of the brain stem. The medulla contains many clumps of neurons that are responsible for functions that an organism carries out unconsciously, such as breathing or changes in heart rate and blood pressure. It also contains areas that can detect toxins in the blood that come from dietary sources, triggering vomiting.
b. Metencephalon
The metencephalon develops into two structures, the and . The pons, like the medulla, helps us perform involuntary functions like breathing. It also contains several areas that help us hear sounds and taste foods. The cerebellum, or “little brain”, is best known as a structure that enables motor control functions, such as balance, coordination, posture, and learning physical actions.
2. Mesencephalon, or midbrain
The midbrain structures do not change much from the three-vesicle stage to the five-vesicle stage. There are many structures in the midbrain, and they can perform a wide variety of functions. For example, the periaqueductal gray allows us to respond to painful stimuli, the red nucleus and substantia nigra coordinate complex movements, the tectum allows us to respond to incoming visual stimuli, and the ventral tegmental area is important for the processing of reward and motivation.
3. Prosencephalon, or forebrain
The prosencephalon eventually develops into the “higher order” brain regions, including the cerebral cortex. Most of the time, when you see an image of an intact brain from the side or the top, the structures that are visible to you are the forebrain structures.
a. Diencephalon
The diencephalon contains a few major structures. The is often referred to as a “relay station” in the brain, since almost every sensory modality (sight, taste, touch, hearing, and more) passes information through the thalamus. The is also within the diencephalon, and this structure serves as a communication route to the body’s endocrine system. Neural signals originating in the hypothalamus have the capability to influence the chemistry and function of the entire body.
b. Telencephalon
Structures of the telencephalon are the basal ganglia and cerebral cortex. The are made up of a series of brain structures that are used for such behaviors as motor and habit learning, emotional processing, and action selection. The makes up the outermost layer of the brain: the word cortex itself comes from the word meaning “bark,” the outer layer of a tree. Here, the brain processes behaviors such as attention, memory, and language.
It may be useful to think of brain structures as roughly being organized in a phylogenetic “timeline”. The more basic features of a creature are generally controlled by posterior brain structures, and the more complex functions are carried out by structures towards the anterior end of the brain. For example, the brain stem of the hindbrain contains networks of cells for basic survival, such as respiration and simple locomotion. Next, the midbrain is important for motivation and more coordinated movements. And finally, the forebrain carries out the highest order functions, such as personality, intentional inhibition of actions, and planning out long term actions. All of the structures work together simultaneously to produce the whole range of animal activities.
Major lobes of the cortex
Most of what we see when we imagine the brain is , the bumpy outer surface that is made up of raised ridges (, singular gyrus) and grooved indentations (, singular sulcus; sometimes also called a ). Although each gyrus and sulcus has a name that either identifies its function or location, there are only three sulci that we will introduce here to help orient us around the neuroanatomical features of the cortex. The is the most obvious fissure in the brain. It divides the two hemispheres, running along the anterior-posterior axis, visible from a dorsal view of the brain. If you were to cut along the longitudinal fissure completely, you would get two symmetrical portions of brain, the left and right hemispheres. The is a large fissure that starts at the dorsal part of the brain at about the halfway point on the anterior-posterior axis. In a sagittal view, the central sulcus runs ventrally about half the length of the brain. The other groove worth noting is the . This one runs roughly along the anterior to posterior direction, and curves gently dorsally. Again in a sagittal view, it is roughly seen in the middle third of the brain in the anterior-posterior axis.
The cortex is roughly divided into 4 major lobes, which are named after the bones of the skull that surround each section of brain. The lobes are paired, meaning that the whole brain contains two of each, a left and a right. In general, the structures are roughly symmetrical. The four lobes of the cortex and their functions, approximately from posterior to anterior, are:
1. Occipital lobe
The occipital lobe is the posterior most section of the brain. Anatomically, there is not an obvious border that separates the occipital lobe from adjacent areas of the cortex. The occipital lobe is the smallest of the four lobes.
The main function of the occipital lobe is for processing of visual stimuli. Our eyes are capable of capturing light and converting that light into signals. The of the occipital lobe, also called V1, interprets those signals into a representation of the visual world. Other vision-related stimuli, such as objects in motion, object orientation, and color are also processed by neurons in the occipital lobe.
2. Temporal lobe
The temporal lobe is the ventral-most lobe of the brain, and the lateral fissure marks its dorsal border. It is anterior to the occipital lobe. It is the lobe of the brain that is immediately behind the temple, the structure on the lateral aspect of the skull. The name comes from the Latin word meaning time: the passage of time in adults is often marked by graying hair, and these gray hairs may first appear at the temples.
The auditory system allows our brain to interpret sound waves. We can distinguish between voices talking, instruments playing, and dogs barking. This is possible because of a population of cells located in the temporal lobe called the , or A1.
The ability to remember important facts depends on memory-related processes. These functions are carried out in part by a brain structure called the , which is buried medially and ventrally in the temporal lobe.
The temporal lobe also houses some structures that are important for language. Patients with injuries in parts of the temporal lobe may experience deficits in the comprehension of language, while different injuries lead to a deficit in the production of language.
3. Parietal lobe
The parietal lobe is in the dorsal aspect of the brain, and immediately anterior to the occipital lobe. The anterior-most (front) end of the parietal lobe is bordered by the central sulcus, and the ventral border is the lateral fissure.
The sense of touch is complex. With our skin, we are able to detect light touch, temperature, pain, vibration, and many other modalities. This ability to sense different tactile properties of things in the world around us with our body is one of the major functions of the parietal lobe. Another closely related sense, , the ability to identify where parts of your body are located, is also processed by neurons of the parietal lobe. These functions are carried out by the , or S1 (soma- referring to the body).
4. Frontal lobe
The frontal lobe is the anterior most part of the brain. The posterior border of the frontal lobe is the lateral sulcus. Among mammals, it is the largest of the four lobes.
The frontal lobe contains the , or M1, which is directly anterior to the central sulcus. M1 contains neurons that control movement of the body. For example, if you were to activate the dorsal most part of M1 in a person, you would see motor activity in the leg.
The frontal lobe also carries out the “higher order” functions of the brain. Our personality is influenced by the frontal lobe – an injury to these brain structures can result in a radical change in a person’s behavior. Frontal lobe allows us to do mental math, to hold a string of letters in our head to be repeated backward, and to suppress socially unacceptable actions
Clinical connection: Phineas Gage
The mid-1800s saw an expansion of industry in the United States. The most reliable and quickest way to move goods and people was with the railways that were starting to zig-zag across the growing country. The factor slowing down railway expansion was terrain: land had to be relatively flat for the tracks to be laid down. Terraforming mountains was a dangerous ordeal, and in the years before TNT, a relatively safe explosive was developed, work accidents were a risk that these demolition workers faced.
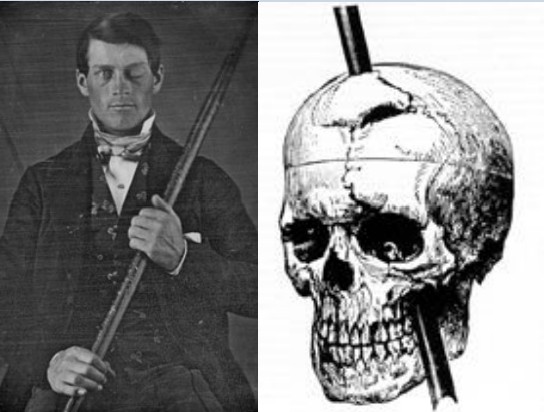
Phineas Gage was one of those workers. In the green mountain hills of Vermont, Gage was putting explosive powder into a crack in a mountain to clear land for a new railway. As Gage packed the explosive using a three-foot-long metal rod, a spark accidentally ignited the blast prematurely, causing the tamping iron to rocket cleanly through Gage’s skull.
Miraculously, Gage survived the blast. Within a month, he had made an almost complete recovery. Gage was talking excitedly with his doctors, he was eating voraciously, and even reported experiencing no pain. While the doctors noticed that his entire frontal lobe had been destroyed, it was his friends who noticed the dramatic change in his personality: whereas he was once a friendly man, adored and respected by his coworkers, the new Gage was irreverent, generally unlikable, and prone to using profanity at the most inappropriate times. The pre-injury Gage was a shrewd businessman who followed through with his plans, but Gage now was unreliable and at times, acted almost animalistically. Because of the injuries to his frontal lobe, his friends described him as being “no longer Gage.”
Spinal Cord
It is sometimes easy to think of neuroscience as a focused study of the brain: How does activity of the brain contribute to behavior? In what ways does the brain change in disease? Why do the cells of the brain behave the way they do?
The truth is there are many parts of the body that also fall under the broad study of neuroscience. For example, the automatic knee-jerk reflex that a clinician examines when they tap on your patellar tendon is a test of the nervous system. The reflex is driven by sensory neurons that detect muscle stretch, motor neurons that cause the kicking response, and interneurons that prevent the opposing muscle from acting. We have neural circuits that provoke changes in the activity of our internal organs, from the beating of our heart to the digestion of food, and the study of these systems is certainly part of neuroscience as well.
Moving posterior from the brainstem is the other organ of the central nervous system, a long, thin structure of nervous tissue called the . It functions to carry information both upwards towards the brain, and downwards towards the body’s other organs and muscles. It can also process sensations and form an appropriate motor response in the absence of brain input. The spinal cord originates roughly at the level of your neck and runs down to the small of your back, giving it a length around 44 cm (17.5 inches). The diameter of the spinal cord is not uniform all the way down, being ~13 mm (0.5 inches) at its widest and ~6.5 mm (0.25 inches) in diameter at the thinner areas (slightly smaller than the diameter of a pencil).
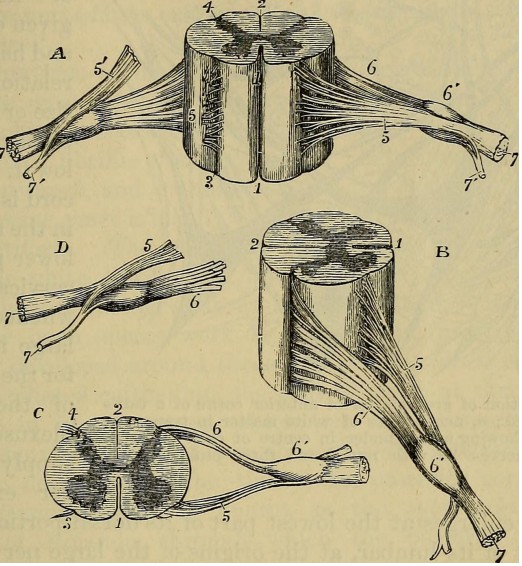
The spinal cord is housed within a series of bones, called the vertebral column. Although the spinal cord itself is continuous, it can be divided based on the overlying vertebrae. A combination of a letter and a number is used to identify each section of the spinal cord, the letter corresponding to the vertebral section and the number referring to the number of bones down from the previous section (the smaller numbers are more anterior, larger numbers more posterior). Branching off from each section of the spinal cord are two pairs of nerves, the afferent (incoming to the CNS) sensory nerve roots which branch from the dorsal side of the spinal cord, and the efferent (outgoing from the CNS) motor nerve roots which branch from the ventral side of the spinal cord. These two branches meet and extend away from the spinal cord. After merging, they are called the , and humans have 31 pairs of these.
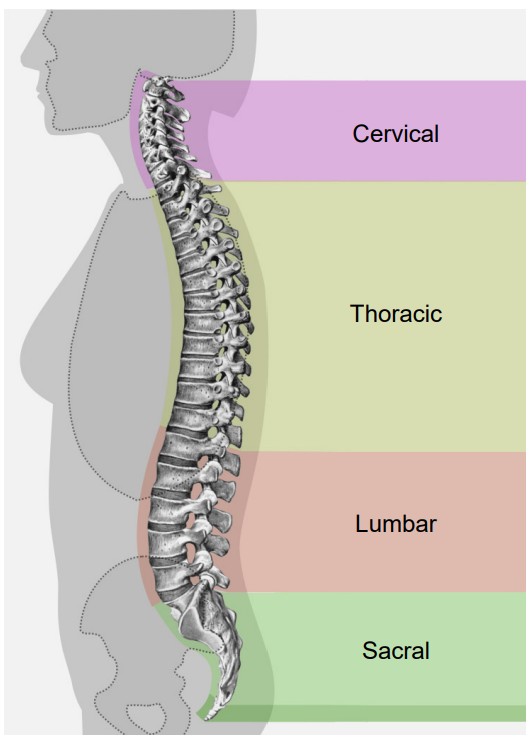
Moving from anterior (top) to posterior (bottom), the four regions of the spinal cord are:
1. Cervical
The cervical region corresponds to the upper 8 pairs of spinal nerves. Nerves that exit through the cervical region innervate the muscles in the neck, shoulders, arms and hands. Afferent nerves detect somatosensory inputs from these same areas. Sections C3 through C5 innervate the diaphragm, so an injury at this level or higher can quickly lead to death since the person may stop breathing. The spinal cord is at the widest diameter at the cervical area, as it has a swelling that corresponds to the many inputs and outputs to the arms.
2. Thoracic
There are 12 pairs of spinal nerves that make up the thoracic area of the spinal cord. These regions innervate the middle trunk area, the intercostal muscles between the ribs, and abdominal muscles. Branches off the spinal nerves in the thoracic areas are responsible Open Neuroscience Initiative Downloaded from www.austinlim.com 2-12 for changing the activity of the various internal organs during a fight-or-flight response (more on the autonomic nervous system in section 2.2).
3. Lumbar
There are 5 pairs of lumbar spinal nerves. These pathways carry motor command information to the hips, thighs, and knees . Afferent lumbar inputs detect sensory information from the ventral side of the legs, such as the top of the thigh or the shin bone. As in the cervical region, the lumbar region has a swelling that increases the diameter of this section of spinal cord compared to the thoracic or sacral areas.
4. Sacral
At the posterior-most end of the spinal cord is the sacral region, which consists of 5 pairs of nerves. Sacral spinal nerves control flexing of the toes. These nerves detect sensory information around the genital organs and the dorsal aspects of the legs, like the buttocks and the back of the thighs. There are also parasympathetic nerves that come from the sacral region, and these innervate the colon, bladder, and genital organs (again, more on the autonomic nervous system in 2.2).
Since information must pass through the anterior regions of the spinal cord to reach the posterior parts of the body, the more anterior an injury, the more parts of the body that are affected. The disease that affected former U.S. President Franklin Delano Roosevelt likely damaged posterior spinal cord structures, which explains why function of his legs was lost while function of his arms were left intact. However, the injury actor Christopher Reeves sustained while horseback riding destroyed his spinal cord at the anterior-most level of C1, causing complete paralysis and lack of sensation from the neck down.
Unlike in the brain, there is basically only one truly meaningful projection of the spinal cord, and that is by cutting sections in the plane. These sections are parallel to the ground if the spinal cord was oriented vertically, like a person standing up. Sometimes, this projection is also called a .
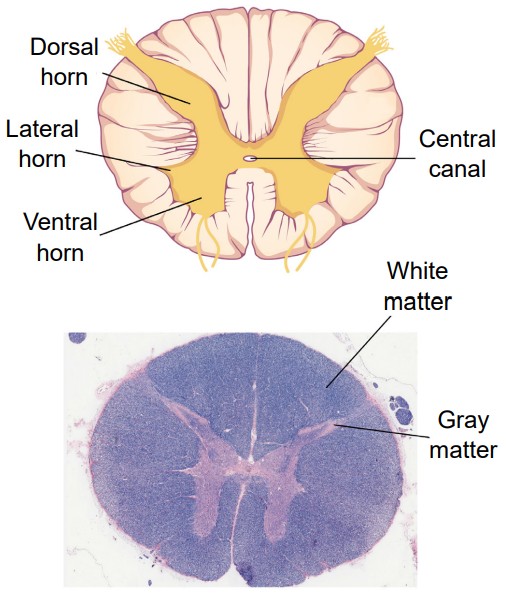
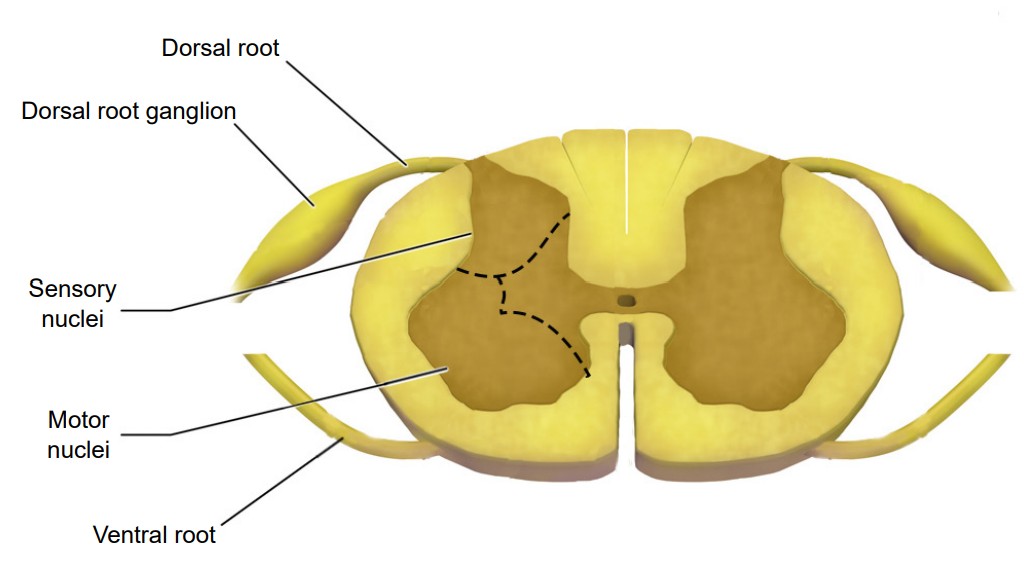
No matter which level of the spinal cord you look at, all cross-sections have a few similarities. Most notably, the inner portion of a section has a butterfly-shaped structure of gray matter surrounded by a border of white matter. Gray matter contains mostly cell bodies while white matter contains mostly pathways of communication. Therefore, the ascending sensory tracts and descending motor tracts run along the outer portions of a spinal cord section.
Another feature that is seen across all levels of the spinal cord are the entry points for the afferent sensory nerves and the exit points for the efferent motor nerves. Somatosensory information arrives into the spinal cord from the dorsal side. Most of the sensory neurons have their cell bodies outside of the spinal cord in a large clump of nervous tissue close to the dorsal side called the . On the other hand, efferent motor nerves exit the spinal cord on the ventral side.
One of the main differences across different sections of the spinal cord is the ratio of white matter to gray matter. In general, the ratio leans towards more white matter at the anterior regions of the spinal cord compared to the posterior parts of the spinal cord.
The CNS ends at the spinal nerves. The remaining nerves that affect the muscles and beyond are the beginning of the peripheral nervous system.
Peripheral Nervous System (PNS)
The PNS functions as the intermediary between the CNS and the rest of the body, including the skin, internal organs, and muscles of our limbs.
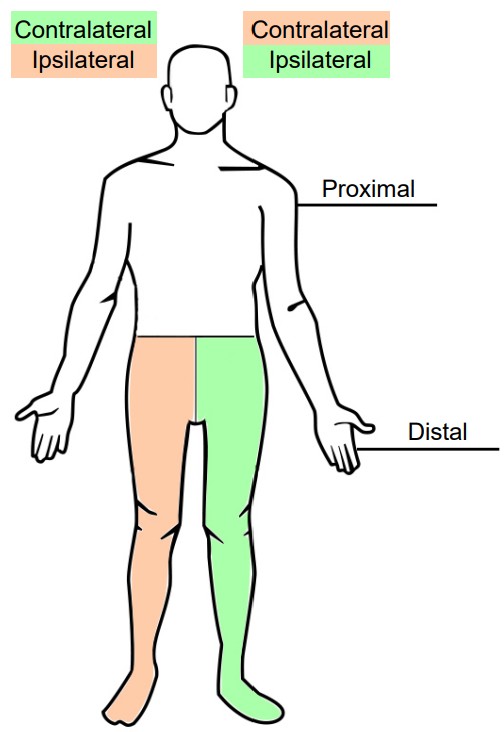
When talking about the PNS, another pair of anatomical words will be introduced, proximal and distal. A part of the body that is more proximal is something that is in close proximity to the CNS, whereas something that is distal is farther away, or more distant, from the CNS. For example, the efferent nerves that project to the neck and shoulder muscles are proximal to the nerves that project to the hand muscles.
Another pair of anatomical terms that is useful in describing the nervous system is and . When the vertebrate nervous system evolved, there was a preference for a “crossed system,” one where the left half of the brain generally controlled and received information from the right half of the body, and vice versa. This type of communication is called a contralateral connection. Most parts of the nervous system have this contralateral organization, where stuff on the left side of our vision first goes into the primary visual cortex of the right brain, physical sensations on the left hand first goes into the somatosensory cortex of the right brain, and so on. The opposite of contralateral is ipsilateral, and you would use this word to describe a part of the body that is on the same side as that half of the nervous system. For example, the right hand is ipsilateral to the right hemisphere of the spinal cord.
The PNS can be divided into three main branches:
1. Somatic nervous system
The somatic nervous system represents all the parts of the PNS that are involved with the outside environment, either in sensing the environment or acting on it. For example, the nerves that detect pressure or pain on the foot are part of the afferent somatic nervous system. We also think of the PNS as the branch that sends signals to our skeletal muscles. The nerves that innervate the muscles of the legs as we run are part of the efferent somatic nervous system. The somatic nervous system is also called the “voluntary nervous system” since it is used to cause muscle movement related to intentional actions.
2. Autonomic nervous system
The autonomic nervous system encompasses all the branches of the PNS that deal with the internal environment. As with the somatic nervous system, the autonomic nervous system is comprised of nerves that detect the internal state as well as nerves that influence the internal organs. The body carries out all sorts of functions and responses unconsciously without any intentional control. It can do so by sending signals to smooth muscles and glands. The signals that cause us to sweat when it is hot, our pupils to dilate when it is dark, and our blood pressure to adjust when we stand up too quickly are all driven by the nerves of the autonomic nervous system.
Imagine what would happen to your body if you, while walking through the quad, turned a corner and encountered a huge feral tiger, somehow set free from the Lincoln Park Zoo. You would notice a sudden fear response: your heart rate would skyrocket, you would start breathing more rapidly, and your body temperature might increase. Furthermore, your body will undergo additional reflexive responses that you might not even notice: your pupils will dilate, the bronchioles in your lungs will dilate, and your liver and kidneys will start to activate a variety of enzymes. All of these responses happen within seconds of seeing the tiger.
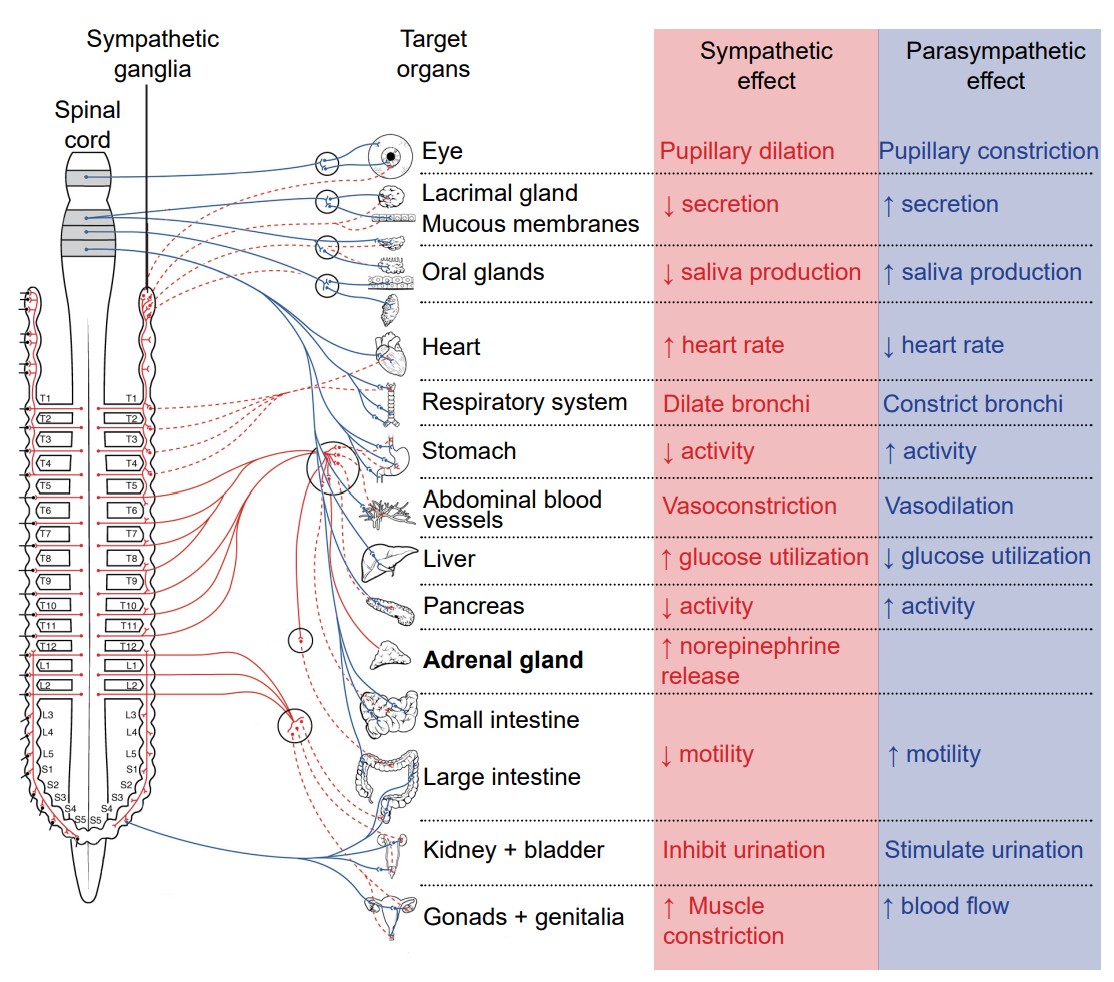
This set of physiological changes to a threat is sometimes called the response, which is driven by one of the two branches of the autonomic nervous system, the . The sympathetic nervous system activates when we are faced with a threat, either perceived or real. All of these rapid bodily responses result in the body preparing to attack or defend itself. Increased respiration allows the body to take in more oxygen, and dilation of blood vessels in the muscles allows that oxygen to get to the muscles, which is needed for muscle activation.
Now, consider a completely opposite scenario. You’ve just gorged yourself on a huge dinner of deep dish pizza, Italian beef sandwiches, bacon cheese fries, and tiramisu for dessert. You would probably feel relaxed, satisfied, and more than a little sluggish. A different physiological response is happening, a behavior called the . These physiological changes are driven by the other main branch of the autonomic nervous system, called the .
Both the sympathetic nervous system and parasympathetic nervous systems influence the internal organs simultaneously. At all times, the heart is getting signals from the sympathetic nervous system which increase heart rate, and signals from the parasympathetic nervous system which decreases heart rate. However, this seesaw-like balance can shift quickly in either direction, such as inducing a sympathetic response if a fearful stimulus is encountered, like the runaway tiger.
The sympathetic and parasympathetic nervous systems differ anatomically as well. The nerves that drive the sympathetic response branch off the spinal cord at the thoracic and lumbar levels, so sometimes we can use thoracolumbar to describe the site of origin. The nerves form a chain of many clumps of cells that run alongside the spinal cord, called the . On the other hand, parasympathetic drive originates predominantly from the brain, with some signals originating in the sacral areas. The parasympathetic nervous system usually receives signals from several cranial nerves. CN X, also called the , innervates multiple bodily organs in the midsection of the body (vagus comes from the same root word as vagrant, appropriate since this nerve wanders all around the body.)
3. Enteric nervous system
The internal organs that carry out digestive functions, such as the esophagus, stomach, and intestines, are surrounded by a dense mesh of neurons that regulate their activity. Consisting of half a billion nerve cells, this net of neurons cause the digestive tract to increase or decrease the rate of these processes depending on the body’s demands. The enteric nervous system receives signals from both the sympathetic and parasympathetic nervous systems, and functions without our conscious knowledge. Historically, these digestive functions have been classified as part of the autonomic nervous system, but these responses do not share the same reflex pathway, and the enteric signals can work entirely independent of the vagus nerve, for example.
Cranial nerves
Many sensory and motor nerves originate in the spinal cord, but there are 12 pairs of nerves that exit from the brain. These can control motor functions, carry out general or specialized sensory functions, or both. The cranial nerves usually deal with parts related to the head, but not exclusively
| Cranial Nerve | Function | Description |
| CN I Olfactory nerve | Sensory | Sense of smell |
| CN II Optic nerve | Sensory | Sense of vision |
| CN III Oculomotor nerve | Motor | Control of extraocular muscles which allow movement of eyeballs; constriction of pupils; changing of lens shape |
| CN IV Trochlear nerve | Motor | Control of the superior oblique muscle of the eye that moves the eyeball down and lateral |
| CN V Trigeminal nerve | Sensory + motor | Tactile and pain sensory information from the face and mouth; Control of muscles used in chewing |
| CN VI Abducens nerve | Motor | Control of the lateral rectus muscle of the eye that moves the eyeball outward laterally |
| CN VII Facial nerve | Sensory + motor | Control of the muscles that allow for facial expressions; Taste sensation on the anterior 2/3rds of the tongue |
| CN VIII Vestibulocochlear nerve | Sensory | Detection of sound information and head positional (vestibular) information |
| CN IX Glossopharyngeal nerve | Sensory + motor | Detection of somatic sensory in the middle ear and posterior 1/3rd of the tongue; Taste sensation on the posterior 1/3rd of the tongue; Controls the stylopharyngei muscle that allows swallowing |
| CN X Vagus nerve | Sensory + motor | Control of the internal organs by autonomic nervous system using parasympathetic activity |
| CN XI Accessory nerve | Motor | Control of the sternocleidomastoid and trapezius muscles of the neck and shoulders |
| CN XII Hypoglossal nerve | Motor | Control of the muscles of the tongue |
Support structures of the nervous system
Although we mostly think about nerve cells as being the main characters of the nervous system, there are many other anatomical features that play important supporting roles. These are often non-neuronal structures, but are still critically important in allowing the nervous system to do what it needs to do.
Brain circulation and cerebral blood flow
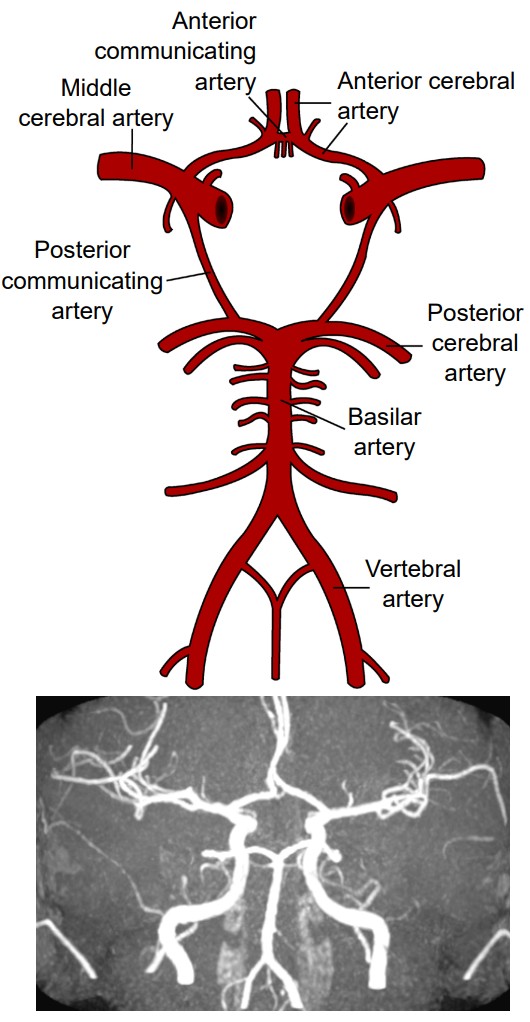
Like every other organ in the body, the brain requires oxygen and nutrients to function. In humans, this function is accomplished by the blood that is pumped around the body using a network of blood vessels called the circulatory system. The brain has a very high demand for oxygen and nutrients: at only 2% of total body weight, it receives about 15% of total cardiac output. Oxygenated blood moves anteriorly through the aorta into the brain via two different pairs of arteries, the vertebral arteries and the internal carotid arteries. The left and right vertebral arteries merge into a single basilar artery, and along with the left and right internal carotid arteries, feed into a loop-like circular blood vessel called the . According to one theory, the circle of Willis is an anatomical redundancy that allows an organism to maintain cerebral blood flow even if one part of the arterial system is narrowed or blocked. From here, the circle of Willis has paired “exit” arteries that distribute blood to different areas of the brain: the provide blood to dorsomedial cortical structures and deep brain structures, and the provide blood to the occipital lobe. The other major arteries are called the which branch off the internal carotid artery and deliver blood to the lateral cortices.
Clinical Connection: Stroke
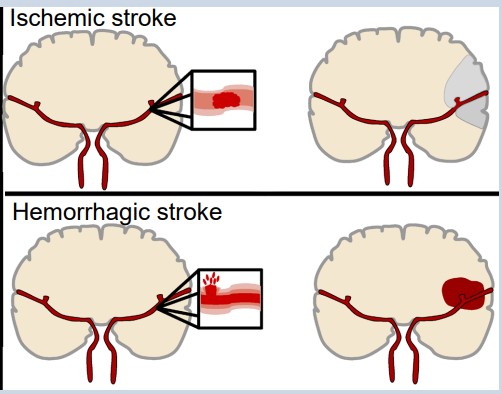
Stroke is an extremely common, life threatening medical condition that results in a loss of blood flow to the brain. According to 2016 statistics from the World Health Organization, stroke is the second highest cause of death worldwide. The number one risk factor for stroke is high blood pressure.
There are two common types of strokes that a person may experience. More than 80% of all strokes are (pronounced is-keemik), which happens when normal blood flow is interrupted, causing cell death by deprivation of brain tissue of oxygen and nutrients. Generally, this type of injury can happen when a blood clot forms, travels through the circulatory system and gets lodged in a tiny brain blood vessel, thus blocking the passage of blood.
The other 20% of strokes are , which results from a burst blood vessel that causes bleeding into the brain. The presence of uncontrolled blood inside the brain causes an increase in intracranial pressure, which can be lethal. Many brain cells may die since they cannot take up oxygen directly from the blood. Additionally, blood has dramatically different properties than the normal solution which the brain cells live in, and this can cause the neurons to trigger a self-destruction program. Generally, hemorrhagic stroke is more deadly than ischemic stroke.
Because the different blood vessels of the brain’s circulatory system are responsible for providing blood to specific areas of the brain, it is possible to diagnose the specific area where the stroke is happening based on the presentation of symptoms. For example, if the middle cerebral artery blood is occluded by an ischemic stroke, the left hemisphere motor cortex will lose blood flow. Because of the contralateral organization of the descending motor pathway, the patient may therefore present with paralysis or weakness in the right half of the body.
It is vitally important to correctly diagnose and differentiate between the two types of strokes. An ischemic stroke may be treated with injection of a “clot-busting” drug, a substance that helps the body break down the offending blockage. However, these clot-busters could make the bleeding from a hemorrhagic stroke even worse.
Blood-brain barrier (BBB)
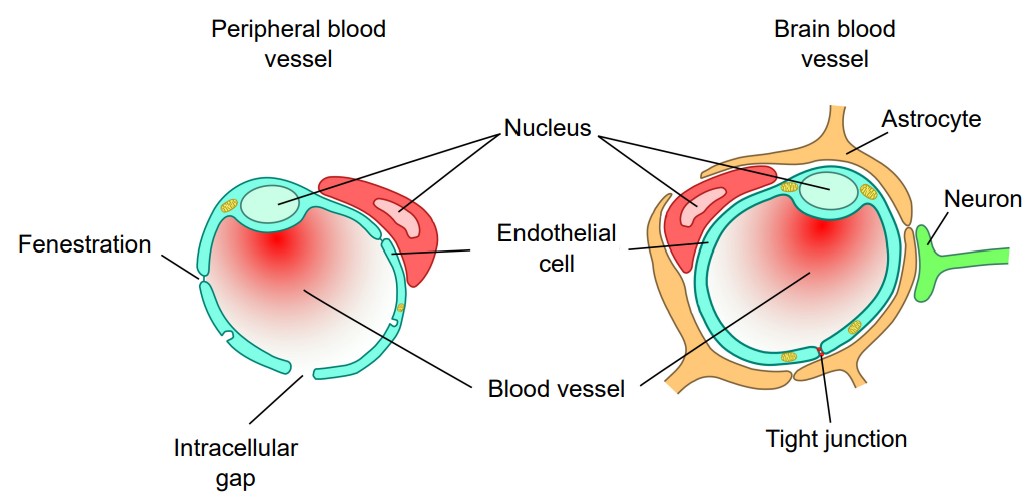
It is important for oxygen and nutrients to pass from the blood into the brain tissue. Small blood vessels outside of the brain, such as the capillaries in the fingertips, have very thin walls, sometimes the width of a single cell, and are therefore highly permeable to gases. These vessels can either contain tiny holes or large protein structures that physically transport substances across the blood vessel. On the other hand, it is also advantageous to separate toxins and foreign pathogens in the bloodstream from getting into brain tissue. The (BBB) is an anatomical adaptation that selectively transports substances necessary for normal biological function, while simultaneously excluding potentially harmful invaders from the brain. The BBB physically surrounds blood vessels in the brain. It is made up of endothelial cells and a type of glial cell called an . The BBB is injured in all variety of medical disorders, ranging from stroke, epilepsy, and Alzheimer’s disease, just to name a few. It is still unknown what role the disruption of the BBB plays in brain disorders.
The exclusive nature of the BBB can be a double-edged sword. It is difficult to deliver a drug into the brain from the blood stream if that drug is unable to pass through the BBB. For example, the current gold standard pharmaceutical treatment for Parkinson’s disease is to increase the brain’s levels of dopamine. However, dopamine does not pass through the BBB. To get around this, physicians give the BBB-permeable substance L-DOPA, which the brain is able to convert into dopamine. Many other therapeutic drugs do not cross the BBB, so researchers are developing methods using electromagnetic fields to temporarily weaken the barrier, or surround the drugs in nanoparticles, which are so small that the body cannot identify as foreign.
The ventricles and cerebrospinal fluid (CSF)
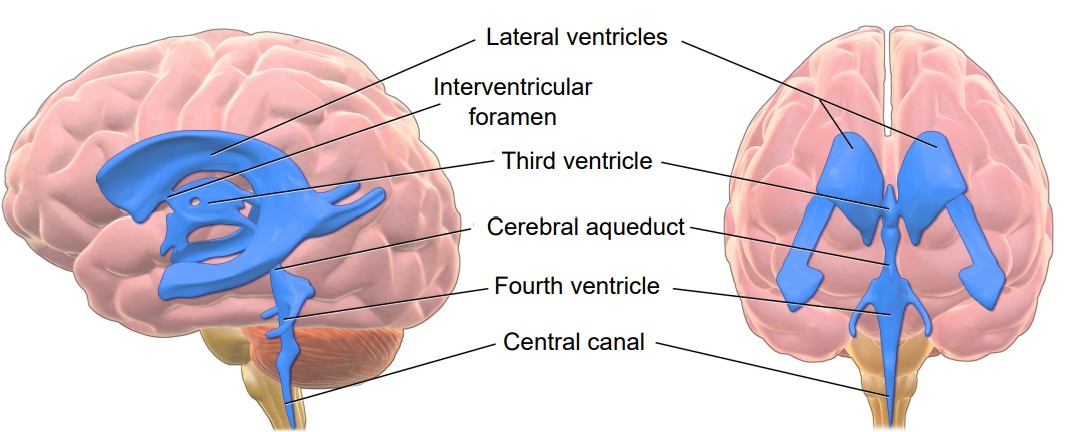
In a coronal section of the brain, it is very common to see large symmetrical “holes” near the medial aspect. These spaces are called . The human brain has a total of four ventricles in the brain. The two very large paired ventricles, one in each hemisphere, are the . They are connected medially into the , which extends to the posterior aspect of the brain. From here, an aqueduct that runs ventrally extends into the fourth ventricle before continuing into the , a narrow space that runs all the way through the length of the spinal cord along the midline. The entire ventricular system is entirely connected.
The ventricles are filled with a liquid called (CSF). CSF is basically a high salt water solution (sodium ions at 140 mM and chloride ions at 110 mM). Because of the high osmolarity of CSF, it is a very buoyant solution. Like a fully grown person who can float easily on the surface of the extremely salty Dead Sea, CSF allows the brain to remain “floating” inside the skull. Without CSF, the brain weighs almost 1.5 kg (~3 lbs). Cells and blood vessels at the ventral base of the brain would be crushed under the weight of the brain itself. But when the brain is surrounded by CSF, it weighs less than 50 grams, almost two orders of magnitude lighter!
CSF is also found in a tightly-regulated membranous sac called the (more about it below) that encases the brain. In fact, more than 80% of the CSF in the body exists in this space outside the brain. This liquid serves as a form of “cushioning” that protects the brain from rapid he ad movements. If it weren’t for this physical protection, the inertia of head movement may cause your brain to smash against the inside of the rigid skull if you move your head too quickly. The CSF layer allows the head to withstand some sloshing of the brain, but a movement that is too abrupt can cause a traumatic brain injury, a condition that we will return to in chapter 15.
CSF can also function as a way to wash impurities out of the brain. The volume of CSF in the typical human body is about 150 mLs, a little more than half a cup. Because there is frequent turnover of CSF, the material gets absorbed back into the body regularly. Each day, the body produces about half a liter of CSF, so the brain cycles through the entire volume a few times each day. Since the CSF is in close association with the neurons, cellular waste materials get dissolved into CSF, which can then be degraded and broken down outside of the brain.
Clinical correlation: Hydrocephalus
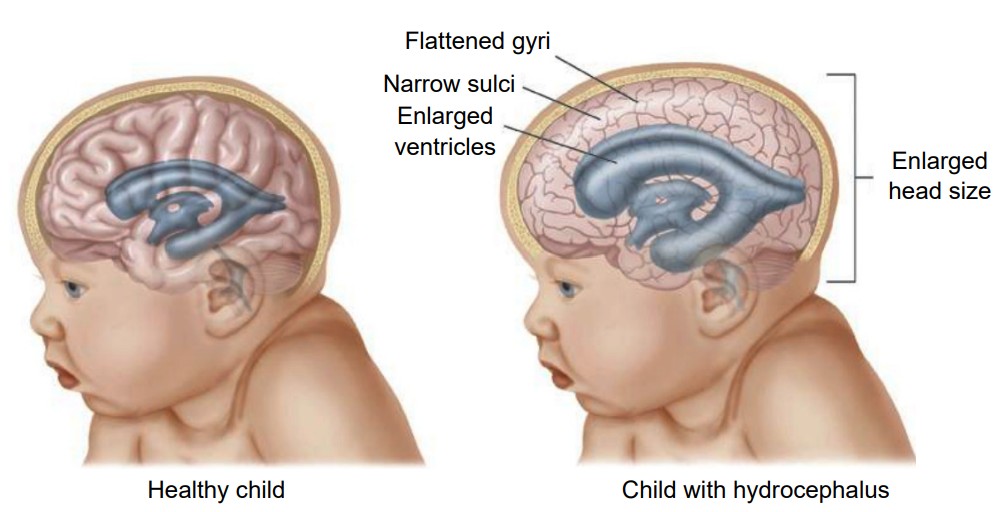
A common condition affecting the brain of about 1 in 200 newborns and a small number of adults is hydrocephalus, historically called “water on the brain.” In patients with hydrocephalus, the volume of CSF increases, which elevates intracranial pressure, causing symptoms such as fever, stiff neck, headache, seizures, or altered mental status. In adults, the skull is rigid and unmoving. But in newborns with hydrocephalus, the plates of the skull are not completely fused together. Often, these children will have a bulging parts on the skull and an expansion of the forehead. Increased CSF volume can happen in a couple ways. The clearance of CSF may fail while production remains normal, or the entrance to the central canal in the spinal cord may be narrowed or blocked by a tumor, leading to an increase in the volume in the brain. A common treatment for hydrocephalus is to surgically implant a shunt, which is a hollow tube that runs from the ventricle down into the abdominal space, which allows for drainage thus decreasing intracranial pressure.
Meninges
The brain is a squishy internal organ housed inside the skull. If there weren’t some protective buffer separating the soft brain matter from the rigid bone, the jelly-like brain would be smashed up against the inside of the skull and get injured as the head moves around. The meninges are a series of protective membranes that minimize this kind of damage. They surround the brain and extend all the way down the spinal cord. Think of the meninges as an organic type of “bubble wrap” that encases a fragile nervous system.
There are three types of membranes that collectively make up the meninges. From the outside-most layer to the innermost, they are:
1. . The dura is made of thick, fibrous material, and can get to be 0.8 mm thick in the adult body (if you took a piece of printer paper and fold it in half four times, that should give you an idea of how thick the dura mater is in the adult human). The dura mater is physically attached to the inside of the skull with highly resilient connections found at the sutures between the plates of the cranium. The name originates from Latin meaning tough mother.
2. . The arachnoid mater is the middle layer of the meninges. The fibers are very delicate and resemble a spider web, which is where the name comes from. Within this space, there are protrusions that allow for CSF to drain into sinuses, which allow for recycling of soluble substances. Most of the CSF in the brain exists underneath this layer in the subarachnoid space.
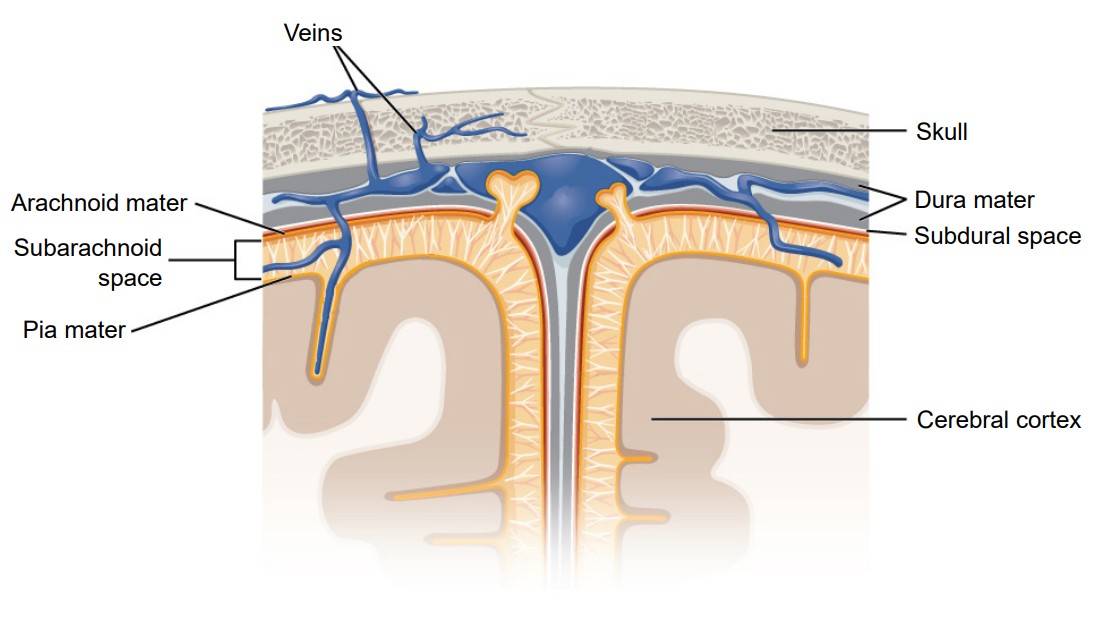
3. . The pia mater is the third layer of the meninges. It is very fragile and in direct contact with the surface of the brain, and closely follows the sulci and gyri. The name means pious mother.
Clinical correlation: Meningitis
Inflammation of the meninges is a potentially deadly condition called meningitis. Exposure to infectious agents like viruses or bacteria such as Neisseria meningitidis that leaks from the blood into the meninges is a common cause of the inflammation. When the meninges are inflamed, the brain gets compressed from all sides, increasing intracranial pressure, producing many of the same symptoms seen in hydrocephalus: fever, stiff neck, headache, seizures, and altered mental status. The N. meningitidis bacteria and the viruses are highly transmissible in close contact, but vaccinations are highly effective at minimizing the infection rate. As with bacterial infections, broad-spectrum antibiotics are effective at treating the infection.
Chapter 6: Methods of Neuroscience
Most of the information you learn in neuroscience textbooks were discovered by people who applied the scientific method to systematically answer a research question. In order to come to their conclusions, these neuroscientists used a variety of techniques, borrowed from biology, medicine, chemistry, physics, engineering, psychology, and many other academic disciplines. Neuroscience researchers use the wide range of scientific methodological strategies to answer: “How does the nervous system work?”
In this chapter, we will describe a few of the methods that are used to ask and answer questions in neuroscience. These methods can be divided roughly into four major categories: Imaging anatomy, imaging function, imaging cells, and finally manipulating the nervous system. Within each of these categories, the techniques will start with the “big picture” view, and by the end of each section we zoom down to the level of molecules and genes.
Just a minor caveat about these techniques. Many of these strategies can be used independently, but some may be used simultaneously.

There are three major components that can be described for some of the techniques:
1. A description of how the method works. Each of these methodological strategies rely on using the knowledge from other fields of study and applying that knowledge to a question about the nervous system. Knowing how the methods work allow us to decide what types of data can be collected and when each method will be appropriate to use.
2. Some of the main advantages of the technique. Not every method is applicable for studying every question. Instead, it would be beneficial for neuroscientists to choose the most appropriate strategy for a particular research question given the circumstances.
3. Some shortcomings or limitations of the technique. As above, no strategy is perfect. Methods that look at the “big picture” aren’t able to look at microscopic level detail. There are limitations for every technique and being aware of these limitations inform us about caveats in interpreting data.
Although almost all these techniques can be used in either humans or non-humans, some techniques are best adapted for humans and others for non-humans. Using a technique on a inappropriate species can lead to poor results. For example, humans can lay still for tens of minutes at a time during an imaging scan session, while rats or mice will not be able to do this simple behavior (without restraint or anesthesia). Before getting started with our list of research methods, we should ask ourselves “Is it better to study the question in humans or in non-human animals?”
About resolution
Many of the imaging techniques are concerned with resolution. Resolution in neuroscience is very similar to resolution in digital photography or computer monitors. A picture taken in high resolution contains more information than one in low resolution, and can therefore be more valuable. Imaging strategies consider two different types of resolution, spatial and temporal.
refers to the ability to differentiate two points in space from each other. An imaging method with high spatial resolution means that two signals very close together can be identified as two different signals instead of one. Spatial resolution is usually measured in units of distance or volume. Electron microscopy (described in 6.3.1) offers the highest spatial resolution of the imaging techniques.

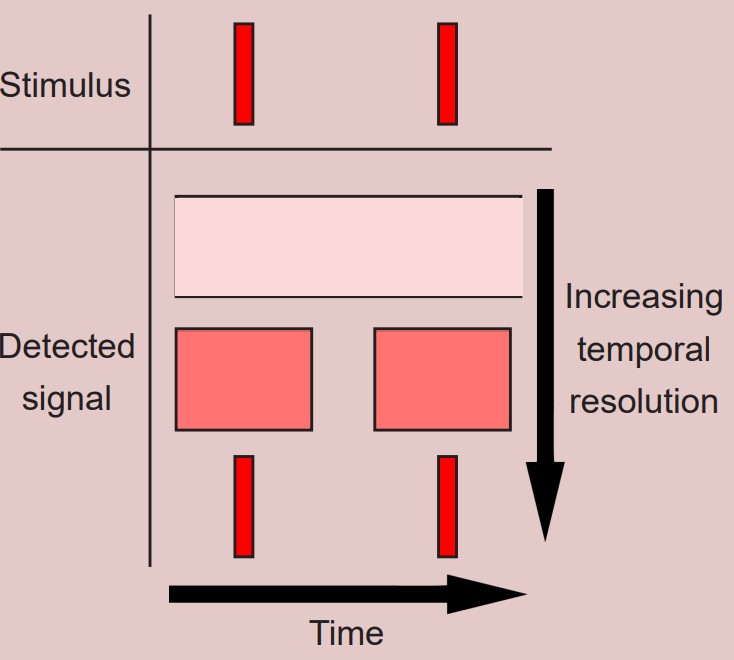
refers to the ability to distinguish two events in time from one another. Temporal resolution is measured in units of time. Functional imaging techniques with high temporal resolution, such as electrophysiology, can differentiate two signals as close together in the hundreds of microseconds range.
The case for human subjects
The main reason we conduct studies in humans is to understand the human nervous system. It is knowledge of the human condition that leads to the development of therapies that prevent, cure, or otherwise improve the quality of patient’s lives. And while curing diseases in non-human animals is the purpose of veterinary medicine, curing humans is the primary end goal of biomedical research, and that goal is only truly met by testing on humans. A cure developed for rodents might give us a clue about the human case, but without seeing how well it works in humans, the therapy won’t save human lives.
Humans are great at following directions without much training, unlike non-humans – as anyone who had tried to house train a puppy can attest. We can follow simple sets of directions that untrained non-humans find difficult, such as “lie still”. During functional activity scans, we can perform extremely complex higher-order cognitive tasks, such as “imagine that we give you 20 dollars, and we will take away a dollar when you answer a question incorrectly” (rats and chimpanzees have no concept of currency). We can describe our feelings in writing and self-report on our symptoms, both of which are tasks that are impossible in non-humans.
Believe it or not, recruiting human subjects for neuroscience or psychology studies is usually cheaper than studying that same question in nonhuman animal models. Collecting data from undergraduates is sometimes free, since many are required to participate in some number of hours of psychology studies to pass introductory level classes. Although the cost per patient differs depending on the nature of the study, many patients get paid as little as $10 an hour. On the other hand, housing colonies of mice, rats, or monkeys gets very expensive, very quickly.
The case for non-human subjects
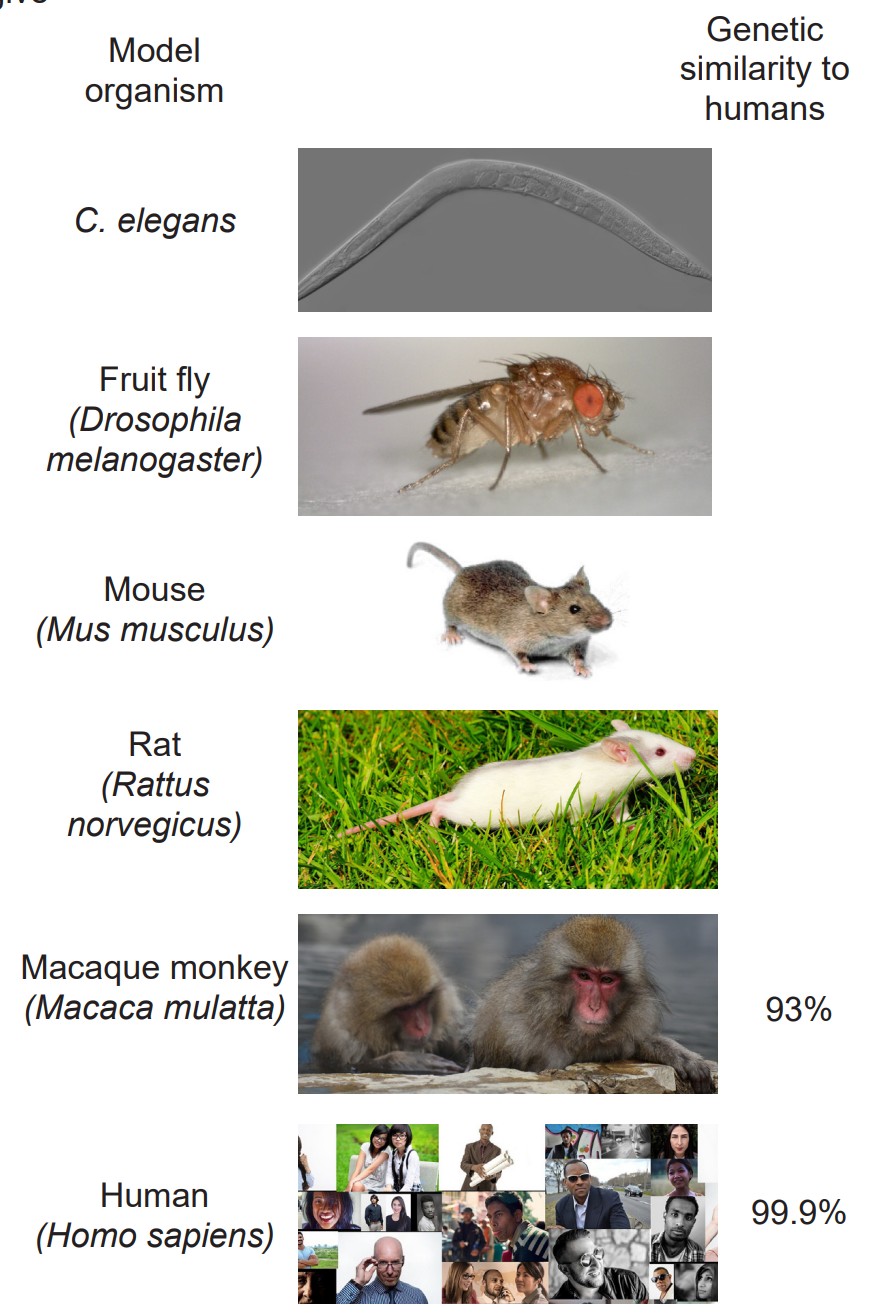
But, it is often impossible to test every question in humans. Instead of always studying humans, scientists often use , the most common organisms being the worm C. elegans, fruit flies (Drosophila melanogaster), zebrafish (Danio rerio), song birds, mice, rats, and macaque monkeys. The closer we move towards the human, the more similarities the model organism shares with us. Of the commonly used model organisms, macaque monkeys are the non-humans that are most similar to humans. We share 93% of our genetic material with macaques, but we still have different metabolic and physiological processes, and our behaviors in vivo Increasing control over variables Decreasing ability to predict therapeutic potential Decreasing strictness of ethical regulations ex vivo in vitro are much different from theirs.
Ethical constraints prevent us from performing experiments that may cause physical or psychological harm if performed in humans. We would never conduct a test on humans to assess what concentration of neurotoxin leads to brain damage (these experiments aren’t done very frequently in nonhumans anyway.) Invertebrates, such as worms and fruit flies are not heavily regulated by ethics oversight committees, allowing scientists to conduct a wider set of experiments on these animals.
Experimental preparations
Performing an experiment in an intact, living organism, whether human or nonhuman, is described as an in vivo (Latin meaning “within life”) preparation. The main strength of this strategy is that the data collected here are more predictive of the human condition, which is one of the main goals of biomedical research. However, the in vivo preparation has challenges, because thousands of variables within a living system are uncontrolled or still unknown. There are also very strict ethical limitations on the nature of experiments that can be done in vivo.
On the other hand, an (Latin meaning “within glass”) preparation is an experiment performed on cultured cells or isolated molecules of DNA, RNA, or protein. These preparations have the opposite strengths and weaknesses of in vivo preparations. They allow for extremely good control over variables, but the results are less reliable in translating to a therapy. The regulations on these experiments are much more lax compared to in vivo experiments; most of the regulatory guidelines are to protect the experimenter rather than the patient or the experimental subject.
Falling in between these two preparations is an experiment. In this kind of experiment, a section of the living organism is taken, such as a slice of brain, a tissue biopsy, or a detached frog leg. The strengths and limitations of these experiments are somewhere in between that of the other two preparations.

Nonhuman animals perform all kinds of behaviors that humans never experience. These behaviors are unique to nonhumans and can only be studied in nonhumans of course. We will never be able to understand flying (birds) or slithering (snakes) as a means of locomotion by studying humans.
One thing that makes human studies difficult is how weird we are. We all come from very different backgrounds, bringing our own set of experiences, flaws, and biases into every research study. Your current mood and mind state can alter behaviors profoundly – just ask any one who gets “hangry.” In nonhuman studies, many of these variables are closely monitored. When we raise model organisms in the lab, almost every aspect of their life is controlled, from their food source, living conditions, and their daynight cycles, which eliminates several sources of variability that affect human studies.
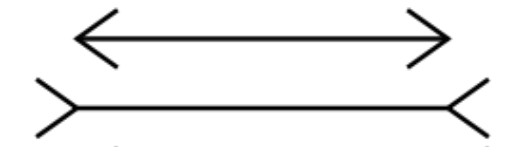
Another factor that makes human studies challenging is that we are WEIRD: The acronym meaning that most patients in psychology studies are Western, Educated, and from Industrialized, Rich, and Democratic countries. One study estimates that about 96% of psychology studies use WEIRD subjects, whereas these people are only 12% of the total global population. This creates a bias in sample selection, since WEIRD people perform differently on behavioral tasks compared to others. Even our susceptibility to visual illusions is affected by our WEIRD-ness.
6.1 Imaging brain activity
The earliest methods of analyzing nervous system anatomy were crude: manual dissection of the brain post-mortem (after death). In the 1860s, these methods received attention clinically with the studies conducted by French neurologist and surgeon Paul Broca. One of Broca’s patients, nicknamed “Patient Tan,” had severe language deficits and was only able to say “tan.” Broca performed an autopsy after Patient Tan died, and observed a very localized injury in his brain that was likely the cause of Tan’s language deficits.
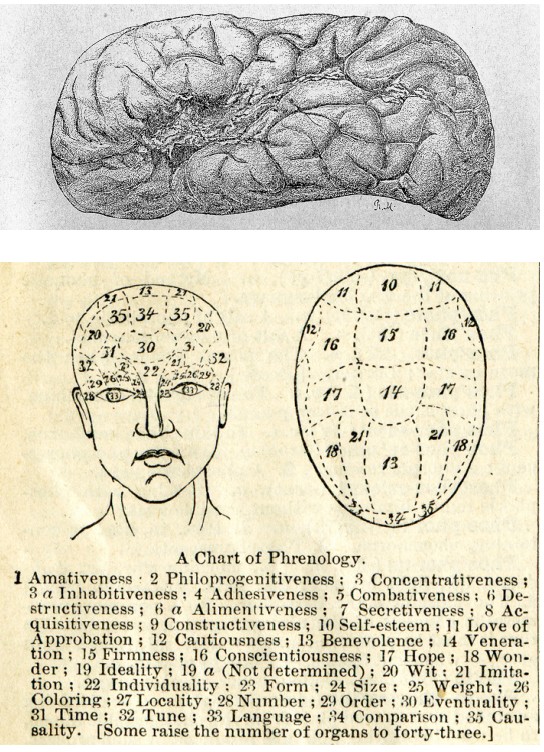
At the same time, a pseudoscientific fad was gaining in popularity. Franz Gall, a German neuroanatomist, published a treatise describing , the belief that we can predict personality traits based on the shape of a person’s head and the bumps on the outside of the skull. According to Gall, behaviors such as romanticism, individuality, and cautiousness are a result of differences in brain anatomy that push the skull outwards.
Today, we know that phrenology is a fad unsupported by the rigorous methodology of science. But there was a valuable lesson that emerged from phrenology which still persists in part today. Both phrenology and Broca’s observation support , the idea that specific areas of the brain are important for certain functions. Today, we also think about the connections between two areas as being important for healthy brain activity. The techniques discussed below were developed to allow scientists to see some aspect of the anatomy of the nervous system, either gross anatomical differences or connectivity.
6.1.1 Computerized tomography scan (CT scan or CAT scan)
Example questions answered:
“Does the patient have a brain tumor, and where is the brain tumor located?”
“Are the meninges intact?”
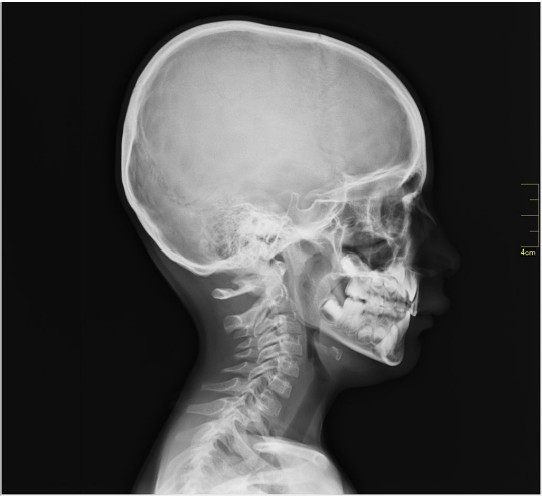
The CT scan relies on X-ray technology that was developed in 1895. X-rays are high energy beams of electromagnetic radiation that are capable of passing through many physical objects. Traditional two-dimensional X-rays, such as those used to image a broken bone or tooth decay, use radiographic film to detect where the X-rays get blocked. When an X-ray passes unimpeded, it causes the film to darken. But, wherever the X-rays are blocked, the film remains white. Therefore, material that is more dense (such as bone) appears as white, less dense material (such as the air surrounding the body or CSF) appears dark. Other tissue are some shade of gray in between.
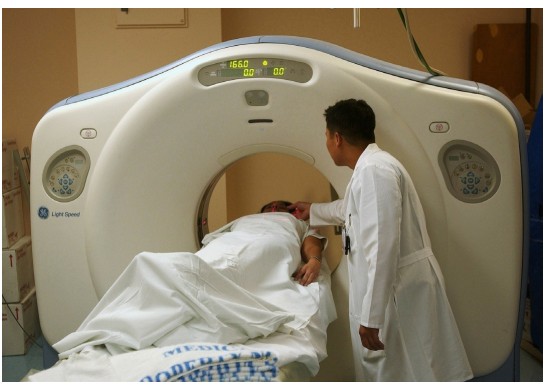
The is essentially a three-dimensional X-ray that revolves around the person as they move through the scanner. Instead of using radiographic film, the CT scan uses a computer that detects the passage of X-rays, located directly across the emission source of the X-ray. Instead of a flat, two dimensional-image, the CT scan uses an X-ray gun that revolves around the person’s body as they advance slowly through a large circular hole. The computer is then able to compile the series of two-dimensional images and turn them into a three dimensional reconstruction that can be used to see the brain from any projection. CT scans give us a spatial resolution of about 0.5 mm. CT scans are generally used clinically to assess diagnostic changes over several days (such as before and after tumor removal or to determine if an intracranial bleed has healed), so temporal resolution is not a major consideration.
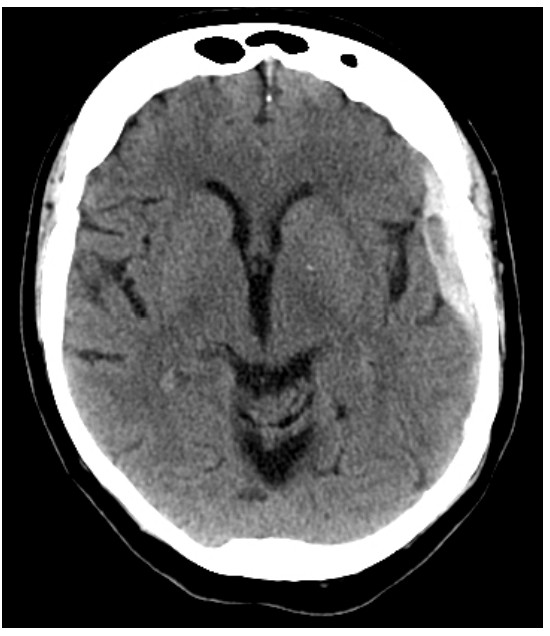
As an anatomical analysis that can easily identify tissues of different density, it is great for identifying and diagnosing particular brain conditions. Brain tumors can be visualized in a CT scan, since they are identified by an increase in tissue density compared to normal brain tissue. Hydrocephalus, an abnormal and potentially deadly expansion of the CSF-filled ventricles, can be quickly identified by this analysis. Meningitis, an inflammation of the meninges, may present as increased contrast in the CT scan.
The big advantage of the CT scan is that it is noninvasive. You can use a CT scan in order to diagnose and identify the cause of a condition while a person is still alive, and hopefully work towards developing an intervention.
It is also a relatively quick technique. A full head CT scan takes only minutes, which allows for a rapid diagnosis of anatomical structures.
However, X-rays are highly mutagenic. Prolonged exposure to X-rays dramatically increases the risk of developing various cancers, since X-rays interfere with the process of DNA replication. It is estimated that the radiation exposure in a single head CT scan is similar to the background exposure of X-rays in a few months. When a CT scan is prescribed, the diagnostic information gained from a CT scan is more important than the risks from increased radiation exposure.
6.1.2 Diffusion tensor imaging (DTI)
Example questions answered:
“Is the volume of the white matter tract medial longitudinal fasciculus important for normal language processing?”
“Does spinal cord compression cause neurological deficits?”
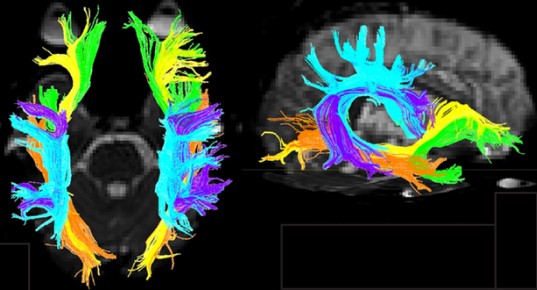
While a CT scan is great for detecting gross anatomical anomalies like tumors or intracranial bleeding, it has a difficult time with subtle anatomical changes like differences between gray matter and white matter tracts. A technique for identifying these differences was proposed in 1994, called .
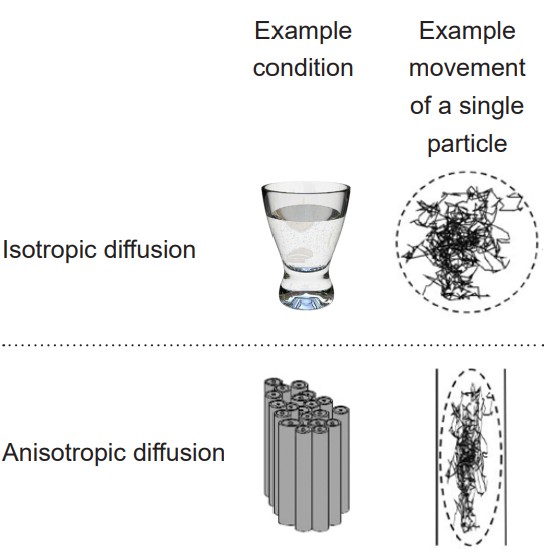
DTI quantifies white matter because of the morphological features of white matter. More specifically, DTI uses MRI technology (see section 6.2.3 for more information) to detect and quantify the movement of water molecules, which moves differently in gray matter than white matter. A single molecule of water in the middle of a cup can move in any direction with equal probability. This type of motion is called . However, the movement of a water molecule in biological tissue is not completely random, largely because the brain is made up of heterogeneous tissue. White matter is very different from gray matter. A water molecule is more easily able to diffuse along the same direction as a tract of white matter, but has a difficult time moving perpendicularly across such tissue. The difference in molecular motion is called . DTI uses the premise that anisotropic diffusion is observed in white matter tracts.
DTI can give spatial resolution on the order of millimeters. It is generally not used for monitoring changes over time, so temporal resolution is not a major consideration.
Axonal projections are directional, with the soma at one end and the axon terminal at the other. One of the shortcomings of DTI is that it cannot give us information about the directionality of the axonal projections.
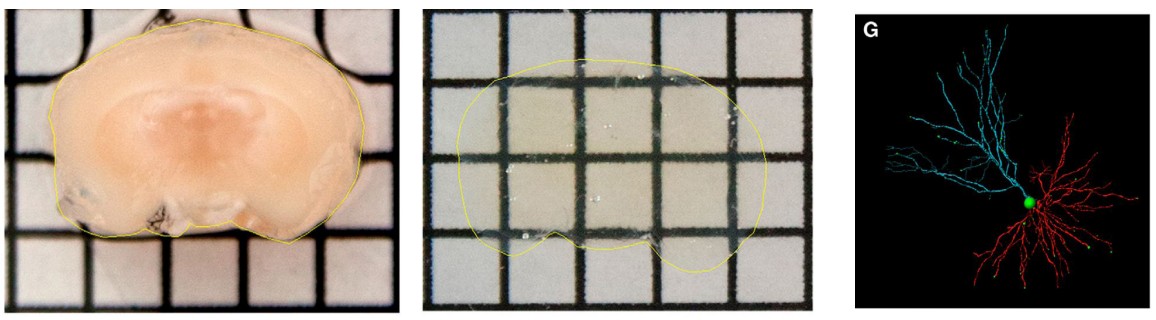
6.1.3 CLARITY
Example questions answered:
“Do neurons in layer 5 of motor cortex send axonal projections into the spinal cord?”
The methods described above only provide rough anatomical information, and therefore have limits to their value. CLARITY is a revolutionary anatomical technique that gives microscopic level analysis. First published in 2013, CLARITY was developed at Stanford by the lab of Dr. Karl Deisseroth. The value behind CLARITY is that we are now able to visualize connectivity in the brain at a microscopic level, giving us amazing spatial resolution at the order of a microns.
One of the problems with visualizing the structures of the brain at a microscopic scale is that cells have a lot of membrane, which is mostly made up of lipids. Instead of letting light pass unimpeded, lipids refract light in somewhat unpredictable ways. Even cytosol has all sorts of particles floating around in it that cause light to bend and bounce around. These lipids and other cellular particles prevent light from passing through nervous tissue, minimizing our ability to use transmitted light to see the brain.
In CLARITY, the brain is first flushed with chemicals that form a gel matrix that surrounds every cellular structural component, from the spines on the dendritic arbor all the way to the axonal terminals. Then, using a chemical detergent, the cellular lipids get solubilized and washed away while the gel matrix remains unaffected. This allows us to now see the “mold” that remains around where the cell membranes used to be. By washing away the light-deflecting lipids, we can now see where the connections were, causing the brain to appear transparent.
Unlike the CT scan, CLARITY can’t be applied in an intact living organism. CLARITY is an extremely destructive process that destroys tissue. The surrounding gel matrix is like a mold of a hand. You can see all the anatomical features of the hands – fingers, wrinkles, nails, and so on. But the mold is just an image, unable to function. The mold of the hand cannot grip things, cannot feel things, and does not have any bones / tendons / muscles. In using CLARITY, all function is destroyed.
6.2 Imaging brain function
Anatomical analyses are certainly a meaningful way to study aspects of the nervous system. But being able to measure and record brain function is important for answering different types of questions. After all, the brain of a recently deceased person might look identical anatomically to that of a living person, but they would exhibit significantly less function.
6.2.1 Electroencephalography (EEG)
Example questions answered:
“At what times of the night does the sleeping brain exhibit synchronized neuronal activity?”
“How does brain activity change when a person is having a seizure?”
The is one method by which we can observe electrical activity of the brain. When neurons send action potentials, several charged ions move across cell membranes, which causes a change in the electrical charge of the adjacent area. Some of these charges are very large, especially when several millions of neurons are sending action potentials at the same time. These currents produced by neurons of the outer surface of the brain (cortex) can be so large, that they are detectable outside the skull at the surface of the head. The EEG works by recording these changes at different areas of the brain. The technique was first used in the 1920s by psychiatrist Hans Berger, who invented the technique. The theory behind the EEG is the same used in an electrocardiogram, or ECG, to detect the electrical activity of heart cells.
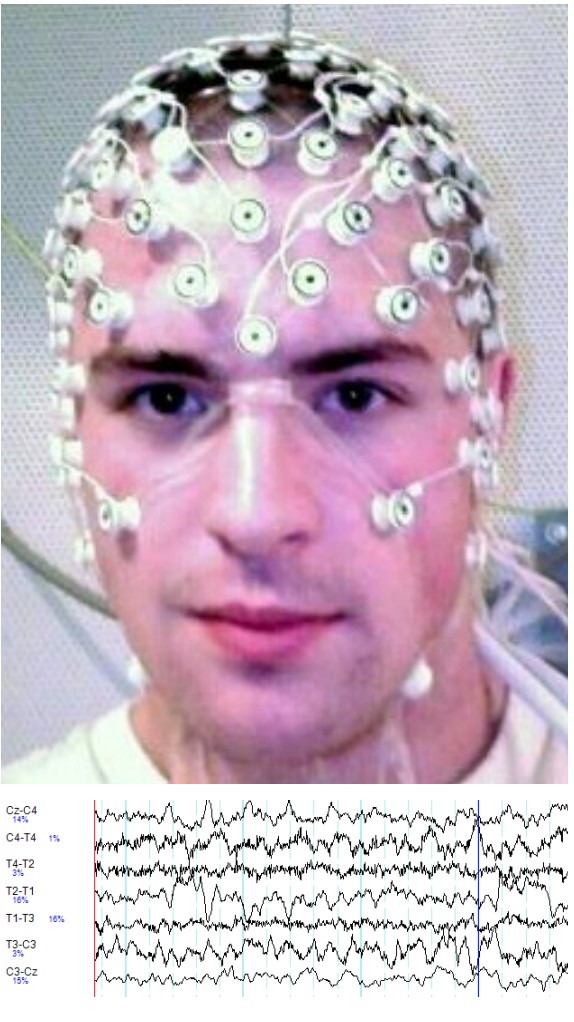
To perform an EEG, a gel is applied onto small patches of the scalp. This gel is basically a sodium chloride gel that acts as a conductor, allowing the currents to be picked up by a series of adhesive electrodes. EEG systems used in Downloaded from www.austinlim.com Open Neuroscience Initiative Downloaded from www.austinlim.com 6-13 hospitals for diagnosis or in laboratories for research studies may have anywhere between 20 to 128 electrodes. Each electrode is sensitive enough to detect voltage deflections as small as 10 microvolts. Each electrode is placed on a specific area of the scalp, and the information from each electrode runs into a computer. From there, the computer can then perform calculations to determine which cortical areas to the brain exhibit what patterns of activity.
EEG software is capable of examining the rapidly-fluctuating electrical potentials and dissecting out the several components buried within the complex signals. From one waveform, it can pick out high frequency components called beta waves (between 13 and 30 Hz), low frequency components called delta waves (between 0 and 4 Hz), and all frequencies in between.
The EEG is a noninvasive functional analysis method. Nothing permanent is done to the person when they get an EEG because it is only detecting information. Wearing a cap of electrodes may be annoying, but it is a harmless procedure. Because of the experimental set up for EEG, there are many cases where using an EEG is preferable. The EEG is a standard part of a polysomnogram, a series of tests that can be done to evaluate sleep disorders. In fact, our best and most reliable characterization of the phases of sleep rely on brain activity measures as recorded by an EEG (Chapter 13). Relatedly, EEGs are also used clinically when a person is under anesthesia as a tool to evaluate their level of unconsciousness.
Not only is the EEG noninvasive, but it is also relatively cheap – at least in comparison to many of the other methods described in this chapter. It does not require heavy equipment and is mobile. All the machinery needed to run an EEG can be contained within a backpack.
EEG is also useful for the diagnosis of a variety of brain disorders that are a result of aberrant cortical neural activity. The most well known of these is epilepsy. In epilepsy, when a person has a seizure, it is believed that large masses of neurons are sending action potentials across the cortex, producing very large signals that can be detected by scalp electrodes. Migraine, a debilitating condition, may be due to waves of unusual neural activity that sweep across the cortex. Other applications of EEG may include helping diagnose Alzheimer’s disease, depression, and possibly ADHD.
The EEG has great temporal resolution. Because it is detecting changes in currents, it is capable of sampling in the range of 10,000 Hz, meaning that for each electrode, 10,000 data points can be collected per second. Since action potentials happen on the time scale of milliseconds, being able to calculate changes in electrical potentials at such speeds gives us the ability to assess brain activity very precisely.
But, the EEG has poor spatial resolution, only detecting signals that originate in the outer most layer of the brain. More electrodes increase spatial resolution, but even at 128 electrodes, an EEG only has spatial resolution to the level of about 7 cubic centimeters.
6.2.2 Positron emission tomography (PET scan)
Example questions answered:
“Which areas of the brain decrease in activity when a person experiences mild cognitive impairment?”
“Do drug-dependent people have a high density of opioid receptors?”

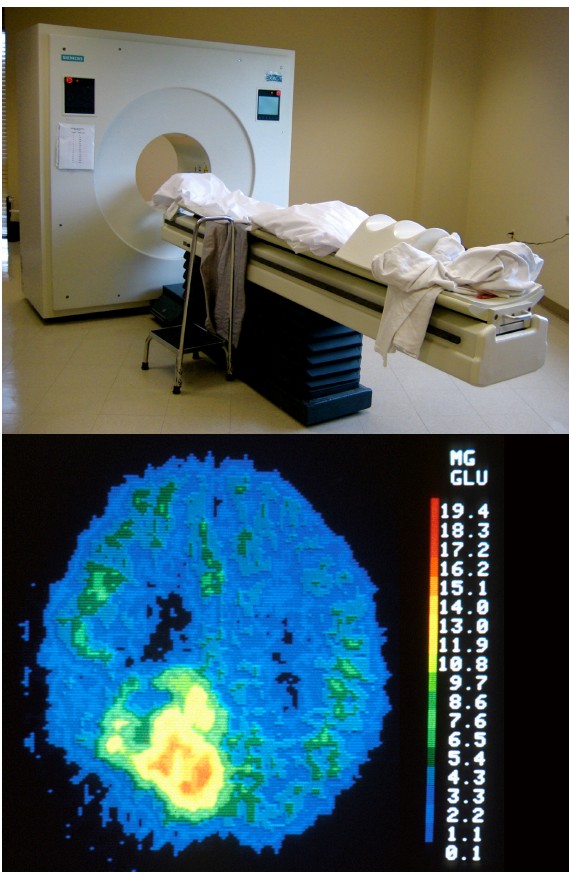
The scan is an application of nuclear medicine best known for its applications in the medical setting for the diagnosis of cancer. Before the PET scan, a radioactive compound called a is injected into the bloodstream. This tracer is a compound where an atom is substituted with a radioactive isotope, such as tritiated hydrogen (3 H) or fluorine-18. The PET scanner itself is a large circular device that looks similar to the CT scanner. The tracer is chemically unstable, and it spontaneously emits positrons. When those positrons interact with the electrons of nearby molecules, two gamma particles are emitted in perpendicular directions. These gamma particles are then detected by the PET scanner as the person moves through the machine.
A common tracer that is used for imaging brain function is , or . FDG is a radioactive analog of glucose, one of the main sources of cellular energy. Highly metabolically active areas of the body take FDG into the cells. Energetically demanding areas of the brain require more energy to do their functions (the same reasons that tumors, rapidly-reproducing patches of tissue, appear very bright in PET scan analyses). In order to produce the energy needed for increased neuronal activity, the brain changes perfusion levels by dilating blood vessels in order to bring more glucose to those areas. Therefore, when an area of the brain increases in energetic demand, that change can be detected by identifying the increase in glucose movement.
PET scans can be effective at diagnosing and identifying the location of tumors in the nervous system. It also provides an overall picture of brain activity, which may be useful in diagnosing disorders of cognitive deficits, like dementia associated with Alzheimer’s disease or Pick’s disease. PET scans have also been used to image the activity of specific brain areas as a person performs behavioral tasks, but this use of PET scan has largely been replaced by functional magnetic resonance imaging (fMRI; see section 6.2.3).
A second application of PET scanning is to visualize levels of receptors in vivo. This experimental approach relies on the nature of the interaction between specific radioactivelylabeled compounds and receptors (such as [11C] raclopride and dopamine receptors, or [18F] ASEM and acetylcholine receptors). Once the radiolabeled compound binds to the receptor, the PET scan is able to detect the location of the radioactive signal and the strength of that signal.
The downside of the PET scan as a diagnostic tool is similar to a limitation of the CT scan. A person is exposed to radioactive compounds and gamma wave radiation, which are potentially mutagenic.
In images produced by a PET scan, it is often difficult to identify boundaries between tissue, even between dramatically different internal organs. To make up for this deficit, PET scans are frequently performed simultaneously with an anatomical analysis like a CT scan.
PET scans generally have very poor spatial and temporal resolution. With PET scanning, you can really only see differences between areas if the volume is in the range of 5-10 cm3 . Anything smaller than a cubic centimeter will be impossible to detect with current PET scanners. As to the speed of the PET signal, it often takes tens of seconds or minutes before a change in signal can be observed and detected.
6.2.3 Functional magnetic resonance imaging (fMRI)
Example questions answered:
“Do neurons in the right hemisphere cingulate gyrus increase in activity when a person sees their loved ones?”
“Which areas of the brain change in activity when a person is planning a motor action?”
The functional magnetic resonance imaging (fMRI) technique is probably the most well-known method of studying brain activity. Because fMRI can be performed while a person is engaged in a task, many research studies use fMRI as a means to correlate behavior with activity patterns in specific parts of the brain.
An fMRI machine basically consists of two main components. As with the CT scan or PET scan described above, the fMRI machine is a circular tunnel through which a person on a table moves. As the person moves through the scanner, an extremely powerful magnet revolves around their head. The power of a typical magnet used in a hospital fMRI may be as powerful as 10,000 gauss (1 Tesla), strong enough to lift a car. The more powerful fMRI machines can be as powerful as 100,000 gauss (10 Tesla). The stronger the magnets, the better the spatial resolution that the machine can produce (our current best spatial resolution is on the order of millimeters). The second component is a device that emits radio waves. Just like the magnet, the radio emission device revolves around the head.
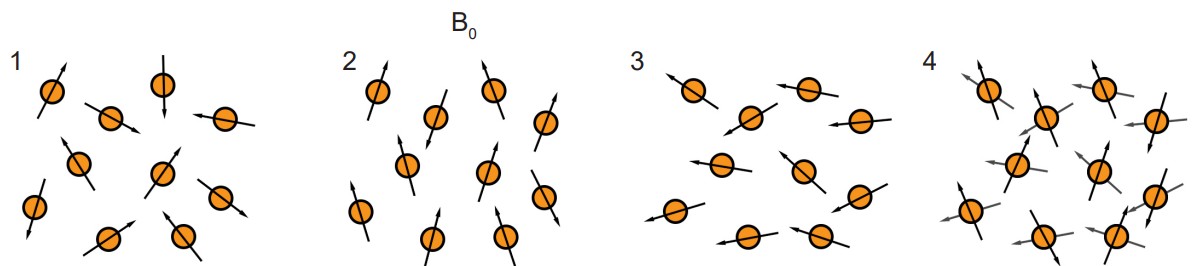
Both the magnetic field and the radio waves are crucial for the fMRI to work. They both interact with protons, the charged subatomic particles that have a small polarized direction because they spin around an axis. Initially, when these protons enter into a strong magnetic field, each proton charge aligns either with or directly against the direction of the field. Then, when hit by a radio wave, the protons lose their alignment, going into a high energy state. The protons then fall back to a low energy state as they return to alignment with the magnetic field. This process is what is being detected by the fMRI.
As it turns out, the protons in oxygenated hemoglobin are sensitive to the magnetic field (diamagnetic) while deoxygenated hemoglobin is not (paramagnetic). Because of this difference, we are able to use sensitivity to a magnetic field as a measure of changes in oxygenation levels. Like the PET scan, the fMRI hinges on the idea that more active areas of the brain have different metabolic demands than less active areas of the brain. When there is more activity in one area of the brain, the neurons in that area need more oxygen, and the adjacent blood vessels react by dilating. This change in blood flow is detected by the fMRI, and is called the , or . Temporal resolution of the fMRI is limited by the speed of blood vessel dilation, which occurs on the order of seconds to tens of seconds.
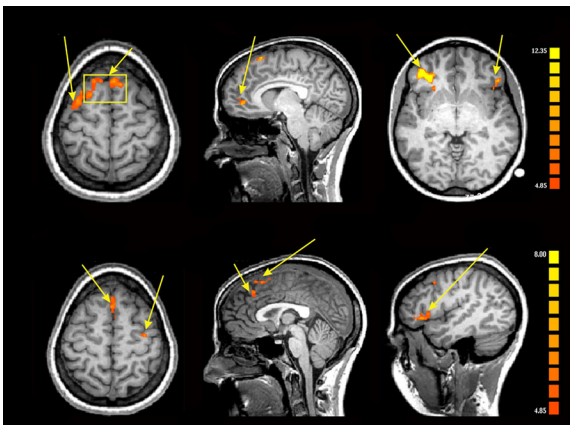
The main reason fMRI is useful in so many research applications is that you are able to visualize brain activity real-time during the performance of complex behavioral tasks. You can present specific visual stimuli to a person in an fMRI scan and evaluate which parts of the brain changes in activity. For example, seeing pictures of faces causes increased blood flow into the fusiform face area. You can ask a person to perform a gambling task and evaluate the areas of the prefrontal lobe that are responsive to risk taking.
Although the technique has a great capacity for analyzing brain function, the nature of the machine itself presents limitations. The scanning tunnel is very small and claustrophobic, making it difficult to safely study anxiety or panic disorder without endangering the patient. The machine can also be very loud, which is not trivial if you are interested in studying younger patients. The use of a tremendously powerful magnetic field presents a different set of limitations. At the risk of severe injury or death, the patient entering the scanner cannot have any magnetosensitive implants, such as metallic aneurism clips, intrauterine devices, or shrapnel. Even older generation tattoos have trace amounts of metal that cause burns when exposed to the magnets of the fMRI machine.
The data collected by fMRI can be very difficult to analyze and are frequently subject to false positives. The change in BOLD signal measured in an fMRI is very small: one study estimates that perfusion increases by only 0.4% even under the greatest activation. Using standard fMRI analysis methods, an infamous study demonstrated that even a dead salmon in an fMRI exhibits brain activity that is similar to those reported in other fMRI studies.
FMRI also assumes that increased blood flow is directly correlated with the amount of neural activity, which may not always be the case.
6.3 Imaging the cells of the nervous system
The methods thus far discussed are limited in how closely we can see the components of the nervous system. For example, it could be useful to try and see the specific cellular features of a healthy neuron and compare that with the features of a neuron that has been damaged by multiple sclerosis. To be able to visualize the morphology of structures smaller than hundreds of microns, you’ll need a different set of techniques.
6.3.1 Microscopy
Example questions answered:
“What is the diameter of the soma of a granule cell?”
“How are the retinal neurons at the fovea different from the neurons in the periphery?”
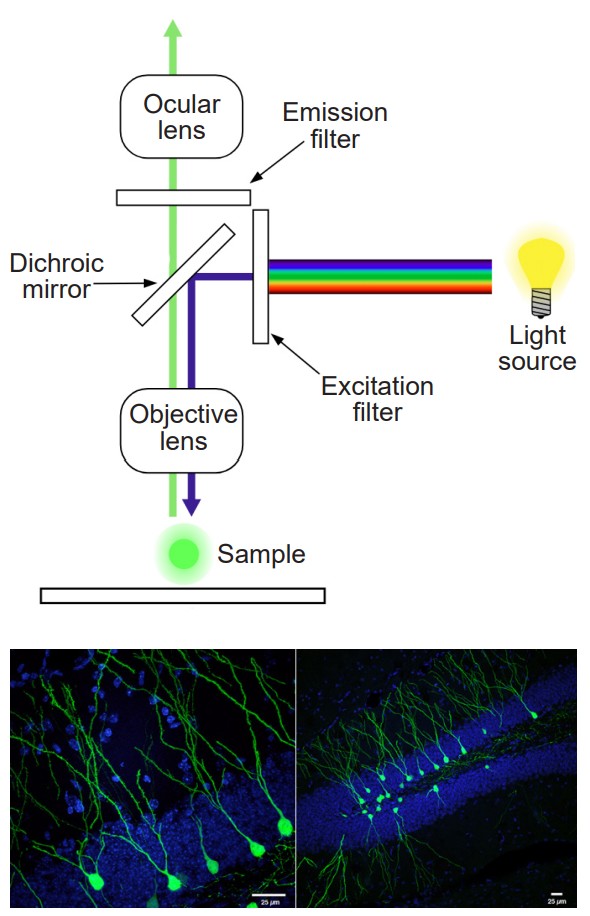
Among the techniques described in this chapter, short of physical dissection or autopsy, microscopy may be the oldest. Microscopy began with the Dutch scientist Antonie van Leeweunhoek in the late 1700s. Originally, microscopy was more of a novelty for entertainment rather than a piece of equipment fit for a laboratory. Using a series of precisely-crafted lenses and a bright source of light, Leeweunhoek was able to see tiny animals living in water.
Microscopy gives us the ability to see things at a level of resolution that would otherwise not be possible. Compared to today’s microscopes, the earliest scopes provided poor magnification, able to bring us only about 40 times closer than the unaided eye (these days, a standard laboratory microscope provides a level of magnification up to 400 or 1,000 times closer). Other types of microscopes, such as the developed in the 1930s, use an electron emission device in conjunction with high speed detectors to visualize structures that are on the order of nanometers, giving us a zoom of up to a million times!
A different form of microscopy relies on the fluorescent properties of molecules such as . Fluorescence microscopes use light sources such as filtered light or lasers which emit light at specific wavelengths. Photons at specific wavelengths activate the proteins, which in turn emit light at a different wavelength. The emission of this second color of light can then be detected.
Microscopy is a standard part of a neuroscience research kit. Most of the techniques below will rely on microscopy to visualize some component of the nervous system.
6.3.2 Staining
Example questions answered:
“Where is the white matter located in the brain stem?”
“What is the morphology of dendritic arbor of a cerebellar Purkinje cell?”
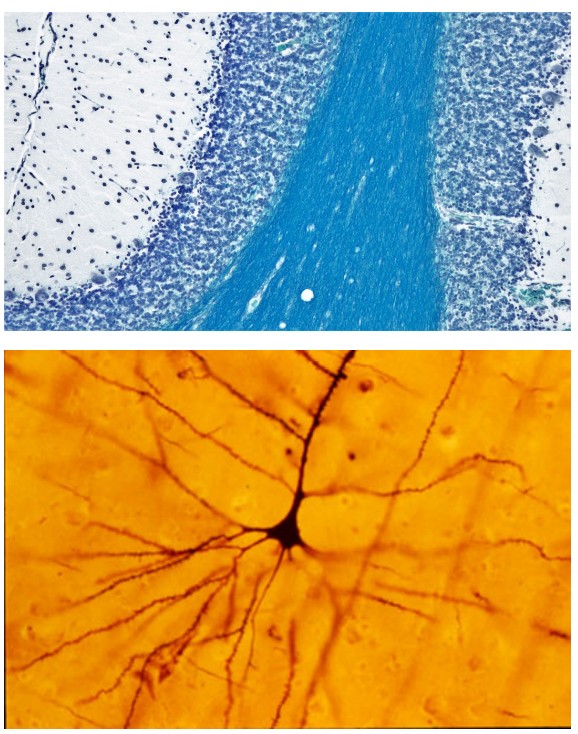
Staining is an imaging method that is often used in conjunction with microscopy. Thin slices of brain tissue are exposed to various chemical processes. The chemicals that are used for staining have different affinities for parts of cells. For example, there are stains that specifically stain myelin (Luxol Fast Blue), some that only stain neurons (cresyl violet), and some that stain only the genetic material found in cell nuclei (DAPI).
One of the most influential biological stains was developed in the late 1800s by the Italian anatomist Camillo Golgi. The is a silver-based stain that filled every single part of the neuron, from the dendrites to the axons, turning the cells black. The stain is only taken up by less than 1% of neurons, and because of the low rate of staining, individual neurons could be traced in their entirety and drawn. This stain led to a contentious battle between Golgi and a rival neuroanatomist Santiago Ramon y Cajal over the nature of the connections between neurons.
For staining to work, the tissue needs to be subjected to a series of chemical processes. First, the tissue needs to be fixed. is a chemical process that is accomplished by exposing the tissue to a chemical like paraformaldehyde (PFA). The most effective way to expose every part of the body to fixative is to “hijack” the endogenous circulatory system by flushing fixative through the arteries, a process called . Chemically, fixatives cause adjacent proteins to become covalently bonded (crosslinked), a process which causes the proteins to become unchangeable – they become “fixed” in time. These fixatives are very harsh chemicals, and usually kill microorganisms and inactivate the endogenous enzymes that normally degrade biological tissue. (As a side note, fixatives are particularly nasty carcinogens that can permeate easily through latex gloves.)
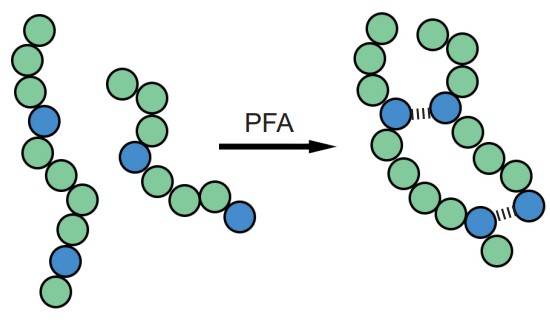
After fixation, devices such as a or are used to slice the brain into sections as thin as 10 microns. Stains do not always reliably pass all the way through thick sections of tissue such as an intact brain. With thin slices, chemical stains are able to permeate through the depth of the tissue.
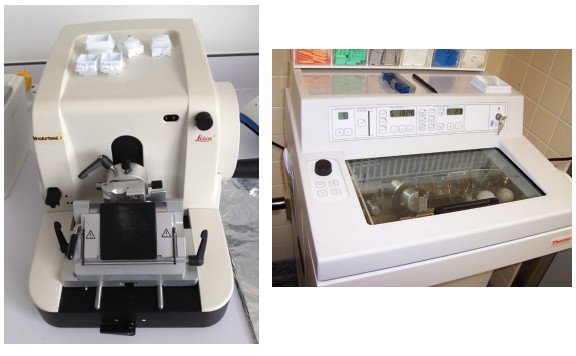
Certain staining methods can also be used to determine projections of neurons. These techniques are collectively called . An stains cells from the soma to the axon terminal, while a is taken up by the axon terminals and stains the soma. These strategies are helpful for visualizing the nature of connectivity in the nervous system.
Staining cannot be done on living tissue; it can only work on fixed tissue.
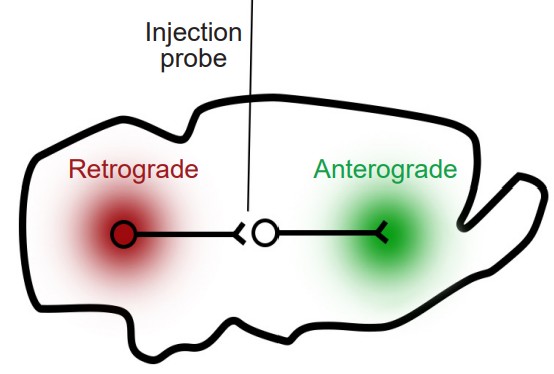
6.3.3 Immunohistochemistry staining
Example questions answered:
“Where is the protein actin located in a neuron?”
“Is the protein PSD-95 expressed in the same areas as the NMDA receptor protein?”
Immunohistochemistry (IHC) is a modification of the staining methods that gives increased specificity over the other chemical stain methods presented above. IHC is used because it is good for identifying the location of specific proteins at a subcellular level. In other words, you can use IHC to figure out where specific neurons are located inside or on the cell.
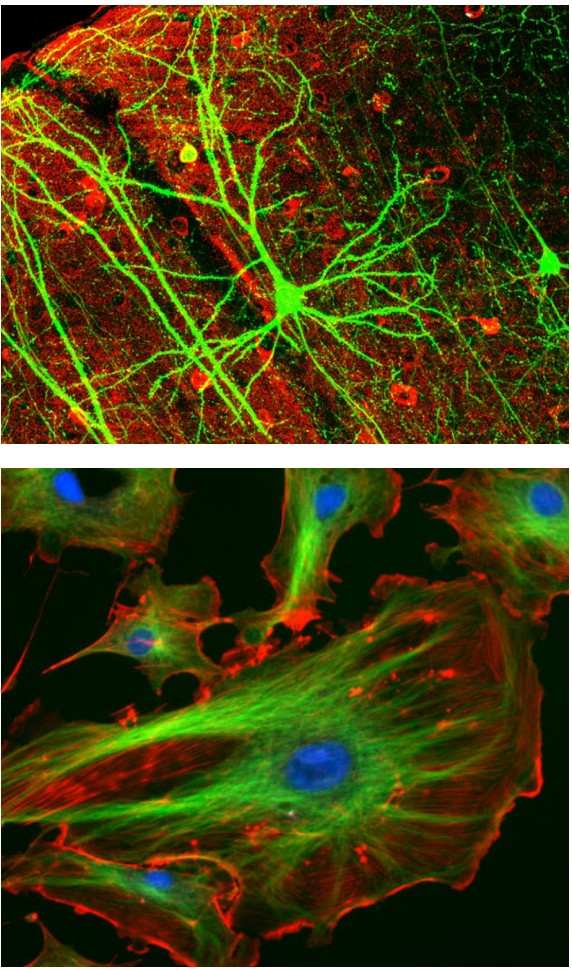
As with other staining methods, IHC begins with thinly prepared sections of fixed tissue. Instead of exposing the tissue to various chemical stains, IHC utilizes the molecular properties of , proteins that function in the immune response. Each antibody has a part of their Y-shaped structure that is able to bind to other targets (which are called ) with extremely high specificity. This other target could be a specific protein, such as serotonin receptors or amyloid precursor protein, or an enzyme such as choline acetyltransferase. Antibodies are created with a particular target in mind, so when the antibody is bathed over the brain tissue, the antibody will adhere only to that target.
The IHC protocol often uses two different antibodies. The first antibody, called the , is selected because of its ability to bind to the antigen that you are interested in studying. For example, if you wanted to search for the location of a protein called NeuN, the primary antibody would be anti-NeuN. Afterwards, the tissue will be exposed to the secondary antibody.
This is chosen because its target is something that is found on the primary antibody. As an additional feature, the secondary antibody is conjugated with a light sensitive , or light-producing molecule. Activation of this fluorophore on the secondary antibody under fluorescence microscopy is then used to identify the location of the primary antibody.
It is also possible to use antibodies and fluorescence microscopy to visualize the elements of cells in a culture dish (in vitro). The theory behind this technique is the same as in IHC, but the name is different. Instead, this approach is called immunocytochemistry (cyto = cell, while histo = tissue). This immunolabeling strategy can also be applied to a whole brain after it has been made transparent through CLARITY (section 6.1.3).
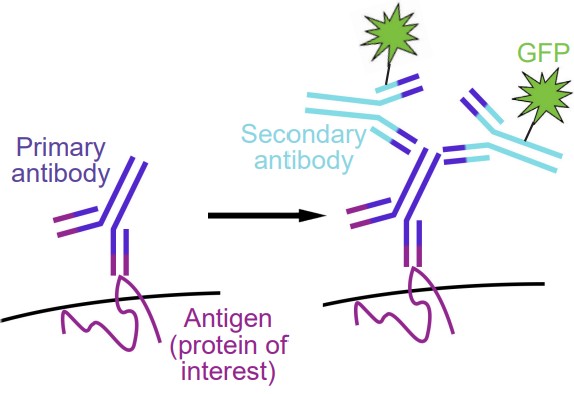
One of the main difficulties with immunochemistry is that the antibodies often exhibit . Although antibodies are used because of their ability to recognize and differentiate between similar-looking antigens, often they bind to the wrong targets. When they do, it creates a false positive, causing a fluorescent signal to appear when there is actually no protein present. Nonspecific binding also causes an increase in background noise, making it more difficult to identify a genuine fluorescent signal, indicating presence of the protein of interest. Various steps can be taken during the immunochemistry procedure that minimize the likelihood of nonspecific binding, such as thorough rinsing and exposure to blocking agents.
For an immunochemistry protocol to work, an antibody must exist for the specific target of interest. However, an antibody has not been developed against every single protein or enzyme. Another issue is that some proteins are structurally very similar to other proteins, and an antibody has not yet been developed that can differentiate the two. For example, the structure of the dopamine receptor type 2 is so similar to type 3, that there are no antibodies that can target one without the other.
6.4 Changing nervous system activity
Visualizing the gross anatomy or cellular structures of the nervous system allows us to ask very meaningful scientific questions. However, sometimes you are interested in controlling some part of the nervous system, either by increasing or decreasing activity. Using the following neural manipulation strategies, it becomes possible to establish causation between some aspect of the nervous system (neuron, structure, neurotransmitter, gene, etc.) and function.
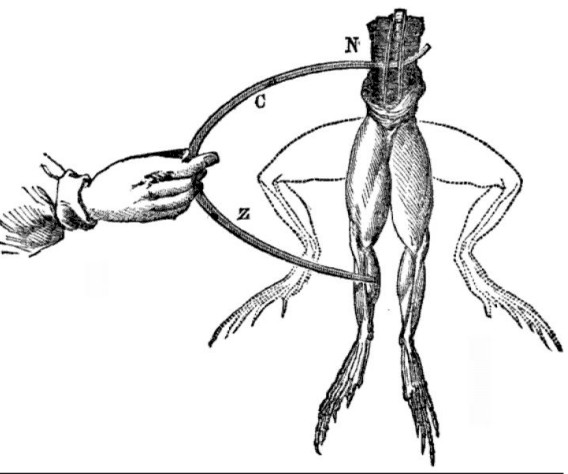
Early neural manipulation strategies trace back to the late 1700s with the accidental discoveries of the Italian biologist Luigi Galvani. With a dissected frog leg on his lab bench, Galvani discovered that he could cause the muscles to twitch by electrically activating the nerves that innervated the muscles of the leg. He called this observation “,” which is the idea that endogenous electrical activity is important for muscle control, and by extension, the activity of the whole organism.
Neural manipulation became possible in humans following the work of the brain surgeon Wilder Penfield. In the 1950s, Penfield worked to develop a treatment for epilepsy. In this procedure, the patient is given a local anesthetic while the skin above their skull was resected, allowing access to the brain. The surface of the brain has no pain receptors, so brain surgery can be done while the patient is completely awake. With the patient’s brain exposed, Penfield used a brief electrical pulse delivered by an electrode placed at the surface of the brain. The stimulation activates descending motor systems, which caused muscle contractions in very specific muscle groups of the patient. For example, stimulating the dorsal most part of the motor cortex caused a twitch of the upper leg and hip muscles. By moving incrementally across the motor cortex, he was able to draw a graphical representation of which areas of the motor cortex controls which muscles.
The techniques presented here are all methods by which we can induce some type of change in nervous system activity.
6.4.1 Electrophysiology (Ephys)
Example questions answered:
“How frequently do neurons in the striatum fire action potentials?”
“Does increasing cortical activity change the excitability of spinal cord neurons?”

Electrophysiology relies on using specialized equipment, informally called a , to measure and manipulate the electrical properties of the nervous system. Originally, electrophysiology was used to detect the difference in electrical potential between the inside of the neuron and the outside. The earliest electrophysiology techniques examined the giant axon of the Loligo squid. The axon itself is so large with a diameter around 1 mm, the inside of these neurons are very easy to access by running a conductive probe into the cell. Two researchers, Alan Hodgkin and Andrew Huxley, earned a Nobel prize in 1963 for the work that came out of these electrophysiological techniques.
Electrophysiology on a cellular level usually requires the concurrent use of a microscope to get resolution down at the level of the neuron, which may be on the order of tens of microns in diameter. At this level of magnification, tiny glass micropipettes filled with an electrolyte solution can then be inserted into neurons, and electrical currents can then be detected and recorded. These currents can be the currents associated with the movement of charged ions, such as sodium during an action potential.
Electrophysiology can also be used to manipulate the activity of neurons. Instead of simply detecting currents, electrophysiology gives you direct physical control over the electrical properties of the neuron, which gives us the ability to manipulate different components of the nervous system.

Electrophysiology can be a very versatile technique. Because there are many strategies that count as electrophysiology, you can ask questions at many levels, from behavior and neuronal circuitry to individual neurons and ion channels. With electrophysiology, you can record the patterns of neuronal activity as a rat performs on a behavioral task, and stimulate neurons to see if you can modify the behavior. On the other extreme, you can examine the activity of individual ion channels, to determine the conditions when they open and close.
One weakness lies in the highly experimental nature of electrophysiology. There are many different preparations that can be used in studying the electrical activity of the nervous system: intact anesthetized, thin slice of living brain, neuronal culture, or even frog oocytes that express neuronal receptors. But, each step you move away from the awake and behaving animal, the more difficult it becomes to draw inferences based on our results. What we gain in control over the experimental preparation, we lose in ability to generalize about data.
6.4.2 Transcranial magnetic stimulation (TMS)
Example questions answered:
“Which part of the motor cortex sends signals to the contralateral foot?”
“Can activation of parts of the prefrontal cortex decrease the symptoms of depression?”
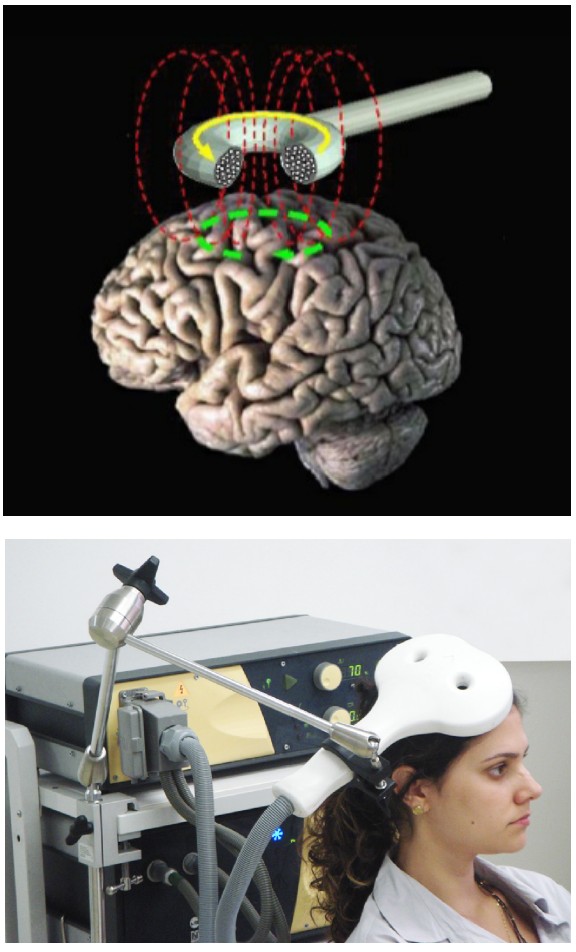
In physics, there is a close relationship between electricity and magnetism. The movement of magnets can generate electric currents, and conversely, electricity can generate magnetic fields, a process called . A brain stimulation technique called transcranial magnetic stimulation (TMS) relies on induction to generate electrical currents through the skull. The TMS machine itself is a handheld coil of wires in a loop. Passing electrical current through that loop produces a magnetic field. The magnetic field generated then induces an electrical current at some distance away from the coil. By placing the coil at the surface of the scalp, we can electrically activate small areas of brain tissue. For instance, using TMS above the motor cortex causes muscle contractions, and using TMS above the occipital lobe causes the perception of flashes of light.
TMS is believed to have moderate benefits for several different psychiatric conditions, potentially making it a meaningful therapeutic intervention. Activation of motor cortex may help alleviate chronic pain conditions, Parkinsonian symptoms, and improve contralateral motor function following stroke injury. Activation of prefrontal cortex can decrease anxiety, antidepressive symptoms, cigarette craving or consumption, and schizophrenia. Stimulation of other brain regions can be antiepileptic, and may also minimize auditory hallucinations or tinnitus (ringing in the ears.)
The technique itself is completely noninvasive. TMS can be delivered simply with placement of the electric coil on the surface of the head.
TMS may have some unexpected consequences, such as temporary headaches, localized pain, changes in hearing, and bizarre changes in somatosensation. The most severe side effect so far recorded is seizures, which can be very dangerous. Use of TMS is still highly experimental.
As with fMRI, the magnetic fields generated by a TMS device can cause dangerous interactions with any magnetosensitive implants, such as deep brain stimulation devices, cochlear implants, or aneurysm clips.
Introduction to Computational Neuroscience

Computational neuroscience is a branch of neuroscience that focuses on explaining neural mechanisms through computational methods. This multi-disciplinary field draws from other fields such as electrical engineering, physics, and computer science to better understand how the nervous system processes information. Computational neuroscience strives to answer a wide range of questions in neuroscience research, including computation in single neurons, computation in a neural network, neuron development, sensory processing, motor control, memory and plasticity, as well as broader questions about vision, consciousness, and cognition. Sometimes, using computational approaches can be described as being an in silico preparation.
Computational neuroscience provides tools and methods for developing models, which are used for answering different categories of questions.
1. Descriptive models characterize what nervous systems do. These models qualitatively describe data through neural encoding as well as extract information through neural decoding, the reconstruction of information that has already been encoded and represented in the brain by a network of neurons. Reconstruction is the researcher’s ability to predict sensory stimuli purely from the action potentials from neurons. The objective of neural decoding is to characterize the electrical activity of neurons in relation to responses in the brain. Neural encoding characterizes the relationship between the stimulus and the neuronal responses and the relationship with electrical activity.
2. Mechanistic models are used to determine how nervous systems relates with known anatomy and physiology. These models simulate the behavior of a single neuron or network of neurons.
3. Interpretive models lead to an understanding of why the nervous system operates in a particular way. These models are used to examine neural cognition and the underlying nervous system functionality.
There is debate with how computational models can be used to best reflect the nervous system. A model that focuses largely on defining biological processes into mathematical terms may stray from its intended purpose and not accurately reflect neural behavior. In other cases, a mathematical model may oversimplify neural behavior and may lead to false conclusions. Thus, there is a focus on biologically plausible neural networks to best model the nervous system.
6.4.3 Genetic modification
Example questions answered:
“Do rats behave differently if they do not synthesize the hormone leptin?”
“How do mutated voltage-gated sodium channels change their neuronal action potential firing?”
Since the rise of molecular genetics techniques in the 1970s, researchers have discovered some of the underlying genetic commonalities between healthy people and those with neurological or psychiatric conditions. The genomes of many animals have been completely mapped out including the nematode C. elegans (1998), drosophila (2000), mouse (2002), human (2003), rat (2004), and the macaque monkey (2007).

Knowledge of their genomes, and the capability to manipulate their genomes, has allowed researchers to create animal models of a variety of human conditions. For example, we can use gene excision to remove a small section of the genetic code, such as the part that codes for a certain protein. This strategy is called , and is helpful for identifying the function of a genetic sequence. Alternatively, we can use gene insertion to put in exogenous genes into an animal. For example, we can generate mice that express the human version of a gene. We call these humanized mice. This type of modification is called a . There is an entire spectrum of genetic modifications that can be performed, including knock-downs (moderate decrease in function), upregulations (some increase in function), or conditional knock-outs (an organism that is normal until exposed to certain chemicals).
A recent advance in genetic modification technology published in 2012 called the system allows for targeted editing of the genome. The main advantage provided by CRISPR-Cas9 is the simplicity, efficiency, and precision of the method. While still highly experimental, there are potential therapeutic applications for CRISPR-Cas9 in treating a variety of genetic diseases.
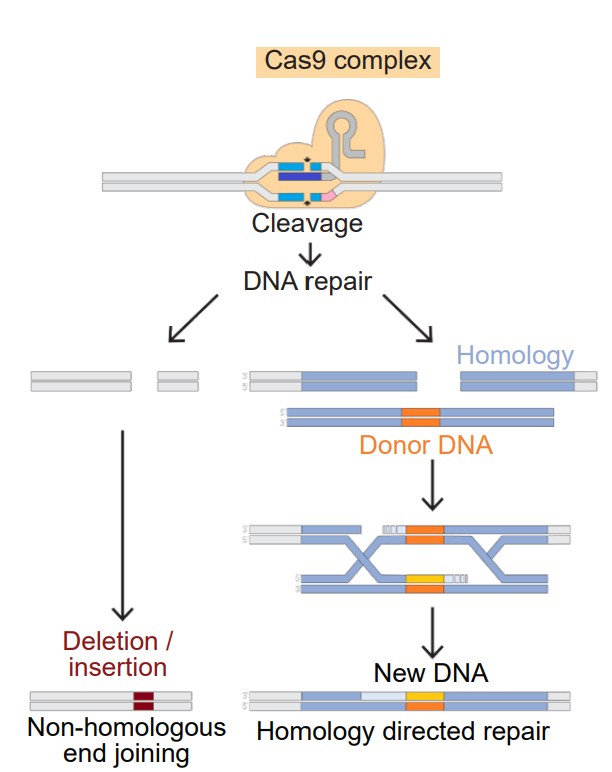
With the combined help of dedicated laboratories across the world, a wide variety of genetically-modified mice are commercially available for research purposes. Many scientific advances have come from these research models. It’s also possible to develop an animal with multiple genetics crosses, which allow for several complex questions to be answered.
A shortcoming of the information gained from these genetic modification techniques is the difficulty in generalizing the findings beyond the specific genetic strain. For example, consider a knock-in approach to model a brain disorder in mice. If a therapy is developed that helps these animals, it is certainly a starting place that may lead to a human therapy. But, there is no certainty that the therapy will also be effective in humans.
Genetic modifications may also produce unexpected side effects as a result of changes to the genetic code. It is difficult to predict how a specific gene manipulation will interact with other aspects of the animal’s physiology.
6.4.4 Optogenetics / Chemogenetics
Example questions answered:
“How does activating cortical glutamatergic drive affect firing rate of neurons in the striatum?”
“Does inactivation of GABA-ergic circuits in the amygdala change anxiety behaviors?”
One of the problems with early neural stimulation strategies was a lack of specificity. For example, many brain regions are home to a hodgepodge of cell populations that produce and release different neurotransmitters. In activating these areas, it was impossible to know if the effect of stimulation was due to activity of a specific population of neurons. Additionally, we were unsure if the results of electrical stimulation were due to the activity of that specific brain area where the stimulator was placed, or if it was due to the activation of axonal fibers that simply pass through that area. This was described as the .
The following two strategies, optogenetics and chemogenetics, were recent advances in neuroscience techniques that increase the specificity of brain stimulation. As of now, both of these techniques are exclusively used in nonhumans for research purposes.
Optogenetics
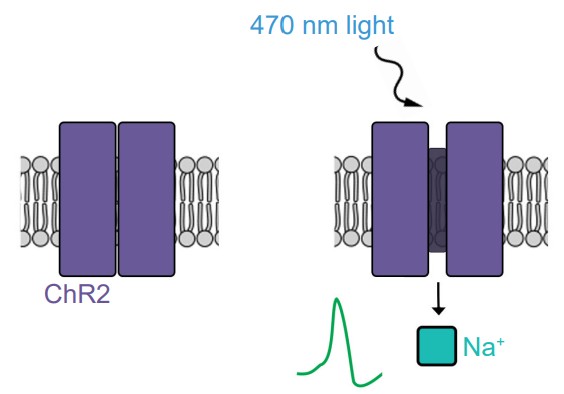
A revolutionary strategy developed in 2006 by researchers from Stanford University, optogenetics use light sensitive-ion channel proteins called , or . The light-sensitive component of ChR2 is a protein that is derived from the rhodopsin molecule, the same proteins that allow photoreceptors in the visual system to detect light. The ion channel component is a cation-permeable transmembrane pore that can allow Na+ ions to move across the cell membrane. When a photon of blue light hits the ChR2 molecule, the protein physically changes shape, causing the cation channel to open, enabling inward flow of positively charged sodium ions. Therefore, ChR2 gives us the ability to excite neurons with flashes of light.
The ability for ChR2 to change structure in response to light is very fast, and the subsequent movement of changed ions down their electrochemical gradient is even faster. A brief 0.5 millisecond flash of blue light is enough to trigger sufficient inward Na+ current to induce a single action potential. Once the blue light is turned off, the channel closes in less than a millisecond. The speed with which ChR2-expressing neurons can respond gives optogenetic strategies a temporal resolution on the order of milliseconds.
ChR2 is possibly the most popular optogenetic molecule, but not the only one. Since its adoption into neuroscience, there have been several other proteins with similar light-sensitive characteristics. Halorhodopsin is a light-sensitive pump that uses energy from yellow-green wavelengths to actively push chloride into the cell, which inhibits neurons. Archaerhodopsin is a light-sensitive proton pump that extrudes H+ ions, which inhibits neurons.
ChR2 also has very high specificity, since optogenetics is used in conjunction with knock-in genetic modification technology or viral gene delivery to insert ChR2 into unique cell populations. This strategy allows researchers to isolate the effect of activation of a specific cell population within an area of the brain that has many different cell types.
Chemogenetics
Chemogenetics is an alternative strategy to selectively activate specific cell populations. Instead of using light to activate special receptors, these techniques use various chemical agonists. Chemogenetic receptors are usually G-protein coupled receptors that are activated only by exogenous drugs, but not by any endogenous neurotransmitters. The most well-characterized chemogenetic receptor is called , which stands for designer receptor exclusively activated by designer drugs. When the receptor is exposed to the designer drug, it can trigger the activation of the intracellular signaling pathway that can either excite or inhibit the neuron, depending on the nature of the DREADD. So, when a DREADD protein is inserted into a neuron, there are no changes in neuronal activity at rest. But once the receptor is exposed to the endogenous drug, the DREADD is activated, which changes the activity of the neuron.
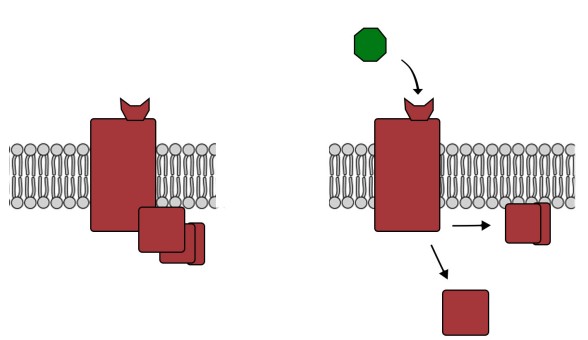
Because chemogenetics requires the drug to enter the system and subsequent GPCR activation before a change in behavior can be observed, DREADD offers significantly less temporal resolution than optogenetics (in an ex vivo preparation – seconds to tens of seconds; in a behaving animal – minutes).
Optogenetics / chemogenetics can be used simultaneously with other techniques. Combining optogenetics with electrophysiology techniques has taught neuroscience about the nature of the connectivity between brain areas. Behavioral testing with simultaneous optogenetic or chemogenetic stimulation has given us insight into the roles that are played by specific neural circuits or neurotransmitters. These techniques are quickly advancing our understanding of the nervous system, and will continue to do so in the future.
Image Credits
2.1 File:1201 Overview of Nervous System.jpg: OpenStaxderivative work: GnolizX [CC BY 4.0 (https://creativecommons.org/licenses/
by/4.0)] Changes made by Austin Lim.
2.2 Helixitta [CC BY-SA 4.0 (https://creativecommons.org/licenses/by-sa/4.0)] Changes made by Austin Lim
2.3 Looie496, Originally drawn by François Leuret and Louis Pierre Gratiolet [Public domain]
2.4 BruceBlaus. When using this image in external sources it can be cited as:Blausen.com staff (2014). "Medical gallery of Blausen
Medical 2014". WikiJournal of Medicine 1 (2). DOI:10.15347/wjm/2014.010. ISSN 2002-4436. [CC BY 3.0 (https://creativecommons.
org/licenses/by/3.0)] Changes made by Austin Lim
2.5 neuroanatomy.ca
2.6 [[::User:Nrets|Nrets]] [CC BY-SA 3.0 (http://creativecommons.org/licenses/by-sa/3.0/)] Changes made by Austin Lim
2.7 Mysid, arrows were added by Was a bee [Public domain] Changes made by Austin Lim
https://commons.wikimedia.org/wiki/File:PSM_V46_D168_Mesial_view_of_the_human_brain.jpg changes made by Austin Lim
2.8 Originally from the collection of Jack and Beverly Wilgus, and now in the Warren Anatomical Museum, Harvard Medical School. [CC
BY-SA 3.0 (https://creativecommons.org/licenses/by-sa/3.0)], John M. Harlow, M.D. [Public domain]
2.9 Internet Archive Book Images [No restrictions]
2.10 vsion and JmarchnThis SVG image was created by Medium69.Cette image SVG a été créée par Medium69.Please credit this :
William Crochot [Public domain]. Changes made by Austin Lim.
2.11 Internet Archive Book Images [No restrictions]
2.12 OpenStax [CC BY 4.0 (https://creativecommons.org/licenses/by/4.0)]. Changes made by Austin Lim.
2.13 BruceBlaus [CC BY-SA 4.0 (https://creativecommons.org/licenses/by-sa/4.0)]. Changes made by Austin lim.
2.14 Rhcastilhos [CC BY-SA 3.0 (https://creativecommons.org/licenses/by-sa/3.0)] . changes made by Austin Lim.
2.15 OpenStax College [CC BY 3.0 (https://creativecommons.org/licenses/by/3.0)], OpenStax College [CC BY 3.0 (https://creativecommons.
org/licenses/by/3.0)], changes made by Austin Lim
2.17 Rhcastilhos [Public domain], Ceccomaster [CC BY-SA 3.0 (https://creativecommons.org/licenses/by-sa/3.0)], changes made by
Austin Lim
2.18 ElinorHunt [CC BY-SA 4.0 (https://creativecommons.org/licenses/by-sa/4.0)], changes made by Austin Lim
2.19 Kuebi = Armin Kübelbeck [CC BY 3.0 (https://creativecommons.org/licenses/by/3.0)], changes made by Austin Lim
2.20 BruceBlaus [CC BY 3.0 (https://creativecommons.org/licenses/by/3.0)], changes made by Austin Lim
2.21 https://upload.wikimedia.org/wikipedia/commons/9/95/Hydrocephalus_CDC.png, changes made by Austin Lim
2.22 https://upload.wikimedia.org/wikipedia/commons/4/4c/1316_Meningeal_LayersN.jpg , changes made by Austin Lim
6.1: Image by Pete Linforth from Pixabay https://pixabay.com/photos/countryside-tree-landscape-sunlight-2175353/
6.2: https://pixabay.com/photos/ara-parrot-yellow-macaw-bird-3601194/
6.4: https://upload.wikimedia.org/wikipedia/commons/c/cc/Adult_Caenorhabditis_elegans.jpg
https://commons.wikimedia.org/wiki/File:Standing_female_Drosophila_melanogaster.jpg
https://commons.wikimedia.org/wiki/File:Mouse_white_background.jpg
https://pixabay.com/photos/rat-garden-out-curious-sweet-1379317/
https://pixabay.com/photos/animal-monkey-3892155/
https://pixabay.com/photos/personal-network-social-media-3139194/
Experimental preparations: https://commons.wikimedia.org/wiki/File:54986main_mouse_med.jpg
https://upload.wikimedia.org/wikipedia/commons/c/c7/Galvani-frogs-legs-electricity.jpg
https://upload.wikimedia.org/wikipedia/commons/0/05/Cell_culture.jpg
6.5: https://upload.wikimedia.org/wikipedia/commons/f/fe/M%C3%BCller-Lyer_illusion.svg
6.6: https://wellcomecollection.org/works/vyfjw978?wellcomeImagesUrl=/indexplus/image/L0028667.html
https://commons.wikimedia.org/wiki/File:1895-Dictionary-Phrenolog.png
6.7: https://commons.wikimedia.org/wiki/File:Medical_X-Ray_imaging_WYJ07_nevit.jpg
6.8: https://pixabay.com/photos/bethesda-naval-medical-center-80380/
6.9: https://commons.wikimedia.org/wiki/File:Ct-scan_of_the_brain_with_an_subdural_hematoma.jpg modified by Austin
Lim
6.10:
https://upload.wikimedia.org/wikipedia/commons/0/09/The_diffusion_tensor_tractographies_of_neural_tracts_for_
language_fnhum-07-00749-g001.png
6.11: https://pubs.niaaa.nih.gov/publications/arh27-2/146-152.htm modified by Austin Lim
6.12: Optimization of CLARITY for Clearing Whole-Brain and Other Intact Organs Jonathan R. Epp, Yosuke Niibori, HwaLin (Liz) Hsiang, Valentina Mercaldo, Karl Deisseroth, Sheena A. Josselyn, Paul W. Frankland eNeuro 8 May 2015, 2 (3)
ENEURO.0022-15.2015; DOI: 10.1523/ENEURO.0022-15.2015
6.13: https://upload.wikimedia.org/wikipedia/commons/b/bf/EEG_cap.jpg
https://upload.wikimedia.org/wikipedia/commons/f/f1/Gen-20s_SWK.png modified by Austin Lim
6.14: https://commons.wikimedia.org/wiki/File:Fluorodeoxyglucose_18-F_skeletal.svg
6.15: https://upload.wikimedia.org/wikipedia/commons/7/7b/PET_scan.jpg
https://upload.wikimedia.org/wikipedia/commons/2/2a/Pet_scan_of_brain_tumor.jpg modified by Austin Lim
6.17: https://upload.wikimedia.org/wikipedia/commons/2/2a/FMRI_BOLD_activation_in_an_emotional_Stroop_task.jpg
modified by Austin Lim
6.18: https://upload.wikimedia.org/wikipedia/commons/e/e1/FluorescenceFilters_2008-09-28_cs.svg modified by Austin
Lim
https://upload.wikimedia.org/wikipedia/commons/9/9e/DGCs_in_GFP.jpg
6.19: https://upload.wikimedia.org/wikipedia/commons/5/5e/Cerebellum_Cross_Section_Medulla_%2842040992452%29.
jpg
https://upload.wikimedia.org/wikipedia/commons/6/6d/GolgiStainedPyramidalCell.jpg
6.21: https://upload.wikimedia.org/wikipedia/commons/9/9c/Cryostat_microtome.jpg
https://upload.wikimedia.org/wikipedia/commons/4/46/Leica_microtome_2.JPG
6.23: https://upload.wikimedia.org/wikipedia/commons/d/dc/PLoSBiol4.e126.Fig6fNeuron.jpg
https://upload.wikimedia.org/wikipedia/commons/0/09/FluorescentCells.jpg
6.25: https://upload.wikimedia.org/wikipedia/commons/c/c7/Galvani-frogs-legs-electricity.jpg
6.26:
https://upload.wikimedia.org/wikipedia/commons/1/13/Patch_rig.png
https://upload.wikimedia.org/wikipedia/commons/1/19/Giant_Axon_of_Squid_%2814356033761%29.jpg
6.27: https://upload.wikimedia.org/wikipedia/commons/9/9c/Whole_Cell_Patch_Clamp_Steps.png modified by Austin Lim
6.28: https://upload.wikimedia.org/wikipedia/commons/6/67/Transcranial_magnetic_stimulation.jpg
https://upload.wikimedia.org/wikipedia/commons/3/38/Neuro-ms.png
6.29: https://upload.wikimedia.org/wikipedia/commons/5/5f/Brain-Controlled_Prosthetic_Arm_2.jpg
6.30: https://upload.wikimedia.org/wikipedia/commons/e/e1/Knockout_Mice5006-300.jpg
6.31: https://upload.wikimedia.org/wikipedia/commons/0/04/DNA_Repair-colourfriendly.png Modified by Austin Lim
The brain and spinal cord.
All the other nerve cells in the body.
Information that arrives into the CNS.
Information leaving the CNS.
parts of the brain that are more forward
parts of the brain towards the back
another word to describe rostral
another word for caudal
Brain structures that are above, or closer to the top of the head
Brain structures that are below, or closer to the bottom of the head
describes a structure on top
describes a structure below
Brain structures that are closer to the center of the brain
Brain structures that are closer to the sides of the brain
A slicing projection of the brain slicing from anterior to posterior
A slicing projection of the brain where cuts are made along the dorsal-ventral direction, from the top of the brain to the bottom
takes cuts parallel to the midline, slicing in the medial / lateral plane.
brain tissue that's pale and almost white
layers of fatty lipids
parts of the brain that's darker pink / gray color
the main white matter tract that allows for the passage of information between the two hemispheres
forms during the third to fourth week of gestation. The cells of the neural tube will eventually become the components of the CNS.
a structure that is found at the posterior end of the brain stem
helps us perform involuntary functions like breathing
best known as a structure that enables motor control functions, such as balance, coordination, posture, and learning physical actions
handles sensory information
serves as a communication route to the body’s endocrine system
used for such behaviors as motor and habit learning, emotional processing, and action selection
here, the brain processes behaviors such as attention, memory, and language.
the bumpy outer surface that is made up of raised ridges and grooved indentations
raised ridges on outer surface of brain
grooved indentations on the surface of the brain
sometimes referred to as the grooved indentations of the brain
divides the two hemispheres, running along the anterior-posterior axis, visible from a dorsal view of the brain
a large fissure that starts at the dorsal part of the brain at about the halfway point on the anterior-posterior axis
runs roughly along the anterior to posterior direction, and curves gently dorsally
interprets signals converted by the eye into a representation of the visual world
located in the temporal lobe, the primary auditory cortex interprets sound waves
helps to remember important facts
the ability to identify where parts of your body are located
responsible for sensory and proprioception information
contains neurons that control movement of the body
functions to carry information both upwards towards the brain, and downwards towards the body’s other organs and muscles. It can also process sensations and form an appropriate motor response in the absence of brain input
formed when efferent motor nerves and afferent motor nerves merge
These sections are parallel to the ground if the spinal cord was oriented vertically, like a person standing up
another name for transverse slices of the spinal cord
a large clump of nervous tissue containing most sensory neurons
Signaling between the brain and the rest of the body: signaling pathways from the left brain crosses over to communicate with the right half of the body, and vice versa.
describes a part of the body that is on the same side as that half of the nervous system
describes the bodily responses activated when faced with threat, either perceived or real
one of two branches of the autonomic nervous system; activates fight-or-flight.
A parasympathetic psychological response resulting in lowered heart rate and feeling relaxed, satisfied, and more than a little sluggish
sends signals that decrease heart rate
nerves form a chain of many clumps of cells that run alongside the spinal cord
innervates multiple bodily organs in the midsection of the body
12 pairs of nerves that exit from the brain and controls motor functions, sensory functions, or both
a loop-like circular blood vessel
provide blood to dorsomedial cortical structures and deep brain structures
provide blood to the occipital lobe
deliver blood to the lateral cortices
normal blood flow is interrupted, causing cell death by deprivation of brain tissue of oxygen and nutrients
a burst blood vessel that causes bleeding into the brain
an anatomical adaptation that selectively transports substances necessary for normal biological function, while simultaneously excluding potentially harmful invaders from the brain
A glial cell that makes up the Blood-brain barrier along with endothelial cells
large symmetrical “holes” near the medial aspect
two very large paired ventricles, one in each hemisphere
connected medially to the lateral ventricles, extends to the posterior aspect of the brain
a narrow space that runs all the way through the length of the spinal cord along the midline
the liquid that fills the ventricles
a tightly-regulated membranous sac where cerebrospinal fluid is found
thick, fibrous material physically attached to the inside of the skull
middle layer of the meninges that allows for CSF to drain into sinuses
third layer of the meninges, very fragile and is in direct contact with the surface of the brain
the ability to differentiate two points in space from each other
the ability to distinguish two events in time from one another
nonhumann organisms used for studying and testing
an experiment performed on cultured cells or isolated molecules of DNA, RNA, or protein
a section of the living organism is taken, such as a slice of brain, a tissue biopsy, or a detached frog leg
the belief that we can predict personality traits based on the shape of a person’s head and the bumps on the outside of the skull
the idea that specific areas of the brain are important for certain functions
a three-dimensional X-ray that revolves around the person as they move through the scanner
quantifies white matter by using MRI technology to detect and quantify the movement of water molecules, which moves differently in gray matter than white matter
molecules can move any direction with equal probability
The difference in molecular motion
a method by which we can observe electrical activity of the brain
an application of nuclear medicine best known for its applications in the medical setting for the diagnosis of cancer
a compound where an atom is substituted with a radioactive isotope
a radioactive analog of glucose, one of the main sources of cellular energy
short for fluorodeoxyglucose-F18
change in blood flow from blood vessels dilating in the brain
short for blood oxygenation level-dependent signal
uses an electron emission device in conjunction with high speed detectors to visualize structures that are on the order of nanometers
emits green light when activated by photons
a silver-based stain that filled every single part of the neuron, turning the cells black
a chemical process that is accomplished by exposing the tissue to a chemical like paraformaldehyde
flushing fixative through arteries
a device that slices the brain into sections as thin as 10 microns
a device that slices the brain into sections as thin as 10 microns
staining methods that determine projections of neurons
stains cells from the soma to the axon terminal
stains cells from the axon terminal to the soma
proteins that function in the immune response
targets antibodies bind to
First antibody in the IHC protocol, binds to the antigen that you are interested in studying
The second antibody in the IHC protocol, chosen because its target is something that is found on the primary antibody
a light-producing molecule
antibodies binding to the wrong target
the idea that endogenous electrical activity is important for muscle control, and by extension, the activity of the whole organism.
equipment to measure and manipulate the electrical properties of the nervous system
a process where the movement of magnets can generate electric currents, and conversely, electricity can generate magnetic fields
creating animal models of a variety of human conditions
using gene insertion to put in exogenous genes into an animal
allows for targeted editing of the genome
the lack of specificity with some early neural stimulation strategies
light sensitive-ion channel proteins
channelrhodopsin
designer receptor exclusively activated by designer drugs
