
8.3 The Organization Chart
Adapted by Stephen Skripak with Ron Poff
Once an organization has set its structure, it can represent that structure in an : a diagram delineating the interrelationships of positions within the organization. An example organization chart is shown in Figure 8.3, using our “Notes-4-You” example from Chapter 8.
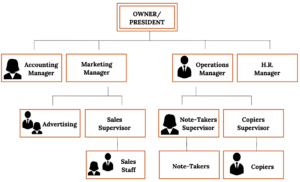
Imagine putting yourself at the top of the chart, as the company’s president. You would then fill in the level directly below your name with the names and positions of the people who work directly for you—your accounting, marketing, operations, and human resources managers. The next level identifies the people who work for these managers. Because you’ve started out small, neither your accounting manager nor your human resources manager will be currently managing anyone directly. Your marketing manager, however, will oversee one person in advertising and a sales supervisor (who, in turn, oversees the sales staff). Your operations manager will oversee two individuals—one to supervise note-takers and one to supervise the people responsible for making copies. The lines between the positions on the chart indicate the ; for example, the Note-Takers Supervisor reports directly to the Operations Manager.
Although the structure suggests that you will communicate only with your four direct reports, this isn’t the way things normally work in practice. Behind every formal communication network there lies a network of informal communications—unofficial relationships among members of an organization. You might find that over time, you receive communications directly from members of the sales staff; in fact, you might encourage this line of communication.
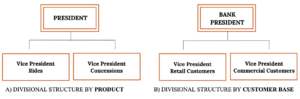
Now let’s look at the chart of an organization that relies on a divisional structure based on goods or services produced—say, a theme park. The top layers of this company’s organization chart might look like the one in Figure 8.4a (left side of the diagram). We see that the president has two direct reports—a vice president in charge of rides and a vice president in charge of concessions. What about a bank that’s structured according to its customer base? The bank’s organization chart would begin like the one in Figure 8.4b. Once again, the company’s top manager has two direct reports, in this case a VP of retail-customer accounts and a VP of commercial-customer accounts.
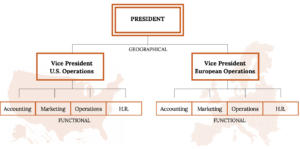
Over time, companies revise their organizational structures to accommodate growth and changes in the external environment. It’s not uncommon, for example, for a firm to adopt a functional structure in its early years. Then, as it becomes bigger and more complex, it might move to a divisional structure—perhaps to accommodate new products or to become more responsive to certain customers or geographical areas. Some companies might ultimately rely on a combination of functional and divisional structures. This could be a good approach for a credit card company that issues cards in both the United States and Europe. An outline of this firm’s organization chart might look like the one in Figure 8.5.
Chain of Command
The vertical connecting lines in the organization chart show the firm’s : the authority relationships among people working at different levels of the organization. That is to say, they show who reports to whom. When you’re examining an organization chart, you’ll probably want to know whether each person reports to one or more supervisors: to what extent, in other words, is there unity of command? To understand why unity of command is an important organizational feature, think about it from a personal standpoint. Would you want to report to more than one boss? What happens if you get conflicting directions? Whose directions would you follow?
There are, however, conditions under which an organization and its employees can benefit by violating the unity-of-command principle. Under a , for example, employees from various functional areas (product design, manufacturing, finance, marketing, human resources, etc.) form teams to combine their skills in working on a specific project or product. This matrix organization chart might look like the one in the following figure.
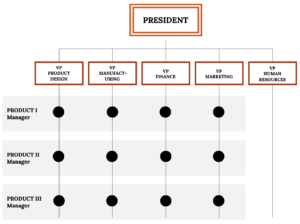
Nike sometimes uses this type of arrangement. To design new products, the company may create product teams made up of designers, marketers, and other specialists with expertise in particular sports categories—say, running shoes or basketball shoes. Each team member would be evaluated by both the team manager and the head of his or her functional department.
Span of Control
Another thing to notice about a firm’s chain of command is the number of layers between the top managerial position and the lowest managerial level. As a rule, new organizations have only a few layers of management—an organizational structure that’s often called flat. Let’s say, for instance, that a member of the Notes-4-You sales staff wanted to express concern about slow sales among a certain group of students. That person’s message would have to filter upward through only two management layers—the sales supervisor and the marketing manager—before reaching the president.
As a company grows, however, it tends to add more layers between the top and the bottom; that is, it gets taller. Added layers of management can slow down communication and decision making, causing the organization to become less efficient and productive. That’s one reason why many of today’s organizations are restructuring to become flatter.
There are trade-offs between the advantages and disadvantages of flat and tall organizations. Companies determine which trade-offs to make according to a principle called , which measures the number of people reporting to a particular manager. If, for example, you remove layers of management to make your organization flatter, you end up increasing the number of people reporting to a particular supervisor. If you refer back to the organization chart for Notes-4-You, you’ll recall that, under your present structure, four managers report to you as the president: the heads of accounting, marketing, operations, and human resources. In turn, two of these managers have positions reporting to them: the advertising manager and sales supervisor report to the marketing manager, while the notetakers supervisor and the copiers supervisor report to the operations manager. Let’s say that you remove a layer of management by getting rid of the marketing and operations managers. Your organization would be flatter, but what would happen to your workload? As president, you’d now have six direct reports rather than four: accounting manager, advertising manager, sales manager, notetaker supervisor, copier supervisor, and human resources manager.
So what’s better—a narrow span of control (with few direct reports) or a wide span of control (with many direct reports)? The answer to this question depends on a number of factors, including frequency and type of interaction, proximity of subordinates, competence of both supervisor and subordinates, and the nature of the work being supervised. For example, you’d expect a much wider span of control at a nonprofit call center than in a hospital emergency room.
Key Takeaways
- An organization’s structure is represented in an organization chart—a diagram showing the interrelationships of its positions.
- This chart highlights the chain of command, or authority relationships among people working at different levels.
- It also shows the number of layers between the top and lowest managerial levels. An organization with few layers has a wide span of control, with each manager overseeing a large number of subordinates; with a narrow span of control, only a limited number of subordinates reports to each manager.
a diagram delineating the interrelationships of positions within the organization
patterns of formal communication
the authority relationships among people working at different levels of the organization
employees from various functional areas (product design, manufacturing, finance, marketing, human resources, etc.) form teams to combine their skills in working on a specific project or product
which measures the number of people reporting to a particular manager
