
7. Measuring the Social World
7.1. Operationalizing a Concept

Learning Objectives
- Understand how the process of operationalizing a concept works.
- Discuss how conceptualization and operationalization are related to one another.
So how do we actually go about operationalizing a concept we’re interested in? We do so by identifying specific measures that we believe can accurately represent those ideas. Let’s say we’re interested in studying whether people who identify as males actually exhibit characteristics of “masculinity.” And let’s say we conceptualize “masculinity” as “the characteristics, social roles, values, interests, and behaviors typically associated with males in a particular society.” Here are some ways we might actually go about measuring masculinity (as defined in this specific way) in the real world:
- We survey a random sample of men to gauge their levels of masculinity. We ask what kinds of movies these men like to watch. If half or more of a respondent’s listed titles are action movies, we consider him to be exhibiting masculinity.
- We listen to informal conversations in office settings. If any of the men we observe talks about contact sports, we consider him to be exhibiting masculinity.
- We survey households and ask married men whether they are the breadwinner (defined in this case as the sole or highest-paid earner in their households). If a respondent says he is, we consider him to be exhibiting masculinity.
These are just three rough examples to give you a taste of the possibilities. We want to emphasize that the approaches to operationalization you can take as a researcher are often limitless—which is part of the fun and creativity of the research process. (In fact, some sociologists make a name for themselves precisely by figuring out ingenious ways to operationalize hard-to-measure concepts.)
You should also keep in mind that there are direct and indirect ways to measure concepts. For instance, we might explicitly ask respondents about whether they feel they are “masculine.” Or, we might choose to pose questions that never mention “masculine,” “feminine,” or other concepts clearly related to our research question, and yet allow us to draw conclusions about how “masculine” that person would appear to others—for instance, whether the individual is a breadwinner or father or takes on some other role traditionally associated with men. A researcher could make a case that either of these approaches does a good job of measuring masculinity. Or, a researcher could say both of these approaches are flawed, in that they identify people as masculine who are really not masculine (or vice versa). Again, there is not just one way—not even just one best way—to operationalize a concept. The important thing is for you to be able to defend your operationalization decisions as legitimate.
Identifying indicators for some concepts can be pretty straightforward. To measure age, for instance, you can put a question on a survey that simply asks, “What was your age on your last birthday?” To evaluate someone’s educational level, you might ask, “What is your highest educational degree?” or “What is the highest year in school you completed and got credit for?” Many variables are more complicated to measure, though. Imagine that you needed to record a person’s income level. Would you be interested in this person’s individual income, or the total income of all the people who lived in that person’s household? Do you want to count income from social programs like Temporary Assistance for Needy Families (TANF) or the Earned Income Tax Credit (EITC)? Are you interested in their income per month, or per year? Before or after taxes? The specific approach you take will depend on your research question, whether you think your respondents could answer truthfully and accurately, and other practical and theoretical considerations.
For surveys and other quantitative methods that focus on apples-to-apples comparisons of one person’s response to another’s, it’s all the more important to make good operationalization decisions from the outset that provide you with specific and clear measures. As you can imagine based on the examples we gave earlier, even an indicator measuring a relatively simple concept, such as educational level, can give you slightly different results depending on the exact phrasing of the question, and you generally do not wish to change the wording of a survey question once you start collecting data. Furthermore, for particularly complex concepts, you probably don’t want to rely on just one measure. For instance, to measure masculinity and femininity, Sandra Bem (1974) selected a series of personality traits generally recognized as masculine, feminine, or neutral and asked respondents to indicate the extent to which those traits applied to them. (Check out this link to see the list of traits and try out the survey.) In Chapter 13: Surveys, we’ll talk more about this strategy of using multiple measures to get at different dimensions of a concept.
Sometimes, a researcher will decide to ask about an aspect of a concept that is easier to measure, even if that indicator is limited in some way. For instance, a person’s precise political beliefs can be tricky to pin down, but what political party they usually support is fairly simple to find out. In the United States, a good indicator of this concept would be a survey question asking whether the respondent identifies as a Democrat, a Republican, a supporter of some other party, or an independent.[1]
The process of coming up with measures should not be too arbitrary or casual. As we mentioned earlier, one way to avoid this danger is to turn to prior theoretical and empirical work in your area of study. Theories will point you in the direction of relevant concepts and possible indicators. Empirical work will give you some specific examples of how the important concepts in an area have been measured in the past. Indeed, it often makes sense to use the same measures as researchers who have come before you. So long as you give proper credit, “borrowing” in this way in the social sciences is not only fine, but encouraged. Using a well-established measure of some phenomenon may give you more confidence in the soundness of your results. It can also give you the chance to easily compare your study’s findings with those of previous studies. That said, you may notice flaws or weaknesses in measures that have been used in the past. When that happens, you can contribute significantly to the literature just by developing and deploying better measures in your own work.
Tricky Measurement Decisions

It’s worth spending some time thinking about how our decisions about measurement can shape the ways we think about a particular phenomenon. You get what you measure, and if some aspect of a concept isn’t captured by your measures, then it might as well not exist in your analysis of it—which can create gaping blind spots in your understanding of social life. A pretty obvious example is standardized testing in schools. Such measures (sometimes called metrics in nonacademic settings) understandably become an obsession for educators, given that scores on standardized tests can determine whether teachers get fired or promoted, or schools get funded or shut down. But prioritizing this particular set of metrics can come, critics say, at the expense of nurturing the types of cognitive skills (such as creative and critical thinking) that are harder to test.
A particularly vivid example of how we get what we measure—perhaps for the worse—is the widespread use of the economic indicator known as gross domestic product (GDP). To measure the size of the national economy, government economists routinely calculate this figure, the total monetary amount of all the goods and services produced within a country’s borders, usually during a year. GDP is widely cited in news reports, and political leaders brag whenever the economy is growing according to this measure (or get attacked when it is shrinking). But using GDP as a gauge of social progress has long been controversial—as the late U.S. senator Robert Kennedy famously said, “GDP measures everything, except that which makes life worthwhile.” One critique of GDP is that the economy can still be growing amid increases in pollution, crime, poor health, economic inequality, and other things that we don’t typically see as contributing to the wealth and well-being of society, but that nonetheless generate more market activity (oftentimes, to clean up those messes) in the short term.[2] Using GDP to chart a country’s progress may therefore be overly narrow and short-sighted, giving us incentives to adopt certain policies and promote certain industries that are actually bad for society.
Let’s take another example of a controversial indicator. Intelligence is an abstract concept, but we have a sense that it exists in real life—that some people are smarter than others. Many ways of measuring a person’s intelligence exist, which means we have numerous ways to operationalize this concept—and great debate over which approach is best, or whether any form of rigorous measurement is even possible. One common way to measure intelligence is through tests of people’s analytical and pattern-matching skills, which take the proportion of right and wrong answers to derive an IQ (intelligence quotient) score—standardized so that the average person scores 100 and two-thirds of the population score between 85 and 115. In this case, IQ is a variable that measures the concept of intelligence; it is one operational definition of intelligence. IQ is used throughout the world for this purpose, although some social scientists have raised concerns about how well it actually captures the multidimensional construct of intelligence—or whether such a concept of general intelligence actually exists (see the sidebar The Bell Curve and Its Critics).
A third difficult-to-measure concept is poverty. Poverty scholar John Iceland (2013:40) defines poverty as economic deprivation, but he also points out that “views about what, precisely, constitutes poverty and who the poor are still vary across both time and place.” “Economic deprivation” represents a conceptual definition of poverty, but when we begin to think about how exactly to identify poverty in reality, we’re going to have to be a lot more specific about how we distinguish a “poor” person from a “not poor” person.
Let’s work through this example a bit more. If you wanted to identify “poor” people, what procedures would you use? Consider the following possibilities:
- Interview people and ask them, “Do you consider yourself to be financially poor?” If they say “yes,” then the person is poor; if they say “no,” then the person is not poor.
- Set a reasonable income threshold that one person needs to reach to achieve a basic standard of living—that income level (let’s call it X) will be your poverty line, and anyone below it will be designated as poor. Interview people and ask them, “Is your yearly income before taxes below X dollars?” If they say “yes,” then the person is poor.[3]
- Interview people and ask them whether they have a working stove, a refrigerator, a washing machine and dryer, and air conditioning in the place where they live. If they answer “yes” to all these questions, then the person is not poor.
All of these methods—asking people whether they’re “poor,” measuring their income, and tallying their household amenities—are defensible ways that you could distinguish “poor” from “not poor” people. They each have their strengths and weaknesses. For example, a person in an affluent neighborhood may describe themselves as “poor” on a survey because they make less than the ultrarich families they live near, but is that really what we mean by “poor”? Using income is the typical way that social scientists measure poverty, but some argue that a better measure is not how much people earn, but what sort of lifestyle they are able to live—which may be more accurately discerned by asking them about their access to household appliances like refrigerators and washing machines. Yet we may also miss something by focusing only on the possessions people have, which may vary by social context and doesn’t account for other considerations like the amount of debt they’ve accumulated in the process.
At this point, you might be wondering why you even need to bother creating your own measure of poverty—doesn’t the United States have an “official” measure of it? Well, yes. Let’s take a quick look at the method that the federal government uses to count poor Americans, which will give you a concrete sense of just how tricky the task of social scientific measurement can be.
In 1964, President Lyndon Johnson announced that his administration was launching a War on Poverty. Drawing from preliminary ideas put forward by the Kennedy administration, Johnson and his congressional allies pushed through an array of policies to reduce the number of poor people across the country, including Head Start, Medicare, Medicaid, the Supplemental Nutrition Assistance Program (SNAP), and the Job Corps, among others. There was a problem, however: How would the government track the success or failure of these new programs? It needed a good count of the country’s “poor” people over time to see whether its policies were actually effective in shrinking that population.
Although various measures of poverty had been used over the years by government agencies, there was no one official measure. Then, in a series of articles, an economist in the Social Security Administration proposed using a simple and straightforward measure of poverty based on relevant data from the Department of Agriculture (Orshansky 1965). That agency had devised a number of food plans that specified how much it would cost every month to feed a family at adequate, but varying, levels of nutrition. The economist, Mollie Orshansky, took the figure for the “economy” plan—the cheapest one—and multiplied it by three to account for other necessities, such as clothing and shelter. She also calculated a separate monthly “poverty threshold” (sometimes called the “poverty line”) based on the number of people in each family (Fisher 2008). In 1965, a key federal agency at the time, the Office of Economic Opportunity, started using Orshansky’s procedure. Four years later, it was adopted as the federal government’s official poverty measure. Even though much has changed since Orshansky devised her method (for one thing, today’s households typically spend much less than a third of their budget on food), the dollar thresholds that she specified for different family sizes are still used today—adjusted only for inflation. (In 2022, the poverty line was $13,590 in annual income, before taxes, for one person.)
Is using Orshansky’s poverty thresholds the “best” way to measure whether or not a person is poor? According to critics, the official measure is based on outdated notions of how much a household’s necessities cost. It fails to adjust for geographic differences and ignores the noncash government benefits people receive or the wealth they hold. Alternative measures of poverty that address these concerns have gained the interest of policymakers, but Orshansky’s measure continues to be the key number touted in news headlines and used to make important bureaucratic decisions about who receives assistance.
Even if the problems we just noted were addressed, some social scientists argue that the official measure would remain fundamentally flawed because it is an absolute measure: the standard that it uses—the cost of an economy food plan decades ago—stays the same, other than being adjusted for inflation, and therefore it doesn’t account for dramatic changes in lifestyles and living standards over the years. In other countries, governments track their progress by instead measuring relative poverty—comparing how much worse people are doing relative to the typical, or median, household. (For example, many countries in the European Union identify poor people as those households earning under 60 percent of the country’s median income.) This relative measure may better reflect the psychological reality of being poor—that people actually judge whether they are rich or poor based not on how much they make per se, but whether they make more or less than a relevant reference group—as the saying goes, whether they are “keeping up with the Joneses.” Other social scientists argue, however, that an absolute measure is superior because (regardless of the envy that some people feel for the better-off) society as a whole shouldn’t really care about who has more money, but rather whether everyone has a decent standard of living—which was the point of Orshansky’s original formula.
Who’s right? Clearly, measurement in sociology, especially measurement of abstract concepts like “poverty,” is a complex process involving many decisions by researchers, some easier to defend than others, and some inherently political in nature. As you figure out how to measure the concepts you’re interested in, keep in mind that social measures are almost never perfect and should always be open to rethinking and revision. Operationalization is probably one of the trickiest components of basic research methods. Don’t get frustrated if it takes a few drafts and a lot of feedback to get to a workable specification of your measurement procedures. And be sure to pilot test, pilot test, pilot test!
Conceptualization and Operationalization in Qualitative Research
If you were a quantitative researcher studying masculinity, you might use a battery of survey questions like the Bem Sex Role Inventory to operationalize this concept in your study. If you were doing in-depth interviews, however, the strategy you adopt would probably be very different. Qualitative research takes a more open approach toward defining the concepts relevant to a particular study, and a qualitative interview is much less structured than a survey interview. You might start off with a tentative definition of contemporary masculinity based on the past literature. You could then use that working definition to come up with an initial set of questions for interviewees. After talking to people, you might add questions—on the fly during an interview or afterward to prepare for the next interview—to refine or expand your understanding of the relevant concepts.
The ways that qualitative sociologists define their concepts and operationalize them often evolve over the course of their research. When conducting in-depth interviews, for example, they may ask a set of recurring questions to measure particular concepts of interest, but they will probe more deeply into areas of interest and even change their list of questions as they gather more information. Sociologists employing ethnographic observation may start with certain definitions in mind as they categorize the behaviors they see in the field, but they will try to refine those conceptualizations with every new observation. Ultimately, the concepts in a qualitative study will be defined by the researcher’s interpretation of what interviewees say or what the researcher observed, and their ways of measuring those concepts may change in line with that shifting understanding.
As a qualitative researcher, you should be prepared for the degree of improvisation and adaptation required in this work of continually reconceptualizing and reoperationalizing whatever you are studying. As we will elaborate on in the later chapters devoted to qualitative methods, you typically want to seek out new ideas and possibilities that emerge from your fieldwork rather than sticking stubbornly to any set theoretical playbook you had when you started your study.
The Bell Curve and Its Critics, by Andrew Park
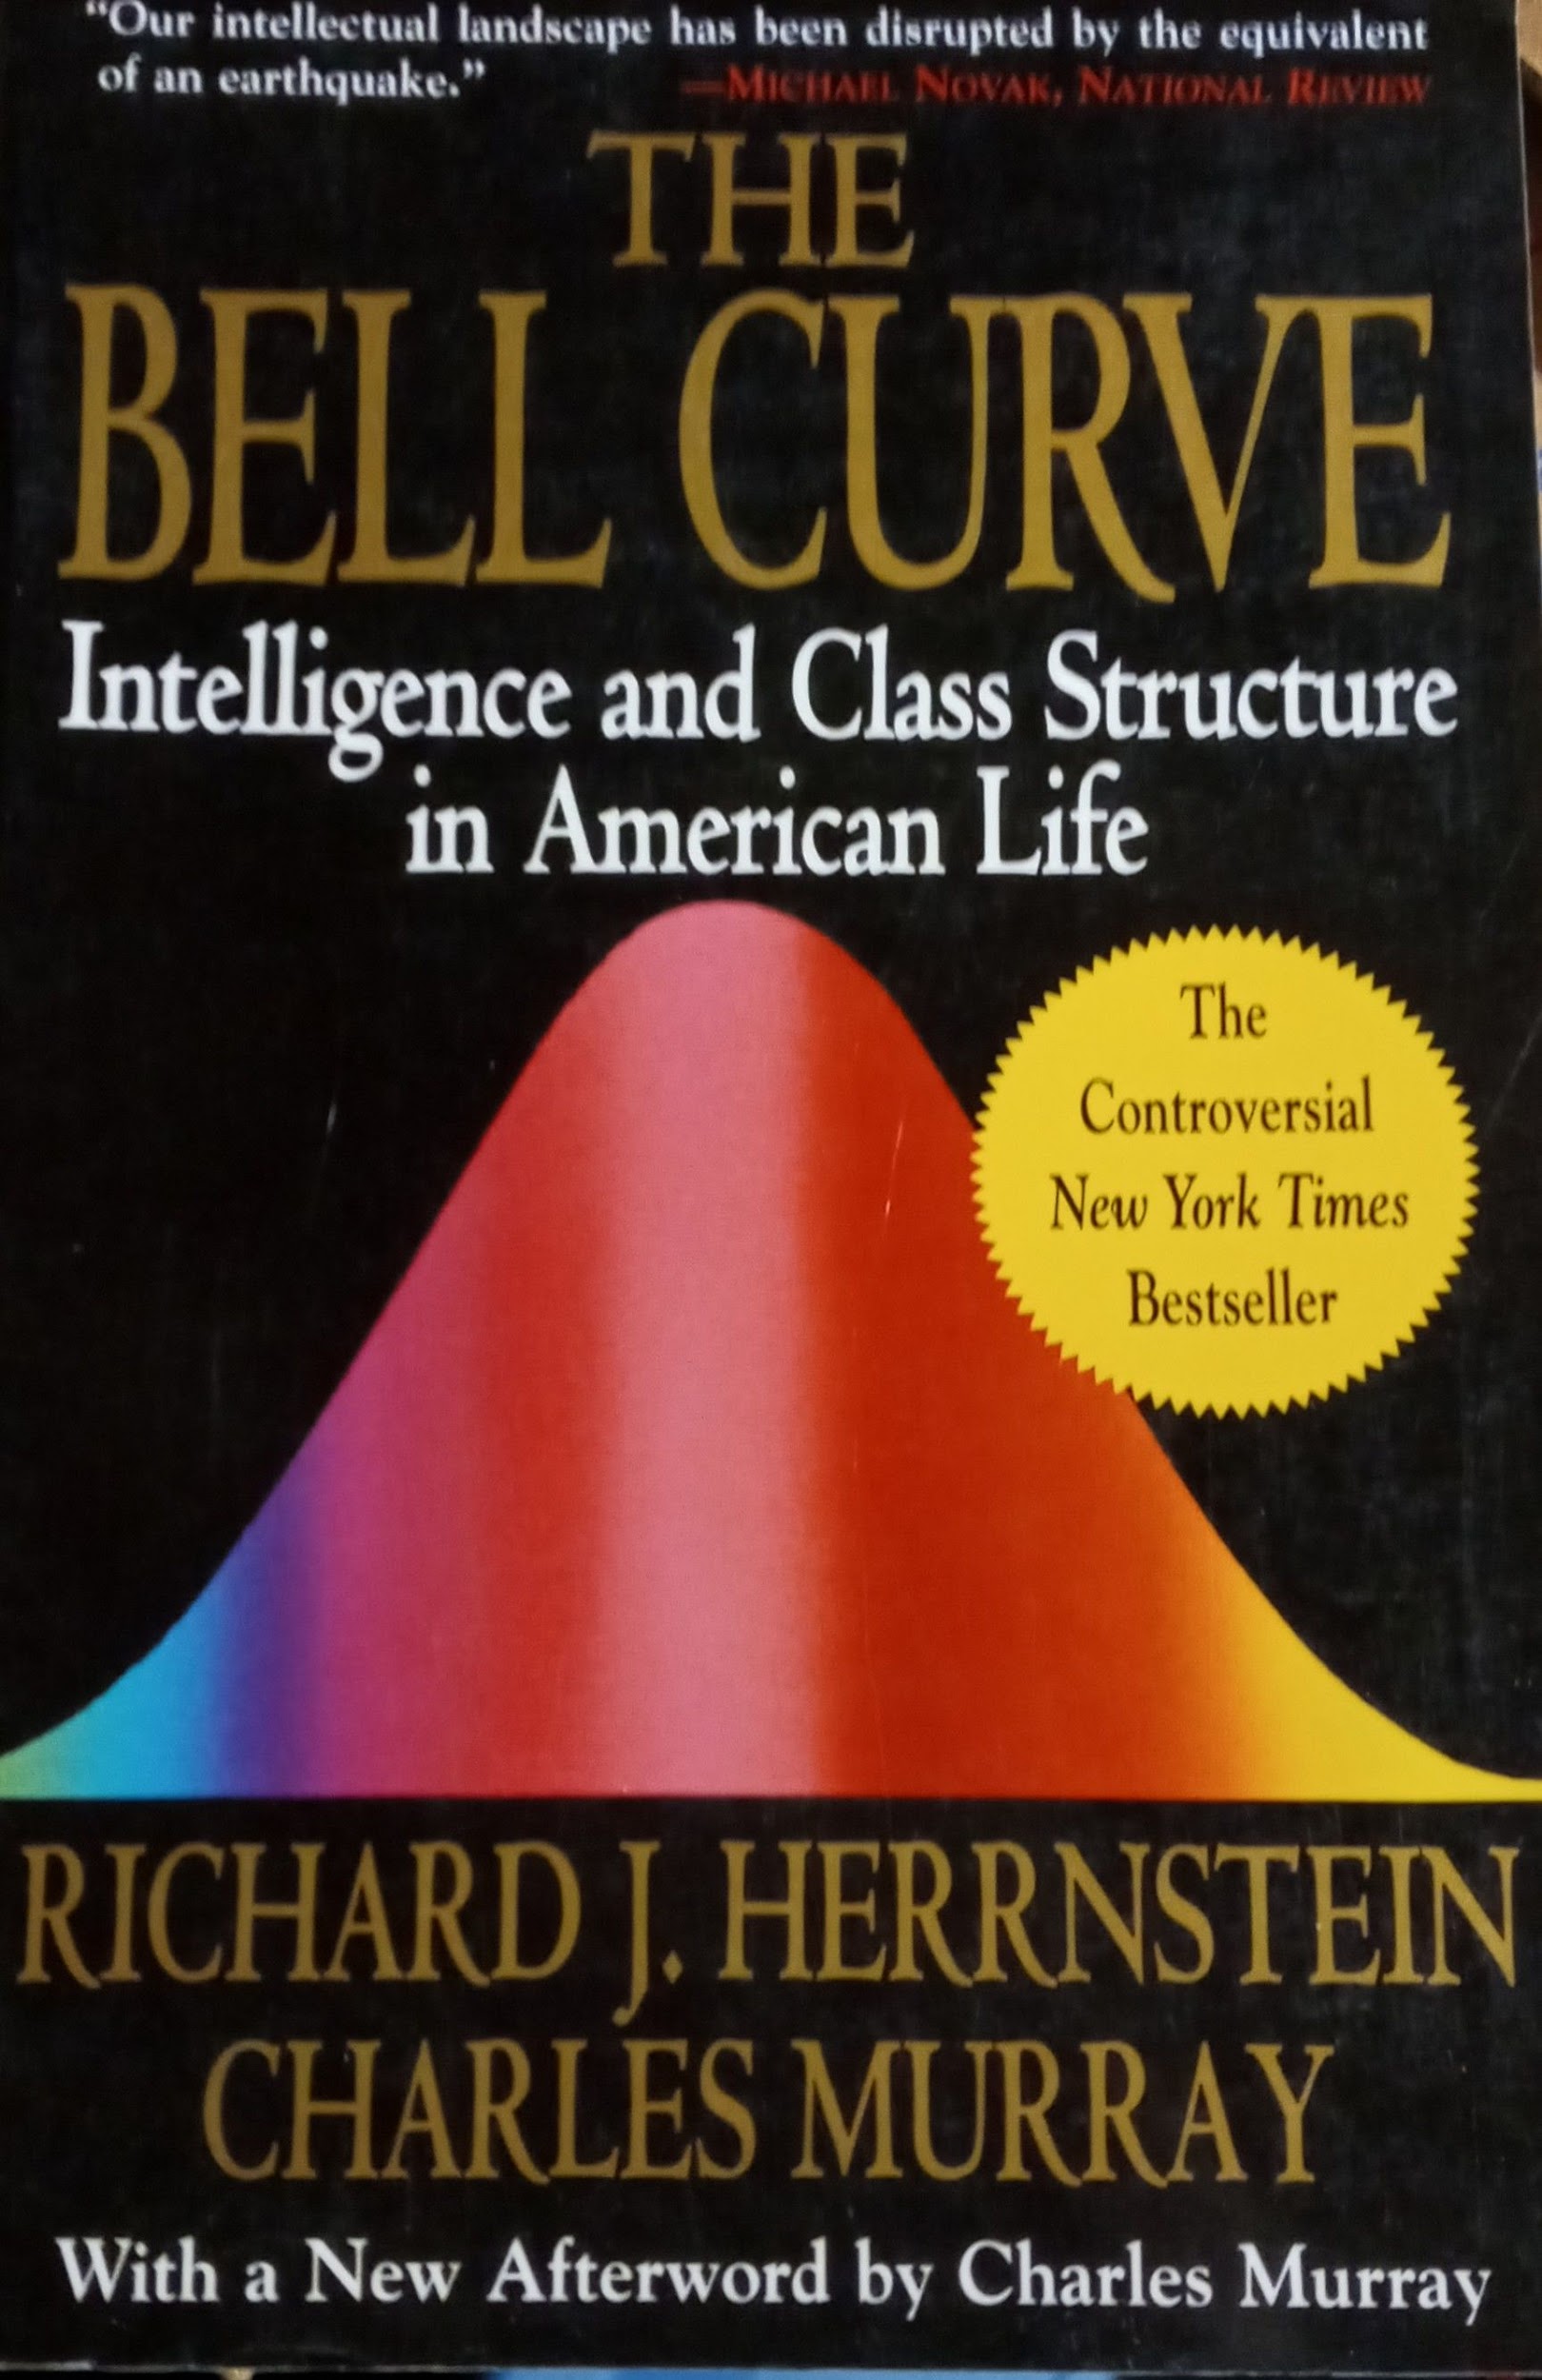
In their controversial book The Bell Curve: Intelligence and Class Structure in American Life (1994), psychologist Richard J. Herrnstein and political scientist Charles A. Murray described an America that was increasingly divided between a wealthy, well-educated elite and an impoverished underclass. That view of inequality is actually in line with the view of many sociologists today, who in recent decades have written extensively about the country’s growing economic and cultural divides. What made The Bell Curve so inflammatory was what it argued was driving this rising inequality: genetically based differences in intelligence. Methodological problems in Herrnstein and Murray’s research drew widespread criticism at the time—including from prominent sociologists—yet three decades later, the book continues to find audiences supportive of its arguments.
The Bell Curve argued that people’s life trajectories in terms of earnings and well-being were better explained by their measured levels of intelligence, rather than their family background, and that intelligence was largely an inherited trait fixed at birth. Herrnstein and Murray analyzed the responses of thousands of respondents in the National Longitudinal Survey of Youth (NLSY), a panel study that tracks the same individuals over many years. They set out to discover whether any correlation existed between the respondents’ scores on an IQ test and various negative outcomes later in their lives, such as becoming poor, unemployed, or a high school dropout. Furthermore, they wanted to evaluate whether IQ scores were a better predictor of respondents’ outcomes than the socioeconomic status of their parents. They concluded that IQ scores were more decisive—for instance, 30 percent of the respondents who scored in the bottom 5 percent of the IQ test ended up poor, whereas only 24 percent of those whose parents were poor ended up poor as well. Herrnstein and Murray also noted racial differences in IQ scores, which they suggested were also tied to genetic differences.
In Herrnstein and Murray’s view, the stronger influence of IQ scores on life outcomes meant that any existing racial and class inequalities were more the result of differences in actual ability than discrimination or a lack of opportunity. Indeed, Herrnstein and Murray took their findings to mean that social policies to improve access to educational and other opportunities for less advantaged groups were doomed to failure—what ultimately mattered in determining people’s later life outcomes was the genes passed down to them, not the environment they grew up in.
A team of sociologists—Claude S. Fischer, Michael Hout, Martín Sánchez Jankowski, Samuel R. Lucas, Ann Swidler, and Kim Voss—published a book, Inequality by Design (1996), which critiqued Herrnstein and Murray’s work on a number of levels. First, although Herrnstein and Murray defined intelligence as “a general capacity for inferring and applying relationships drawn from experience,” the sociologists questioned any broad conceptualization of “general intelligence,” given how many different dimensions it can conceivably cover—from mental quickness, to problem-solving ability, to creativity—with some of these forms of intelligence not necessarily related to the others.
Even if we assume there is such a thing as general intelligence, the way the Bell Curve operationalized this concept was flawed as well, the sociologists wrote. The IQ test referenced in The Bell Curve is the Armed Forces Qualifying Test (AFQT), a test that is used to determine enlistment eligibility and is composed of sections evaluating arithmetic reasoning, mathematics knowledge, paragraph comprehension, and word knowledge. But Fischer and his collaborators argued that the AFQT really measures “schooling,” rather than “intelligence”—it tests basic knowledge and foundational skills taught in primary school or in children’s home environments. If students from better-off households have access to more effective schooling or more nurturing home environments, then the test is at least partly measuring their social advantages, not just their underlying smarts. For a similar reason, the low IQ scores of African Americans and Hispanics relative to whites and Asian Americans really demonstrate their low social status rather than any genetic differences, the sociologists concluded. Any subjugated group—whether Korean minorities in Japan or Polish Jews in early twentieth-century America—comes to be stereotyped as innately unintelligent, they pointed out; once a group’s relative social status improves—and thus their access to opportunities widens—those “intelligence” inequalities disappear.
Finally, Fischer and his fellow sociologists took issue with Herrnstein and Murray’s actual empirical analysis. The way that Herrnstein and Murray operationalized environmental factors was much too blunt and narrow, they argued. Beyond the socioeconomic status of parents, other variables—such as parental education, geographic location, and number of siblings—needed to be controlled for; otherwise, any measured correlation between people’s IQ scores and their later life trajectories might actually be masking the influence of those confounders. When such environmental factors were accounted for, the measured effect of IQ scores on the risk of one day becoming poor or experiencing other negative outcomes dwindled away, the sociologists found.
Fischer and his colleagues asked to debate Murray on the merits of the Bell Curve, but he has never taken them up on the offer (his coauthor Herrnstein died in 1994). Almost three decades later, though, the Bell Curve continues to draw a following, with Murray’s 2017 unapologetic defense of the Bell Curve on a popular podcast unleashing another wave of debate over it. This time, psychologists Eric Turkheimer, Kathryn Paige Harden, and Richard E. Nisbett weighed in. Unlike Fischer and his collaborators, the psychologists—who work regularly with intelligence tests in their own research—were less skeptical about such kinds of testing, which they point out “can be meaningful and useful even if an essential inner [general intelligence] doesn’t exist at all.” However, recent research has only underscored, they said, the point that IQ is not a fixed quantity but rather responds markedly to environmental factors. Studies find that children adopted from poor homes into affluent ones experience 12- to 18-point IQ gains. Test score gaps between African Americans and whites have shrunk over the decades. In a phenomenon known as the “Flynn effect” (named for the IQ researcher James Flynn), IQ has increased dramatically in many countries in recent decades—by 18 points in the United States from 1948 to 2002.
These findings all suggest that changes in people’s social environments can significantly affect their IQ scores. More broadly, they make us question whether the ways we social scientists routinely operationalize intelligence truly capture the underlying concept—assuming that there really is such a thing as “general intelligence” to begin with.
Key Takeaways
- The typical steps in the conceptualization-operationalization-measurement process in quantitative research involve developing a research question, defining the key concepts related to that question, and deciding on operational definitions of those concepts—that is, how exactly to measure them in the real world.
- Using overly narrow measures can lead to blind spots in our understanding of social life. We can focus just on those metrics and ignore other things that may be more important or actually a better gauge of the underlying concept we’re interested in.
- The measurement process in quantitative and qualitative research differs in that qualitative research often involves the continual revising of procedures and operational definitions as more data is collected.
- Even here, however, what might seem to be a straightforward question is not: as it turns out, most people who say they are “independent” tend to vote for one party—sometimes overwhelmingly so—even though they don’t personally identify as a Democrat, Republican, or something else (Laloggia 2019). ↵
- For more background on critiques of GDP as a measure of economic progress, see Stiglitz (2020). ↵
- Note that when social scientists measure poverty by income, they typically look at the incomes of households—all the people who live together—rather than individuals. This is another reason that doing a thorough literature review is important; you should figure out what the standard approach in your area of study is. ↵
