
15. Materials-Based Methods
15.1. Content Analysis
Learning Objectives
- Define content analysis.
- Describe qualitative and quantitative strategies employed in content analysis.
- Understand how to present the results from content analysis.
As we noted earlier, content analysis is a materials-based research method that focuses on texts and their meanings. Sociologists use a more expansive definition of “text” than the word typically has. In a research context, the content being analyzed is essentially any recorded communication. This would obviously include actual written copy, such as news articles or email messages, but we can consider content that we might see or hear—such as a speech, dance performance, television show, advertisement, or movie—to be “texts” as well. Table 15.1 provides some examples of the kinds of data that sociologists have studied using content analysis techniques.
Table 15.1. Examples of Content Analysis
|
Data |
Research Question |
Author(s) and Year of Publication |
|
Spam emails |
Is the frequency of apologies from advertisers in unsolicited emails different in the U.S. and Korea? |
Park, Lee, and Song 2005 |
|
James Bond films |
How are women portrayed in James Bond films, and what broader lessons can be drawn from these portrayals? |
Neuendorf et al. 2010 |
|
Console video games |
How is male and female sexuality portrayed in best-selling console video games? |
Downs and Smith 2010 |
|
News articles |
What kinds of framing contests emerged in the news about Colin Kaepernick’s NFL protests against racial oppression and police brutality? |
Boykoff and Carrington 2020 |
|
Pro-eating disorder websites |
What characteristics do websites that endorse and support eating disorders share, and what messages do they communicate to users? |
Borzekowski et al. 2010 |
One thing you might notice is that the data sources described in this table are primary sources. As you may remember from Chapter 5: Research Design, primary sources are original works representing first-hand experiences, often written by individuals who were present at a noteworthy event or had relevant experiences. Primary sources that could be studied through content analysis include personal journals, emails, letters, government documents, speeches, television commercials, social media posts, and news articles published at the time of an event of interest.
While content analysis usually focuses on primary sources, there are also examples of studies that use secondary sources (which draw upon primary sources for information, such as academic publications, biographies, and news articles that review other media or research) and tertiary sources (which summarize the results of secondary sources). With these sources, researchers might be interested in how the person or persons who generated the secondary or tertiary source reached their conclusions about the topic in question, or how their decisions about presenting information might shape people’s understandings. For example, Myra Marx Ferree and Elaine Hall (1990) conducted a content analysis of introductory sociology textbooks to learn how students were being taught sociology. As part of their study, the researchers examined the images being presented to students and what messages they conveyed. They concluded that “women were not represented in numbers proportionate to their distribution in the population” and people of color “would have been numerically underrepresented” in images had the textbooks not included chapters specifically on race (Ferree and Hall 1990:529, 528).
Sometimes students new to research methods struggle to grasp the difference between a content analysis of primary scholarly literature and a review of literature on a sociological topic. As we discussed in Chapter 5: Research Design, a literature review examines sources to understand what we know and don’t know about a particular topic. These sources are typically peer-reviewed, written by trained scholars, and published by an academic journal or press. They are primarily papers that elaborate on scholarly theories or present empirical research conducted using accepted techniques of data collection and analysis for the discipline. The researcher synthesizes these sources to arrive at some conclusion about social scientists’ overall knowledge about a topic—often as a prelude to designing their own study on that topic.
A content analysis of research studies would use its sources to pursue very different questions. In short, it would be a “study of the studies” as opposed to a “review of studies.” For example, a content analysis of scholarly literature might ask whether the top-ranking journals in a particular discipline disproportionately publish work by men. The researcher might gather a sample of articles published in different journals and count their authors by gender (though this may be a tricky prospect if relying only on names to indicate gender). Another content analysis of academic studies might examine whether and how the topics that scholars study go in and out of style. A researcher tackling this research question could look at the articles published in various journals, code the topics they cover, and see if there is any change in the most popular topics over the years. Unlike with literature reviews, the researchers in these examples are not examining the content of their sources to identify a gap in the literature and design a study around it. Instead, they are looking to learn about what the publication of these articles says about the scientific community that published them.
Qualitative versus Quantitative Approaches to Content Analysis
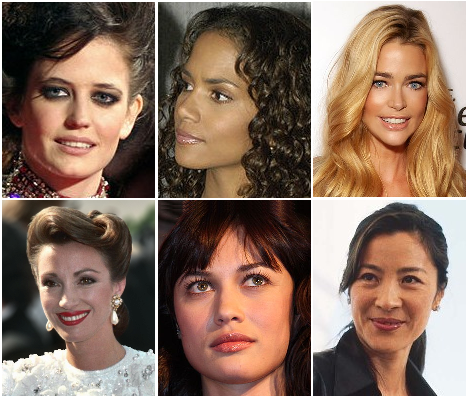
Content analysis can be quantitative or qualitative, and often researchers will use both strategies to strengthen their investigations. Quantitative content analysis focuses on variables whose characteristics can be counted. For example, Kimberly Neuendorf and her colleagues (2010) reviewed 20 films featuring the fictional British spy James Bond. They examined the portrayals of women across the films—195 female characters in total—and tracked particular details about each character. For example, a variable they called “role prominence” variable assessed whether the female’s part was minor, medium, or major. Other variables counted the number of times weapons were used by and against a female character. The approach in such a quantitative content analysis uses the same techniques we covered in Chapter 14: Quantitative Data Analysis. Neuendorf and her coauthors, for instance, calculated frequencies for their three categories of “role prominence,” finding that 52 percent of female roles were minor, 30 percent medium, and 17 percent major. They generated both univariate and multivariate statistics—for instance, determining that 25 percent of female characters had a weapon used against them, and their own use of weapons was related to their levels of sexual activity within the films.
In qualitative content analysis, the aim is to identify themes in the text and examine the underlying meanings of those themes. Tony Chambers and Ching-hsiao Chiang (2012) used such an approach in their content analysis of open-ended comments in the National Survey of Student Engagement. First, the researchers identified passages in the comments where students appeared to be raising issues standing in the way of their academic success. Through the coding process (see Chapter 11: Qualitative Data Analysis), they settled upon certain key themes across these passages, which could be broadly grouped into categories of academic needs, the campus environment, financial issues, and student services. The approach here was inductive, in that the researchers did not determine these themes beforehand, but rather allowed them to emerge during the coding process. Ultimately, this analysis allowed Chambers and Chiang to highlight certain disconnects between the goals of colleges and universities and students’ actual experiences.
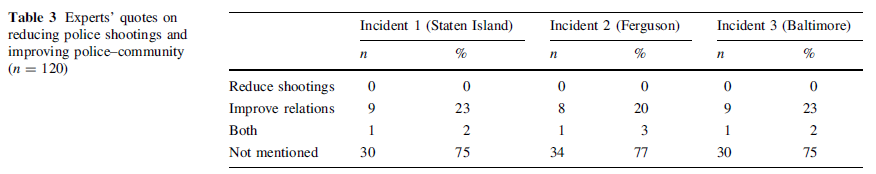
Note that both quantitative and qualitative approaches can easily be used in the same content analysis. For example, Vaughn Crichlow and Christopher Fulcher (2017) analyzed coverage in the New York Times and USA Today about the deaths of three African American men while they were in police custody: Eric Garner, Michael Brown, and Freddie Gray. The content analysis focused on the quotes of experts (public officials and pundits) that appeared in these news articles. First, the researchers examined the quotes to generate themes, and then they tallied the numbers of quotes that fit the noteworthy themes they identified (as shown in this example, content analysis can move rather seamlessly from inductive qualitative analysis to deductive quantitative analysis). As shown in Figure 15.1, the analysis found that the experts quoted across these articles rarely discussed strategies to reduce police shootings and improve police-community relations in communities of color.
One important thing to note about content analysis is the critical importance of developing a comprehensive and detailed codebook. For the study of James Bond films, for instance, the eight coders assigned values to the study’s variables drawing upon a codebook the authors had created well before any analysis began. Especially when many people are involved with coding, there needs to be a shared understanding of what exactly the codes mean to avoid divergent interpretations of the same data and maintain inter-coder reliability (a topic we will return to).
Defining the Scope of a Content Analysis

For many studies that rely on content analysis, setting boundaries on what content to study is challenging because there is just so much content available to researchers. Consider a study by Jules Boykoff and Ben Carrington (2020) that analyzed media coverage of American football player Colin Kaepernick’s protests in 2016. By kneeling during the playing of the national anthem at numerous NFL games, Kaepernick sought to make a public statement about ongoing police brutality against African Americans. For their study of reactions to these protests, researchers examined “the media framing contests that emerged between Colin Kaepernick and his supporters on one side and his detractors on the other, including President Donald Trump” (Boykoff and Carrington 2020:832).
If the idea is to study how the media presents a particular issue relating to racial inequality, however, we need to be very specific about what we mean by “media.” The term covers a lot of territory, even if we restrict it to just “mass media”—news articles, radio and television broadcasts, and the like. Conceivably, we could analyze reports about Kaepernick in hundreds of sources across a wide range of media platforms. Clearly, however, that is not a realistic option for any study, even a well-funded one.
To make our content analysis feasible, we need to precisely define the scope conditions of our study. In Chapter 3: The Role of Theory in Research, we talked about how all theories have scope conditions, which tell us where the theory can and cannot be applied. Among other things, a theory is constrained (delimited) based on the contexts where it has been studied empirically. For instance, a theory developed from data in the United States may not necessarily apply in other societies. When we are designing an empirical study, we need to think about the reverse consideration—what can we feasibly study? How should we set the boundaries of our data collection? These are the scope conditions of our study.
For their study, Boykoff and Carrington decided to study print and online stories from newspapers—thereby reducing the vast category of “media” to the smaller (and dwindling) subcategory of “newspapers.” But which newspapers? In 2018, when Boykoff and Carrington were working on their analysis, there were 1,279 daily newspapers operating across the country. Though this was fewer than in previous years, examining multiple articles in all of these publications would clearly have been an overwhelming task. Instead, the researchers decided to choose the four national newspapers with the highest circulation numbers—USA Today, the Wall Street Journal, the New York Times, and the Los Angeles Times—plus the seventh-ranked paper, the Washington Post. Their rationale for the first four had to do with the national reach and influence of these papers. They choose to include the lower-circulation Post as well because of its in-depth coverage of issues and its numerous online articles. Note that for any content analysis, you should be specific in a similar way about your rationale for including or excluding certain sources. Always provide a clear and compelling justification—detailed at length in your paper’s methods section—for these methodological choices, rather than just saying these were the most convenient sources to analyze. Convenience can be an important consideration, but you should be able to speak thoughtfully about the benefits and drawbacks of the boundaries you set.
Even after Boykoff and Carrington settled on five newspaper sources to analyze, they still had another set of methodological decisions to make: what particular time period should they set for the Kapernick-related articles they would analyze? Clearly there would be no coverage before the start of Kaepernick’s protests on August 14, 2016, so they could easily set a starting point for their analysis. The ideal ending point was less self-evident, however, since newspapers obviously don’t coordinate with each other about when to stop coverage of a story. For their study, the researchers chose to examine news articles within a two-year period ending on August 14, 2018. By that time, they reasoned, the controversy had diminished, and no other NFL team had signed Kaepernick. This brings up another important point about setting scope conditions for a study: sometimes the decisions can be more or less arbitrary. While a two-year period is reasonable and justifiable, you could imagine how other researchers might make a decent case for a longer or shorter period. As a researcher, you will need to trust your own judgment and be able to defend your decisions, even if they are somewhat a matter of personal preference.
Now that Boykoff and Carrington had settled on a time period for their study, were they finally done? No. They still had to decide whether they should study all articles published during this period or be more selective. They decided to apply certain inclusion criteria to make it more likely that the articles they analyzed would contain material relevant to their research question of how the media framed Kapernick’s actions. In their first sweep, they searched the archives of each newspaper for the terms “Kaepernick” and “protest.” Then they narrowed that list to just those articles that were at least five paragraphs long and mentioned Kaepernick somewhere in the first five paragraphs of text, reasoning that these articles would be more likely to say something substantive about the controversy. By defining the scope of their content analysis in all these ways, Boykoff and Carrington ensured that closely reviewing their materials was something they could do with a reasonable amount of time and effort. At the same time, they maximized the likelihood that their analysis would capture the vast majority of newspaper articles that put forward a useful (for their research purposes) perspective on the protests.
Let’s look at another example. We previously mentioned a published content analysis of gender and racial representations within the images published in introductory sociology textbooks (Ferree and Hall 1990). To identify sources for their analysis, the authors consulted the 1988 volume of Books in Print, a comprehensive database of books published in a particular year. They searched the database with the keywords “sociology” and “sociological” and obtained the most recent editions of textbooks whose titles contained those words.
Through this process of culling, the authors dramatically reduced the number of textbooks they had to analyze. However, they had another decision to make: should they analyze all the content within each textbook? For their research purposes, they decided to ignore the written content in the textbooks and instead focus on the accompanying images. Their reasoning here—which, as with any methodological decision, could be debated—was that the photographs and illustrations vividly captured “the currently acceptable conceptualization of race and gender, as constructed in introductory sociology textbooks by authors and publishers” (501). Because of this specification, the researchers were able to eliminate textbooks that did not contain any photographs or illustrations. Their final sample included 33 introductory sociology textbooks with a total of 5,413 illustrations, all of which were subjected to analysis.
Even after you have defined the overall scope of your content analysis, you can be even more selective about the texts you examine by applying a sampling process. Say that your research question is, “How often do presidents of the United States mention domestic issues as opposed to international issues in their State of the Union addresses?” Luckily, a comprehensive list of State of the Union addresses that includes their full text is easy to locate on the internet. With all these sources readily available to you, you might decide you want to analyze every single speech. In this case, you would not need to select a sample. An examination of all of the possible elements in a population is called a census. The content analysis of James Bond films we mentioned earlier fits this category (Neuendorf et al. 2010). The authors conducted a census of every James Bond film available to them—from Dr. No (1962) starring Sean Connery, to Die Another Day (2002) starring Pierce Brosnan. (Their analysis went up to 2005, so they did not cover any of the Daniel Craig films.) Given the relatively small number of films they needed to analyze—just 20—the researchers were able to include all the elements in their target population.
Indeed, what resources you have available to you will often dictate whether you can study all possible sources or need to draw a smaller sample. Even though it is easy to identify and locate all 200-some State of the Union addresses, for instance, you may not have the time or energy to analyze every single one. For the hypothetical study mentioned earlier, let’s say you look over some of the State of the Union addresses, and given how long and dense many of them are, you decide you can only analyze 20 of them. So how do you decide which 20 to look at?
You can select a sample by using either probability or nonprobability sampling methods, as described in Chapter 6: Sampling. Let’s walk through the process of drawing a simple random sample of 20 State of the Union addresses:
- As of this writing, there have been 233 State of the Union addresses. So you should start by creating a list of all 233 addresses and then numbering them from 1 to 233.
- Generate 20 random numbers in the range of 1 to 233 using a website such as random.org.
- Go down your list of random numbers, choosing State of the Union addresses whose numbering in your original list of addresses corresponds to each random number. Ignore any duplicate numbers (you’ll need to generate a new random number to replace it) and keep going until you have selected 20 addresses.
A key advantage of using probability sampling techniques, as you might remember, is that they allow you to generate statistics that estimate the population values—giving you a sense of how certain characteristics are distributed and whether certain relationships exist in the actual population. So if you selected your 20 State of the Union addresses through a simple random sampling procedure (or some other probability sampling technique), you would be able to generalize the results from your sample of 20 addresses to the population of all 200-some addresses. If you found that text relating to international issues was just a small percentage of the total text across your 20 State of the Union addresses, for instance, you could with some confidence say that the same percentage applied to discussion of international issues across all State of the Union addresses.
Content analyses can also rely on samples that were not drawn using probability sampling techniques. As we described in Chapter 6: Sampling, the best choice among nonprobability sampling techniques is usually purposive sampling, which uses theory to guide the researcher in deciding upon what elements to include. For the example research question we’ve been considering that examines the extent to which presidents discuss international and domestic issues during their State of the Union addresses, a purposive sample might include the most recent 10 addresses delivered in wartime and the most recent 10 delivered in peacetime. This sampling choice would allow you to understand how the prevailing context of war or peace influences how presidents talk about international issues in their public statements. Note, however, that your nonprobability sample here would not allow you to make statistical estimates of population parameters for all 233 addresses.
Even if you choose to study all the units in your population of interest, you may still have a use for sampling techniques. Researchers often select smaller samples from their populations in order to develop coding schemes. For example, Dina Borzekowski and her colleagues (2010) did a comprehensive internet search to identify 180 active websites that endorsed and supported eating disorders. Before they started going through all 180 websites, however, the researchers reviewed the existing literature and used it to develop a preliminary coding scheme that described a number of relevant variables that they might measure within the data. They then tested that proposed scheme on a random sample of 25 of the 180 websites. The data from this pilot test helped the researchers develop a codebook with detailed coding guidelines, which the team of six researchers then used to code the entire sample in a consistent fashion.
A similar approach of testing coding schemes with samples can be used for qualitative content analysis. After compiling their sample of newspaper articles, Boykoff and Carrington (2020:833) selected a random 30-article subsample to help them identify the frames that their media sources applied to coverage of Colin Kaepernick’s kneeling protests. One of the study’s authors and a research assistant carefully read all articles in that subsample and inductively generated a list of relevant frames. After consulting with one another, the researchers boiled down their list to seven predominant frames and three competing frames, which they then used to code the entire sample of 301 articles.
Coding in Quantitative Content Analysis
When researchers code a text for a content analysis, they are looking for two types of content: manifest and latent content. Manifest content has a more or less obvious significance to it. It presents a surface-level meaning that can be readily discerned. Latent content refers to the underlying meaning of the surface content we observe. Coding manifest content typically involves a highly structured process—think of the very precise ways, for example, that the study of James Bond films we mentioned earlier tallied the cases when women were targets of or wielders of weapons (Neuendorf et al. 2010). Qualitative researchers, however, are usually not interested in manifest content in itself, but as a stepping stone to deeper understanding, which they pursue with the coding of latent content.
Say that we are studying advertisements for kitchen utensils that have been published in magazines over the last several decades. One type of manifest content to code across these ads might be the stated purpose of each featured utensil. For instance, the text in the ads might emphasize how the utensil—say, a potato masher—makes preparing mashed potatoes a cinch for Thanksgiving dinners. Or it might focus instead on the general versatility and efficiency of that potato masher in dealing with russet, red, and Yukon Gold potatoes, or even the dreaded yam. We could also make note of how users of the utensils are depicted within the ads, using codes like “entertaining at home” when we see someone in the ad using the utensil to cook for a large gathering (refer to Chapter 11: Qualitative Data Analysis for a review of how to write up codes). In turn, one set of latent codes that could emerge from these manifest codes would be our assessment of the lifestyles that the ad—by playing up certain features of the utensil—is promoting. For instance, we might see a shift over the years in the stated purpose of the utensils and the depictions of its users across the ads we are analyzing: from an emphasis on utensils designed to facilitate in-home entertaining to those designed to maximize efficiency and minimize time spent in the kitchen. We might theorize that this shift reflects a corresponding shift in how (and how much) people spend time in their homes. (See Video 15.1 for one take on this woefully understudied topic of kitchen utensils.)
Video 15. 1. What Kitchen Utensils Say about Society. In the first part of this segment from the PBS documentary People Like Us, satirist Joe Queenan riffs on how kitchen utensils can serve as markers of social class—in essence, an argument that one might explore through the latent content of kitchen utensil advertisements, as we describe.
To record the observations we make during content analysis, we typically rely upon a code sheet, sometimes referred to as a tally sheet. Code sheets allow us to apply a systematic approach to our analysis of the data. For instance, let’s say we want to conduct a content analysis of kitchen utensils—this time, not the advertisements about them, but the utensils themselves (remember that any “text”—even physical objects—can be studied in a content analysis, so long as the object conveys meanings we can analyze.) We happen to have access to sales records for kitchen utensils over the past 50 years. Based on these records, we generate a list of 50 utensils, the top-selling utensils in each year. For each utensil, we use our code sheet (as shown in Table 15.2) to record its name, culinary purpose, and price in current dollar amounts (note that adjusting for inflation is crucial whenever you compare monetary amounts across years). We might also want to make some qualitative assessments about each utensil and its purpose—say, how easy or hard it is to use. To rate this difficulty of use, we use a 5-point scale, with 1 being very easy and 5 being very hard. The specific criteria we use to determine this difficulty of use should be described in our codebook, along with any other instructions for coding the study’s variables. (For space reasons, the sample sheet contains columns only for 10 years’ worth of utensils; if we were to conduct this project—and who wouldn’t want to learn more about the history of kitchen utensils?—we’d need columns for each of the 50 items in our sample.)
Table 15.2. Sample Code Sheet for Study of Kitchen Utensil Popularity Over Time
| 1970 | 1971 | 1972 | 1973 | 1974 | 1975 | 1976 | |
| Utensil name | |||||||
| Utensil purpose | |||||||
| Price (in current dollars) | |||||||
| Ease of use (1 being easy, 5 being hard) | |||||||
| Other notes |
As our example shows, a code sheet can contain both qualitative and quantitative data. For instance, our ease of use row will report our difficulty rating for each utensil, a quantitative assessment. We will be able to analyze the data recorded in this row using statistical procedures of the sort outlined in Chapter 14: Quantitative Data Analysis—say, by calculating the mean value of “ease of use” for each of the five decades we are observing. We will be able to do the same thing with the data collected in the “price” row, which is also a quantitative measure. The final row of our example code sheet will contain qualitative data: notes about our impressions of the utensils we are examining. For the data in this row, conducting open and focused coding (as described in Chapter 11: Qualitative Data Analysis) is an option. But regardless of whether we are analyzing qualitative or quantitative data, our goal will be the same: identifying patterns across our data.
Let’s delve more deeply into what the coding of manifest content looks like, drawing from the example of an actual published paper. In her study of scouting manuals published by the Boy Scouts and Girl Scouts, Kathleen Denny (2011) sought to understand how these two organizations communicated different expectations about genders. As we noted, the measurement process should be carefully controlled for a quantitative content analysis, and Denny was very specific in how she conceptualized and operationalized a key question in her study: did the Boy Scout and Girl Scout manuals differ in the types of activities that scouts participated in? (Refer to Chapter 7: Measuring the Social World for a review of the conceptualization and operationalization stages.)
First, Denny defined an “activity” as a set of instructions that the scout must accomplish in order to be awarded a particular badge, and “participate” as attempts to fulfill the required instructions. In terms of how the manuals differed, Denny focused on a distinction she made between “others-oriented” and “self-oriented” activities, which she conceptualized as follows:
I refer to activities explicitly instructed to take place with or for others as “others-oriented activities” and activities either explicitly instructed to take place individually or not explicitly instructed to take place in groups as “self-oriented activities.” An example of a self-oriented activity is, “Draw a floor plan of your home,” for the boys’ Engineer badge …. An example of an others-oriented activity for the girls is, “In a troop, group, or with other girls, brainstorm a list of ways you can help the environment,” for the Your Outdoor Surroundings badge … (Denny 2011:34)
Next, Denny decided on operational definitions for her concepts of “self-directed” and “others-directed” activities. Later in her article, she goes into detail about how these variables were measured—again, crucial context for any content analysis:
Activities coded as self-oriented are not necessarily required by the organization to be executed alone. Activities were coded as self-oriented if the activity description specifically indicated that it should be accomplished individually or implied individual action (e.g., reading) or if the activity instructions did not specifically call for the presence of others. For instance, the activity “Visit the newsroom of a newspaper” … was coded as a self-oriented activity because the instructions do not include others, whereas the activity “In a troop, group, or with other girls, brainstorm a list of ways you can help the environment” … was coded as others-oriented because the instructions expressly call for others to be present. (Denny 2011:44)
Denny reviewed 1,763 badge activities across the Boy Scout and Girl Scout handbooks. By using a structured coding process to analyze the handbooks’ manifest content and count up the activity types they signaled, she was able to conclude that boys were offered more self-oriented activities, while girls were offered more others-oriented activities. (Since the time of Denny’s study, the Boy Scouts have rebranded their flagship program as “Scouts BSA” and started admitting girls to it, which may mean that the gender expectations in their handbooks have changed—yet another reminder that the context in which we conduct our analyses limits their scope.)
Denny was the only coder for her study, so she had to be especially scrupulous about consistently applying the measurement procedure outlined earlier. When two or more coders are involved, we have more checks in place to ensure the quality of the coding process—it is less likely to be the case that one coder’s biases (however unconscious) skew the study’s interpretations of the data. However, when multiple coders are involved, researchers must develop a very detailed coding manual and actively train all the coders to ensure consistency.
Let’s walk through how you should prepare to code content for a study, drawing as needed upon examples from the content analysis we mentioned earlier of James Bond films (Neuendorf et al. 2010), which used eight coders.
- Determine the variables to be measured in the analysis. One of the research questions in the content analysis of James Bond films was, “Is the amount of aggression aimed at a female character predicted by her physical characteristics, role prominence, sexual activity, and aggressive predispositions?” (Neuendorf 2010:750). Some of the variables in this question that needed to be measured were:
- If a person appears in the film, is that person a character?
- If the person is a character, what is their gender?
- If the person is a female character, how much aggression is aimed at her?
- If the person is a female character, what is the nature of her physical characteristics?
- Determine the possible attributes of each variable. Remember that attributes are the different categories for a given variable. In a content analysis, these are the options that coders can choose from. Specifically, they will code particular snippets of data as reflecting those attributes. For simple variables, this process of identifying attributes is pretty straightforward. In the Bond study, the “role prominence” variable—which indicated how major or minor a female character was in regards to events of the film overall—just had three attributes: minor, medium, or major. More complex multidimensional concepts, however, may require multiple variables to measure them. For example, the “physical characteristics” variable we just described needed to be measured using eight variables, including “hair color,” “hair length,” “glasses,” “body type,” and “level of attractiveness of physical appearance.”
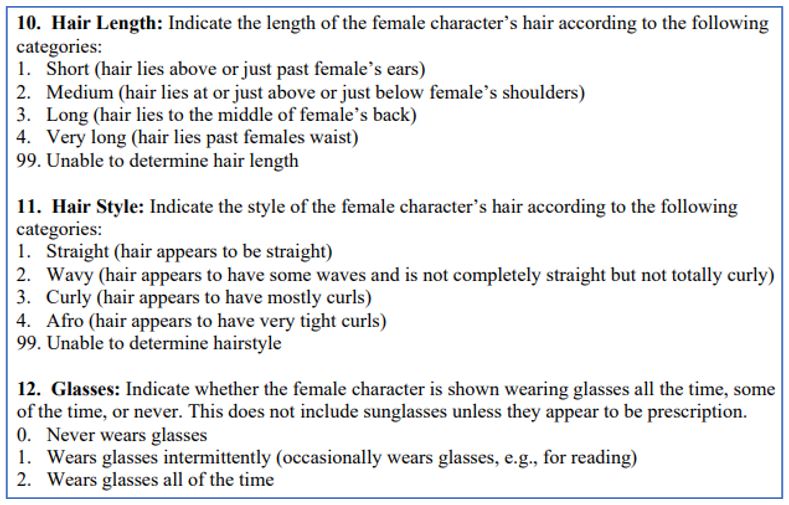
- Develop a coding manual providing precise instructions for coding. The coding manual should describe all of the study’s variables and give coders a complete understanding of how to make decisions during the coding process. This step is of paramount importance when multiple coders are used, which was the case in the Neuendorf study. (Figure 15.2 shows actual instructions from their full coding manual.) Even with just one coder, however, creating a set of clear instructions will promote consistency throughout the coding process.
- Test the coding instructions on similar materials to revise your coding manual and train multiple coders. Before you dive into your content analysis of your sources, it’s a good idea to take materials that are somehow comparable to those sources and try out your variable definitions on that content. You can then refine your coding manual based on the outcome of that trial run. Testing the instructions is especially useful when you have multiple coders involved. That testing can serve as part of the training for coders, in addition to whatever informal or formal instruction you wish to give them concerning the coding manual. You can also use the test to check the level of agreement among coders. (In the later section Reliability and Validity in Content Analysis, we’ll discuss how you go about calculating the inter-coder reliability of the coding process for a given study.) For instance, the Neuendorf study was able to evaluate the level of agreement among its eight coders by using a Bond film (Never Say Never Again, 1983) that was not in the actual study list because it was based on an earlier Bond film (Thunderball, 1961). This pilot test prompted the researchers to make several changes to the coding manual and have the coders attend additional training sessions. They conducted their final training using the 1967 version of Casino Royale, which featured James Bond as a character but had not been included on the study list because it was a spy parody not produced by the same company that produced the other Bond films.
For this study, the researchers were lucky to have two comparable films at their disposal that they could use to test their measurement procedures. If you find it hard to find a similar set of materials for such purposes, however, you can conduct a test on a source you intend to include in your study: do the trial run to refine your coding manual, delete the data, and then code the same film with the revised instructions.
Coding in Qualitative Content Analysis
Coding in qualitative content analysis is typically an inductive process. That is, researchers do not start out by precisely specifying relevant variables and attributes and creating detailed coding procedures. Instead, they let their ideas regarding conceptualization and operationalization emerge from a careful reading and consideration of the text (see Chapter 4: Research Questions for a fuller discussion of inductive analysis). In this and other ways, coding in qualitative content analysis follows much the same procedures that are used for other qualitative research methods, such as ethnographic observation and in-depth interviews. That said, keep in mind the earlier distinction we made between quantitative content analysis, which focuses on manifest content, and qualitative content analysis, which focuses on latent content. Rather than just counting more obvious details, qualitative content analysis tends to delve deeply into the data. The researchers immerse themselves in the text through careful reading, trying to get at its underlying meanings.
Sociologist Nikita Carney (2016) analyzed the Twitter debates that occurred after the police shot and killed two unarmed African American men, Michael Brown and Eric Garner, in 2014. In her paper she describes the straightforward qualitative data analysis process she followed:
I decided to use Twitter’s advanced search feature and take screenshots of selected results between December 3 and 7, 2014. The analysis process drew heavily from grounded theory [an inductive approach] in order to identify key themes…. I initially read through approximately 500 tweets from this time period to get a sense for the dialogue on Twitter at this moment in time. Based on this initial read-through, I loosely coded tweets based on whether they used ‘‘#BlackLivesMatter,’’ ‘‘#AllLivesMatter,’’ or both. I selected 100 tweets out of the initial sample of 500, consisting of approximately 30 to 35 tweets from each initial grouping that were representative of the larger sample. I conducted a close textual analysis on these 100 tweets, from which I developed more specific thematic groupings, including ‘‘call to action,’’ ‘‘conflict over signs,’’ and ‘‘shifting signs/discourse.’’ (Carney 2016:188–9)
Just as different people who read the same book will not necessarily have the same interpretation of the text, closely studying latent content is necessarily a subjective process. Qualitative researchers recognize this and often disclose their personal stances toward the research, in a process known as reflexivity (discussed earlier in Chapter 9: Ethnography). Carney’s paper includes a “personal reflexive statement” to this effect:
I closely followed news surrounding the deaths of Michael Brown and Eric Garner, among other victims of police violence, on mass media and social media. I also took to the streets with other activists and participated in acts of protest at my university on a daily basis. Rather than claiming to produce an ‘‘objective’’ analysis, I use my subjectivity to examine discourse as it unfolded on social media with the goal of better understanding the ways in which youth of color used technology to influence dominant discourse in the nation. (Carney 2016:181)
While content analysis often focuses on either latent or manifest content, the two approaches can be combined in one study. For instance, we previously discussed how Kathleen Denny’s content analysis of scouting handbooks examined manifest content—the descriptions of badge activities that could be categorized as “self-oriented” or “others-oriented”—and calculated which proportion of activities for the Boy Scouts and Girl Scouts fell into each category. But Denny also analyzed latent content in terms of how the handbooks portrayed gender. Based on this analysis, Denny (2011:27) argued that the girls were encouraged to become “up-to-date traditional women,” while boys were urged to adopt “an assertive heteronormative masculinity.” In her paper, Denny described the qualitative and inductive approach she took to arrive at this finding:
Rather than code the texts for the presence or absence of any particular trait, I assessed them holistically, attuned to themes and patterns that emerged having to do with the attitude or approach endorsed by the texts. I performed textual analyses of the girls’ and boys’ handbooks’ official statements as well as a focused comparison of a comparable pair of badges—the girls’ Model Citizen badge and the boys’ Citizen badge. I present findings from the comparison of the citizen badges because the nature of the activities offered in these badges is very similar, bringing gender differences into sharper relief. (Denny 2011:35)
Given the large amount of data that content analysis typically involves, it is often a good idea to conduct the coding using qualitative data analysis (QDA) software, which we described in Chapter 11: Qualitative Data Analysis. For instance, the content analysis mentioned earlier of undergraduate comments on a national survey (Chambers and Chiang 2012) used the NVivo software package to help researchers inductively generate codes and then consolidate, refine, and prioritize certain codes as they reviewed students’ answers to the survey’s open-ended questions.
Reliability and Validity in Content Analysis
As we noted earlier, having multiple coders can help address problems of subjectivity and bias that creep into a content analysis, but it also poses issues with inter-coder reliability (also known as inter-rater reliability, which we discussed previously in Chapter 7: Measuring the Social World). To ensure the reliability of their measures of different variables, projects that use multiple coders should discuss the degree to which different coders agreed upon how to code each variable in the study. As we will describe, there are statistics that researchers can calculate to convey the level of agreement and disagreement among coders. At the very least, any project involving coding needs to say something about the ways the researchers ensured that their findings were not the result of a very idiosyncratic or unreliable coding process. Even if one person acts as the sole coder, having one other person code a sample of the material will allow for at least some check of inter-coder reliability.
In the study by Kimberly Neuendorf and her collaborators (2010) of women’s portrayals in James Bond films, the researchers calculated two measures commonly used to assess inter-coder reliability: multiple-coder kappa and percentage agreement among coders. The corresponding statistics for each variable in their study are shown in Figure 15.3. “Percentage agreement” is the simplest measure of inter-coder reliability: in this study, it is the number of times that the eight coders involved in the study arrived at the same variable attribute for a particular observation (of one female character in one movie, for instance), divided by the total number of observations. The details of calculating kappa are beyond the scope of this textbook, but a kappa value of .40 or higher is generally considered to be acceptable.
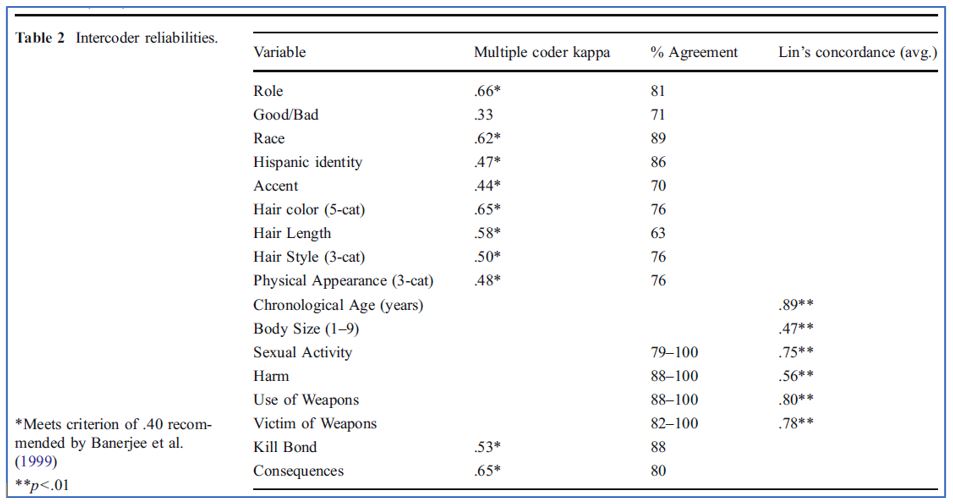
As shown in the figure, one variable—whether the female character was a “good” or “bad” person—did not meet the .4 threshold for the kappa statistic of reliability. This result isn’t surprising, given that coding the variable required a broad evaluation of whether the female character was “good” (exhibited behaviors that furthered Bond’s goals) or “bad” (exhibited behaviors that were at odds with Bond). In their paper, the researchers said they suspected that ambiguity may have arisen regarding females with minor or medium roles. They concluded that results related to this variable should be interpreted with caution. Note that the percentage agreement among coders was also low for the “good/bad” variable, but not as low as this reliability measure was another variable—whether the character had an accent—which highlights the fact that different inter-coder reliability measures can produce different results, and you may not want to rely on just one. Furthermore, just evaluating inter-coder reliability after the coding is done is not the best strategy; instead, you should test the reliability of your coding procedures before implementation, which will give you the opportunity to improve upon them and possibly keep your reliability measures high across all variables.
As you might remember from Chapter 7: Measuring the Social World, the validity of a measure refers to whether the measurement procedure actually measures the concept it is intended to measure. Several approaches to assessing validity are discussed in that earlier chapter, but we will mention two here that are highly relevant to content analysis. Face validity tells us whether it is plausible that our operational definition of a variable measures the concept it is intended to measure: “on the face of things,” does our particular measure capture the essence of that concept? In The Content Analysis Guidebook, Kimberly Neuendorf (2017:125)—the lead author of the Bond content analysis—points out that assessing a measure’s face validity might seem “deceptively simple,” but it is actually highly useful, requiring that “the researcher take a step back, so to speak, and examine the measures freshly and as objectively as possible.” In fact, Neuendorf advises researchers to go one step further in ensuring face validity: “have others review the measures, with no introduction to the purpose of the study, and have them indicate what they think is being measured, a kind of back translation from operationalization to conceptualization.”
If a measure has content validity, it is said to cover all of the domains or dimensions of a concept that it should cover. This is a critical consideration for any variable included in your content analysis, and achieving content validity may mean breaking up a complex variable into several measures, as we mentioned earlier. Consider the variable in the Bond content analysis that we said failed to meet the kappa threshold for inter-coder reliability: whether the female character was “good or bad.” The coded attributes of this variable were:
- Starts off as good but turns bad.
- Starts off as bad but turns good.
- Is bad throughout the entire film.
- Is good throughout the entire film.
- Unable to determine.
We can see why there was ample disagreement in coding this variable, given the complexity of its underlying notion of “good/bad.” For instance, what if a female character vacillated between good and bad during the course of the film? Should that option (or others) be added to cover all the possible dimensions of this underlying concept? These are the sorts of decisions you will need to make when operationalizing key concepts in a content analysis. You need to be able to defend your operational definitions as valid measures, keeping in mind that there is not just one “right” way to set up your variables.
Presenting Content Analysis Results
As we previously alluded to, quantitative content analysis creates numerical datasets that can be analyzed using any of the statistical techniques available to sociologists (see Chapter 14: Quantitative Data Analysis for an in-depth discussion). Though advanced multivariate techniques can certainly be applied, many content analyses published in academic articles just employ univariate and bivariate techniques like the ones we’ll demonstrate now.
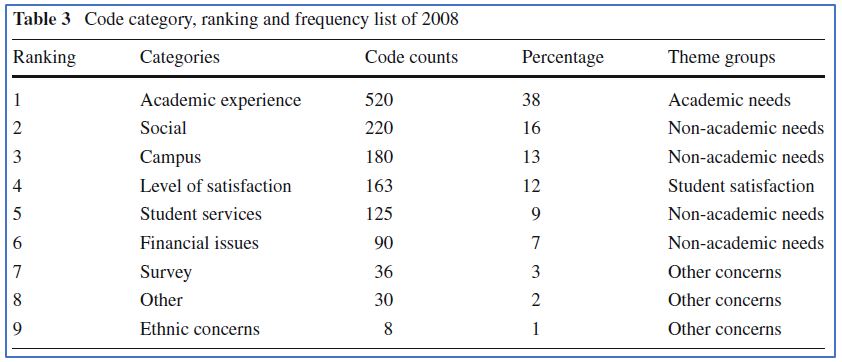
Earlier, we discussed a content analysis by Tony Chambers and Ching-hsiao Chiang (2012) of undergraduate comments in response to open-ended survey questions. This analysis was initially qualitative: the researchers coded the undergraduate comments to inductively generate themes. However, the coding scheme they created allowed them to go back and label each of the 843 student comments as exemplifying one or more of the study’s nine overarching code categories. Figure 15.4 shows how the researchers were able to produce univariate statistics after quantifying aspects of their data. As shown in the frequency table, academic experience represented the largest percentage of total codes.
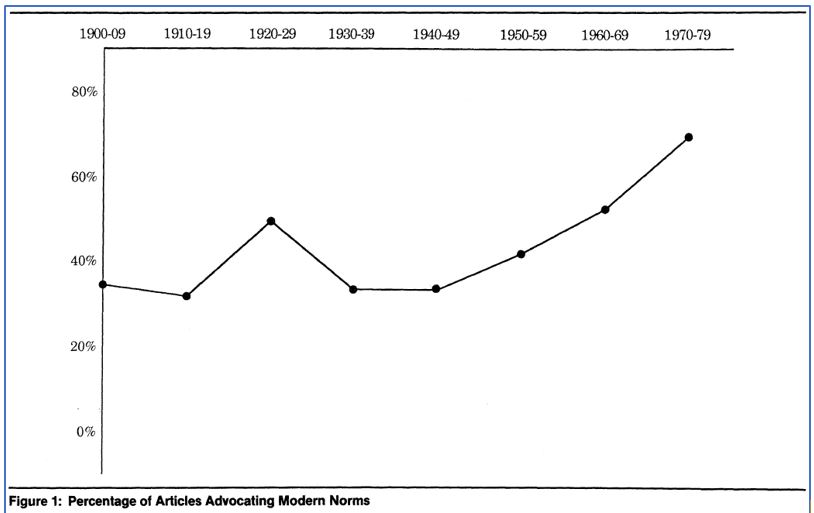
The frequency distributions calculated through quantitative content analysis can also be summarized in graphical form. Figure 15.5 presents a chart from a content analysis by Francesca Cancian and Steven Gordon (1988). The researchers examined a sample of marital advice articles from U.S. women’s magazines published between 1900 and 1979. For their analysis, they determined whether each article presented traditional or modern norms about marriage. According to their definitions, a “traditional” perspective held that romance was immature and women should prioritize their household roles; a “modern” perspective promoted passion and impulse and preferred that women take on roles outside the household. The researchers captured the degree of “traditional” versus “modern” content across their sources by using a composite measure that drew upon various codes. The graph depicts changes over time in the percentage of articles advocating modern norms.
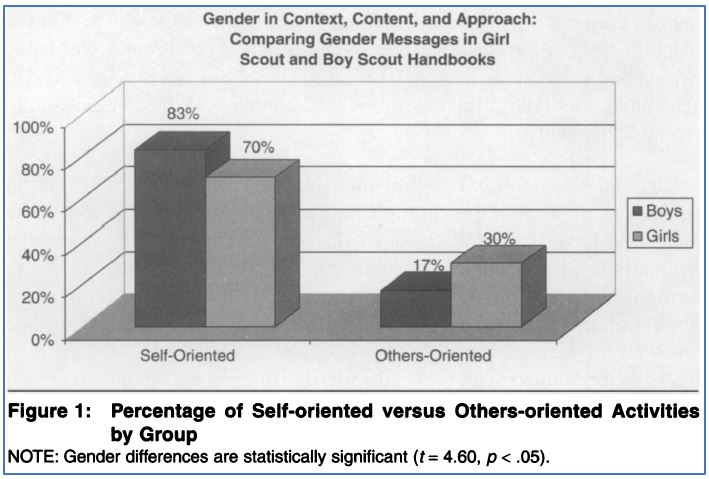
As we discussed in Chapter 14: Quantitative Data Analysis, bivariate analysis allows researchers to examine the relationships between two variables. Usually, one is considered to be the independent variable, and the other is treated as the dependent variable that changes in response. In the analysis of scouting handbooks by Kathleen Denny (2011) that we mentioned earlier, the independent variable was cultural understandings of gender (operationalized through Boy Scouts and Girl Scouts materials) and one of the dependent variables was activity type (coded as either “self-oriented” or “others-oriented”). Denny’s analysis of these two variables is depicted in the graph in Figure 15.6.
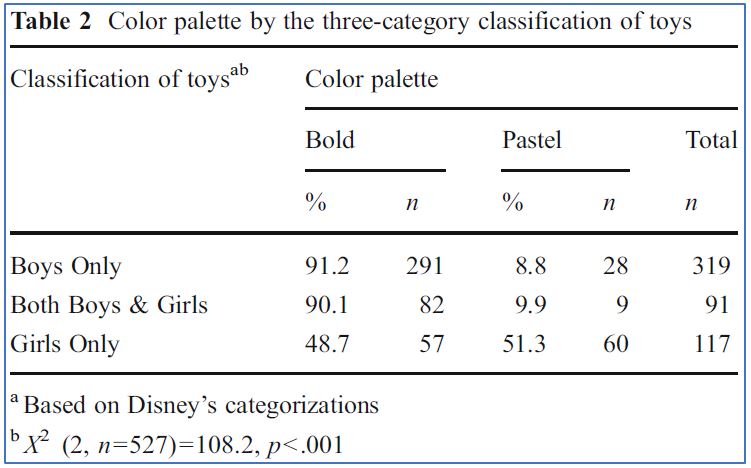
A quantitative content analysis can also produce tables examining bivariate relationships. Figure 15.7 presents a crosstabulation table created by Carol Auster and Claire Mansbach (2012) for their content analysis of toys marketed on the Disney Store website. Disney had classified 410 of its toys as being for boys and 208 as being for girls, with another 91 toys shown on both lists (which the researchers put in a third category of being for “both boys and girls”). The crosstabulation shows the relationship between the gender category of the toys (the study’s independent variable) and the color palette used for the toys (the dependent variable).
When presenting the results of qualitative content analysis, sociologists may also break down numerical data in the ways we have just described. However, the focus is usually on interpreting the latent meanings of the text being analyzed. As you learned in Chapter 11: Qualitative Data Analysis, qualitative researchers often use quotes from their interviews to illustrate their participants’ experiences and points of view. In a similar fashion, a qualitative content analysis will include quotes from the original sources to support the researchers’ arguments. Consider the following excerpt from the content analysis of marital advice articles mentioned earlier (Cancian and Gordon 1988:322):
In this century’s early decades, many articles explicitly expected the woman to do the “emotion work” in marriage. A 1932 article in Ladies’ Home Journal, “And So You Are Married,” told readers:
Well, whether your marriage is a success or failure depends upon you, little bride…. For marriage is not only a woman’s vocation, it is her avocation. It is her meal ticket as well as her romance…. So it is not only good ethics but good business for a young wife deliberately to set about keeping her husband in love with her.
Through the use of quotations and paraphrases, qualitative researchers can provide a richer understanding of what the texts they are analyzing are actually communicating—in this example, how marriage advice articles imparted particular beliefs about marriage to their readers.
Strengths and Weaknesses of Content Analysis
Content analysis has a number of advantages over other research methods:
- The lack of contact with human participants avoids or minimizes some challenges that confront other methods. Content analysis involves analyzing existing texts, rather than collecting data by direct contact with human participants. As a result, methodological issues like nonresponse bias tend to be less of a concern. Ethical scrutiny is less complex than it is for studies more directly involving human participants. That said, you should always remember that the content you are analyzing was created by human beings and is therefore subject to various biases related to reactivity, social desirability, and the many other ways that people’s interests and perceptions shape what they communicate.
- Many materials are available at low or no cost. For students in particular, content analysis is often the most convenient way of conducting original research, given that a wide variety of content sources are available online for free or via a university library’s physical or digital collections. Refer to our lists of possible materials and example studies at the beginning of this chapter and in Table 15.1 for inspiration about the types of sources you can draw upon.
- Content analysis can easily apply qualitative and quantitative methods to the study of materials. As we’ve discussed, not only can content analysis examine texts in a quantitative or qualitative fashion, but it can easily incorporate both approaches. The coding can proceed deductively, with the coding categories created in advance, or inductively, with the categories emerging from researchers’ careful classification of the raw data. And it can move between these approaches, as shown in previous examples—for instance, by starting with the inductive generation of codes and then going back to the data to quantify the existence of certain patterns based on those codes.
- Longitudinal analysis may be possible. Researchers often use content analysis with historical materials, allowing them to provide insights into the evolution of social structures and processes over time. For instance, the content analysis described earlier of marital advice articles in magazines was able to cover a huge span of years—from 1900 to 1979—due to its tight but productive focus, and the result was a sweeping analysis of changes in emotional norms in marriage over decades (Cancian and Gordon 1988). (Note: we discuss historical-comparative research in more depth in the next section.)
- Content analysis has a high degree of flexibility. Content analysis can be applied to a wide variety of materials and affords researchers substantial flexibility in the research process. Research methods that prove to be inadequate can be discarded and the materials reanalyzed using different techniques. Content analysis also offers flexibility in terms of when the research has to be conducted. Once accessed, the materials are typically available for study at any convenient time.
- A content analysis tends to be easy to replicate and update. If researchers were systematic in selecting their sample and provided ample documentation regarding how they went about their coding, their content analysis can be easily replicated by others. This is especially true for quantitative content analysis, as it does not involve subjective interpretations of the data.

Weaknesses of content analysis research include the following:
- Desired materials may not be in a format that can be studied. Materials that the researcher would like to subject to content analysis may be hard to decipher. Anne Lister’s extensive diaries provide a good illustration of this problem. Lister was a well-to-do British landowner in the early nineteenth century whom historians consider to be the first “modern lesbian.” She left behind a massive set of diaries containing 5 million-plus words—the longest personal journal known in the English language. However, as shown in Figure 15.8, the handwriting in Lister’s diary entries is exceedingly hard to read. About a sixth of the content in her diaries is written in code of her own devising, which she utilized to conceal details about her sexuality and intimate affairs (examples of the code are shown in the lower portions of the excerpted pages). Though the code decryption key has been available to scholars for many years, relatively little of the diary is available in a deciphered and digital form. As a result, a researcher would find this material impossible to use in a content analysis project unless they personally want to invest an enormous amount of time decoding and transcribing an appropriate sample of its pages.[1]
- Content analysis can be very time-consuming. Even if materials are readily available, the time and effort required to shift through them and identify relevant information may exceed what you as a researcher can devote to a project. Even if a content analysis seems straightforward at the outset, closer inspection may reveal that the text is too complex or the materials too extensive for the study to be feasible. Take the State of the Union addresses we considered earlier as possible content sources. The longest written address is Jimmy Carter’s 1981 address, which is 33,667 words long. The spoken addresses are considerably shorter, but can still be thousands of words, with the longest being Joe Biden’s 2023 address of 9,216. A researcher who wanted to go through every written and spoken State of the Union address would need to read millions of words. As we have seen, researchers often analyze a sample of materials instead of all available materials, but this approach raises the issue of whether the sample is representative of the entire population of materials.
- Coding may focus on relatively superficial content. Nowadays, the widespread transcription of print texts by Google Books and other services allows researchers to search entire decades’ worth of publications using keywords. Specialized text analysis software can also be used to quickly digitize print materials as needed. However, these technologies may increase the temptation to focus on manifest content—words or phrases that are easy to count across a voluminous body of sources. This approach can make for a relatively superficial analysis, without any attempt to get at the deeper meaning of the texts.
- Coding instructions can be difficult to develop for complex concepts. Recall the difficulty researchers encountered when they sought to measure whether the female characters featured in James Bond movies were “good or bad” (Neuendorf et al. 2010). This variable did not attain an acceptable level of inter-coder reliability, and part of the reason may have been the difficulty of determining the “goodness” or “badness” of a character when the woman did not play a major role in the film. As this example illustrates, the coding process is not always straightforward, and even a rigorous research project may be unable to produce and train people in coding instructions that avoid such ambiguity and disagreement.
- Reliability cannot always be assessed with certainty. If we have only one researcher inductively coding the data for a qualitative content analysis, we will always wonder if another researcher—with a different outlook and biases—would have come to the same conclusions. Yet the breadth and complexity of the materials being reviewed may make it impossible to use multiple coders. For example, if we were conducting a qualitative analysis of Anne Lister’s diary, we would need to recruit coders who had enough familiarity with her life and writing style to interpret the otherwise impenetrable text. To its credit, quantitative content analysis can more easily draw upon multiple coders and calculate measures of inter-coder reliability. As we saw earlier, however, different measures can arrive at somewhat different results, and there is no surefire way of knowing whether the coding process was sufficiently reliable.
Key Takeaways
- Content analysis focuses on the study of recorded communications. The materials that can be analyzed include actual written texts, such as newspapers or journal entries, as well as visual and auditory sources, such as television shows, advertisements, or movies.
- Content analysis usually focuses on primary sources, though in some instances it may also involve secondary sources.
- Quantitative content analysis tends to count instances of manifest content, surface-level details about the sources. Qualitative content analysis tends to focus on the underlying meanings of the text, its latent content.
- Code sheets are used to collect and organize data for content analysis.
- Quantitative content analyses often present univariate and bivariate statistics in the form of tables and charts. Much like in-depth interviewing, qualitative content analyses tend to use direct or paraphrased quotes in order to describe meanings and explain relationships in the data.
Exercises
- Identify a research question you could answer using content analysis. Now state a testable hypothesis having to do with your research question. Identify at least two potential sources of existing data you might analyze to answer your research question and test your hypothesis.
- Create a code sheet for each of the two potential sources of data that you identified in the preceding exercise.
- That said, images of all 7,000+ pages of Lister’s diary are available in the West Yorkshire Archive Service’s online catalog, and transcriptions for its earliest entries (1806 to 1814) are now available in PDF form. An extensive decryption and transcribing project is now underway to make the entirety of the content easily accessible. ↵
