
6. Sampling
6.4. Nonprobability Sampling
Learning Objectives
- Define nonprobability sampling, and describe instances in which a researcher might choose a nonprobability sampling technique.
- Describe how probability sampling differs from nonprobability sampling.
- Describe the different types of nonprobability samples.
When we engage in nonprobability sampling, we do not know the likelihood that a person (or other unit of analysis) will be selected for membership in our sample. Because this likelihood is unknown, we don’t know whether or not our sample accurately represents the larger population of interest. That is okay, because precisely representing the population is not really the goal when we use nonprobability sampling techniques. However, we do want to have a specific purpose in mind that justifies our use of these approaches and guides the selection of our cases.

Under what conditions might we decide to use a nonprobability sampling strategy? One occasion would be when we are initially designing a research project. If we are conducting a survey, for instance, we may want to administer the questionnaire beforehand to a few people who seem to resemble the folks we are interested in studying to help work out kinks in the survey. Indeed, nonprobability samples are quite useful during the early stages of a research project, when we may want to conduct exploratory research to determine the scope of an issue, learn about how stakeholders define or understand a problem, and so on. Nonprobability sampling allows us to quickly gather preliminary data and get some idea of the contours of the phenomenon we are studying before embarking on a more extensive study. (By the way, we use the term pilot testing to describe any preliminary vetting of a survey questionnaire, interview guide, or other research instrument; pilot study is a broader term used for research that explores initial ideas or tests procedures as part of a more comprehensive project.)
From these examples, we can see that nonprobability sampling can be helpful for setting up and framing later research that would use more representative samples. But some sociologists and other quantitative researchers regularly turn to nonprobability sampling in conducting their research. For instance, as shown in the following video by the Pew Research Center, given how difficult it has become to conduct a representative survey of large populations like the U.S. electorate, pollsters are increasingly using a nonprobability sampling to give them a diverse sample that they can then adjust statistically to match the intended population.
Video 6.4. Opt-In Surveys. This video from the Pew Research Center provides a brief explanation of why opt-in surveys (a type of survey using nonprobability sampling) are generally easier and cheaper for polling organizations to conduct. They also tackle the question of whether these kinds of surveys are accurate.
As we have previously discussed, quantitative researchers quantify social phenomena, reducing social life to numbers that allow for easy comparison and the processing of huge numbers of cases. In contrast, qualitative researchers seek to gather all the relevant details that pertain to a phenomenon—including characteristics that are hard to label or measure—with the goal of capturing its complexity and social context. They tend to work with many fewer cases given that their in-depth exploration requires greater time and effort for each one. For all these reasons, probability sampling approaches do not make as much sense for qualitative studies as they do for quantitative ones.
This view is not always appreciated. As Mario Small (2009) points out, qualitative sociologists sometimes convince themselves that to be “scientific” they somehow need to generate random samples with hundreds of cases. Yet any qualitative approach is bound to run into problems if it tries to mimic probability sampling, Small argues. For one thing, because qualitative sociologists rely on time-intensive methods of data collection, such as in-depth interviews, potential research subjects are even less willing to participate in such studies than they are in surveys. This creates low response rates and heightens the danger of nonresponse bias. Instead of pursuing this fruitless quest to achieve sample representativeness, Small suggests that qualitative sociologists should play to the strengths of their method—among other things, their ability to develop rapport with their participants and probe for more information, which allows them to gather information that is more trustworthy, detailed, and potentially surprising than what a survey could obtain. Rather than trying to obtain generalizable results about the relationships between key variables, they should focus their energies on fleshing out the specific causal mechanisms that link those variables—the specific processes that lead from one thing to another—and identifying unexpected factors and connections that survey researchers might not think to measure.
Generally speaking, qualitative sociologists rely on nonprobability sampling approaches to help them obtain an in-depth understanding of an issue rather than generalizable results. They use the data gathered from nonprobability samples to develop richer and fuller theories of social life—sometimes with the expectation that these theories will be tested later with probability samples that better represent the population of interest.
These aims of in-depth understanding and theoretical insight also guide the decisions that qualitative researchers make regarding whether or not they have gathered an adequate number of cases for their samples. Rather than hitting a set threshold of cases, qualitative researchers often seek to attain saturation—reaching a point at which collecting more data does not generate further insights into the phenomenon of interest. For an interview-based study, for example, a researcher might decide they have reached saturation and stop doing more interviews when any new interviews become less informative and do not yield any surprises. With this criterion in mind, qualitative researchers who use qualitative methods can publish a respectable study based on a small number of interviews or observations. Depending on the context, depth can be more useful than breadth. That said, most ethnographies require months of observation, and most interview-based studies include dozens of interviewees—with large-scale qualitative studies sometimes drawing from hundreds of interviews.
The various types of nonprobability samples that researchers use include the following: convenience samples, snowball samples, quota samples, and purposive samples. As we noted, quantitative researchers (especially political polling organizations) routinely use quota samples. The others are more commonly used by qualitative researchers. The last technique—purposive sampling (also known as theoretical sampling)—is arguably the ideal overall approach for qualitative studies, although frequently strategies are combined.
Convenience Sampling

When researchers use convenience sampling, they draw their samples from a part of the population of interest that is close at hand or otherwise readily available to them. Often, sampling units are selected because they happen to be in the right place at the right time. Examples of convenience sampling would be sampling a population of workers by interviewing employees walking into an office building or sampling a population of patients by surveying those who stop by a medical clinic. For their part, student researchers are often enamored with obtaining convenience samples of students at their own university, which they can easily collect by hanging out on the quad or in the library and buttonholing people for interviews. You can see how this approach would lead to a skewed sample. First of all, are the students at your particular university a good stand-in for all college students? Certainly not—among other things, one university would reflect the views of students in just one part of the country. Even if you were interested only in the views of students at your one university, you’d be smart not to gather your sample on the quad or in the library—that approach would not generate a representative sample of all students, because certain types of students are more likely to congregate in those spaces.
Convenience samples are generally frowned upon by social scientists. (Another name for this technique is haphazard sampling, which better captures this negative impression.) Convenience sampling can be useful for pilot testing and in exploratory research, but generally speaking, you don’t want to sample in such an arbitrary way. After all, this is basically how journalists gather sources for their stories. They need quick and easy access to people to talk about a particular topic (think of the staple television news interview with random people on the street), and they are less concerned with how well the opinions of their interviewees reflect those of the larger population of interest. Sociologists try to be more systematic in their approach. Although convenience samples offer one major benefit—convenience—we usually want to use a more rigorous strategy, and we should be cautious about generalizing from any research that relies on such samples.
Snowball Sampling
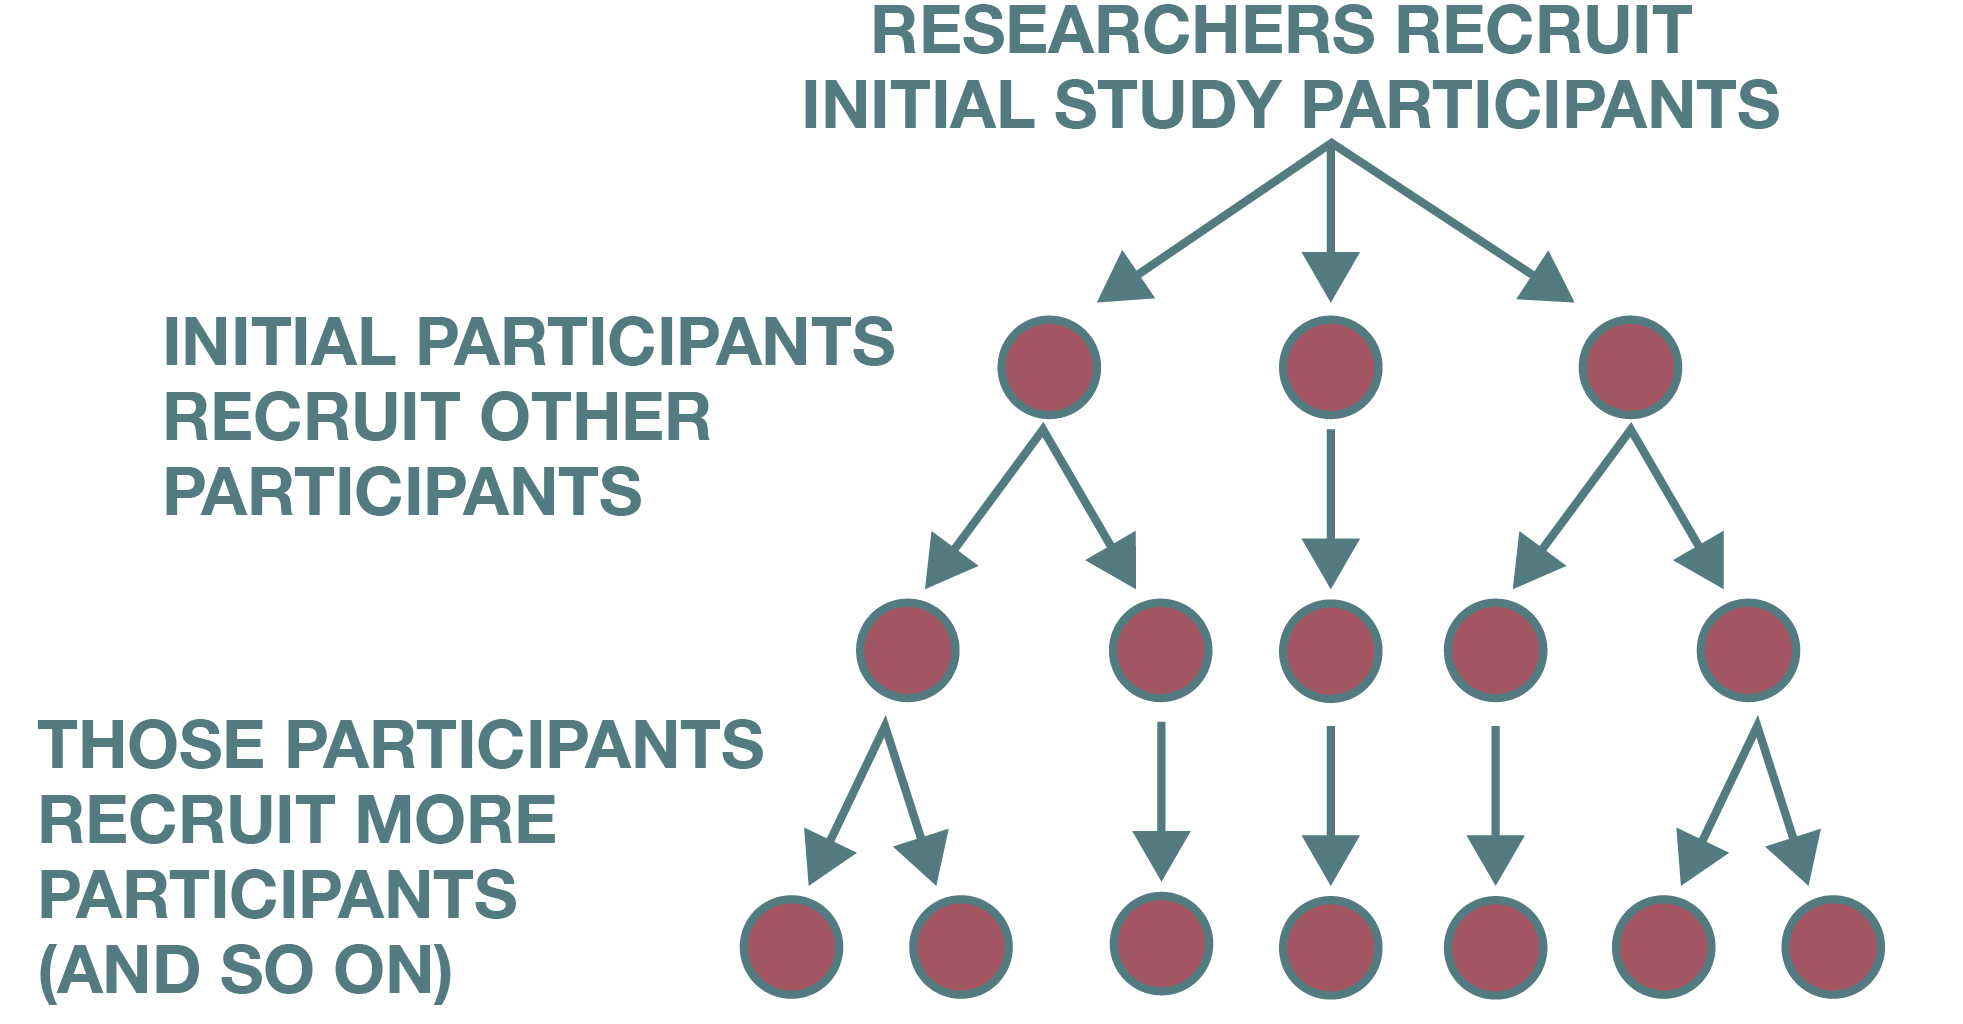
Researchers sometimes rely on snowball sampling techniques to identify study participants (see Figure 6.8). In this case, a researcher might already know of one or two people they want to include in their study but then might rely on those initial participants to help identify additional study participants. Based on these referrals, the researcher’s sample builds and becomes larger as the study continues—much as a snowball builds and becomes larger as it rolls through the snow.
Snowball sampling is an especially useful strategy when a researcher wishes to study a hidden or hard-to-reach population or some stigmatized group or behavior. For example, a researcher who wants to study how undocumented immigrants access healthcare services would be unlikely to find many participants by posting a call for interviewees on a website or making an announcement about the study at some large social gathering. Instead, the researcher might know someone who is undocumented, interview that person, and then be referred by the first interviewee to another potential subject. Having a previous participant vouch for the trustworthiness of the researcher may help new potential participants feel comfortable about being included in the study.
Snowball sampling is sometimes referred to as chain referral sampling. One research participant refers another, and that person refers another, and that person refers another, and through this process, a chain of potential participants is identified. In addition to using this sampling strategy for potentially stigmatized populations, it is also a useful strategy to use when the researcher’s group of interest is likely to be difficult to find—not only because of some stigma associated with the group but also because the group may be relatively rare. This was the case for Steven M. Kogan and his colleagues (2011). Kogan’s research team wished to study the sexual behaviors of non-college-bound African American young adults who lived in high-poverty rural areas. The researchers first relied on their networks to identify study participants, but because members of the study’s target population were not easy to find, access to the networks of initial study participants was important for identifying additional participants. Initial participants were given coupons to pass on to others they knew who qualified for the study. Participants were given an added incentive for referring eligible study participants; they received not only $50 for participating in the study but also $20 for each person they recruited who also participated in the study. Using this strategy, Kogan and colleagues succeeded in recruiting 292 study participants.
The problem with snowball sampling is the sampling bias it inevitably introduces because it relies on social networks and therefore gives people in those networks a greater chance of being selected for the sample (what is called in-network selection). This is a problem for a number of reasons. For one thing, because people tend to know and befriend other people like them, the participants you recruit through snowball sampling will likely be similar to one another, which means you may miss certain kinds of people in your population. Furthermore, using referrals will tend to exclude more socially isolated individuals from your sample, given that these potential respondents will not have as many people identifying them to you.
The sampling bias inherent to snowball sampling discourages its use among quantitative researchers in particular, who typically want more representative samples. That said, this approach is often used to augment a sample in qualitative research, and more technically advanced methods of snowball sampling have been developed to reduce the degree of sampling bias it creates.
Quota Sampling
Quota sampling is a nonprobability sampling strategy that quantitative researchers use frequently (see Figure 6.9). Qualitative researchers also employ this strategy, although they more typically characterize what they do as purposive sampling or theoretical sampling (described in the next section)—an approach that integrates quota sampling as part of a larger strategy driven by a researcher’s theories about the factors and processes that matter.
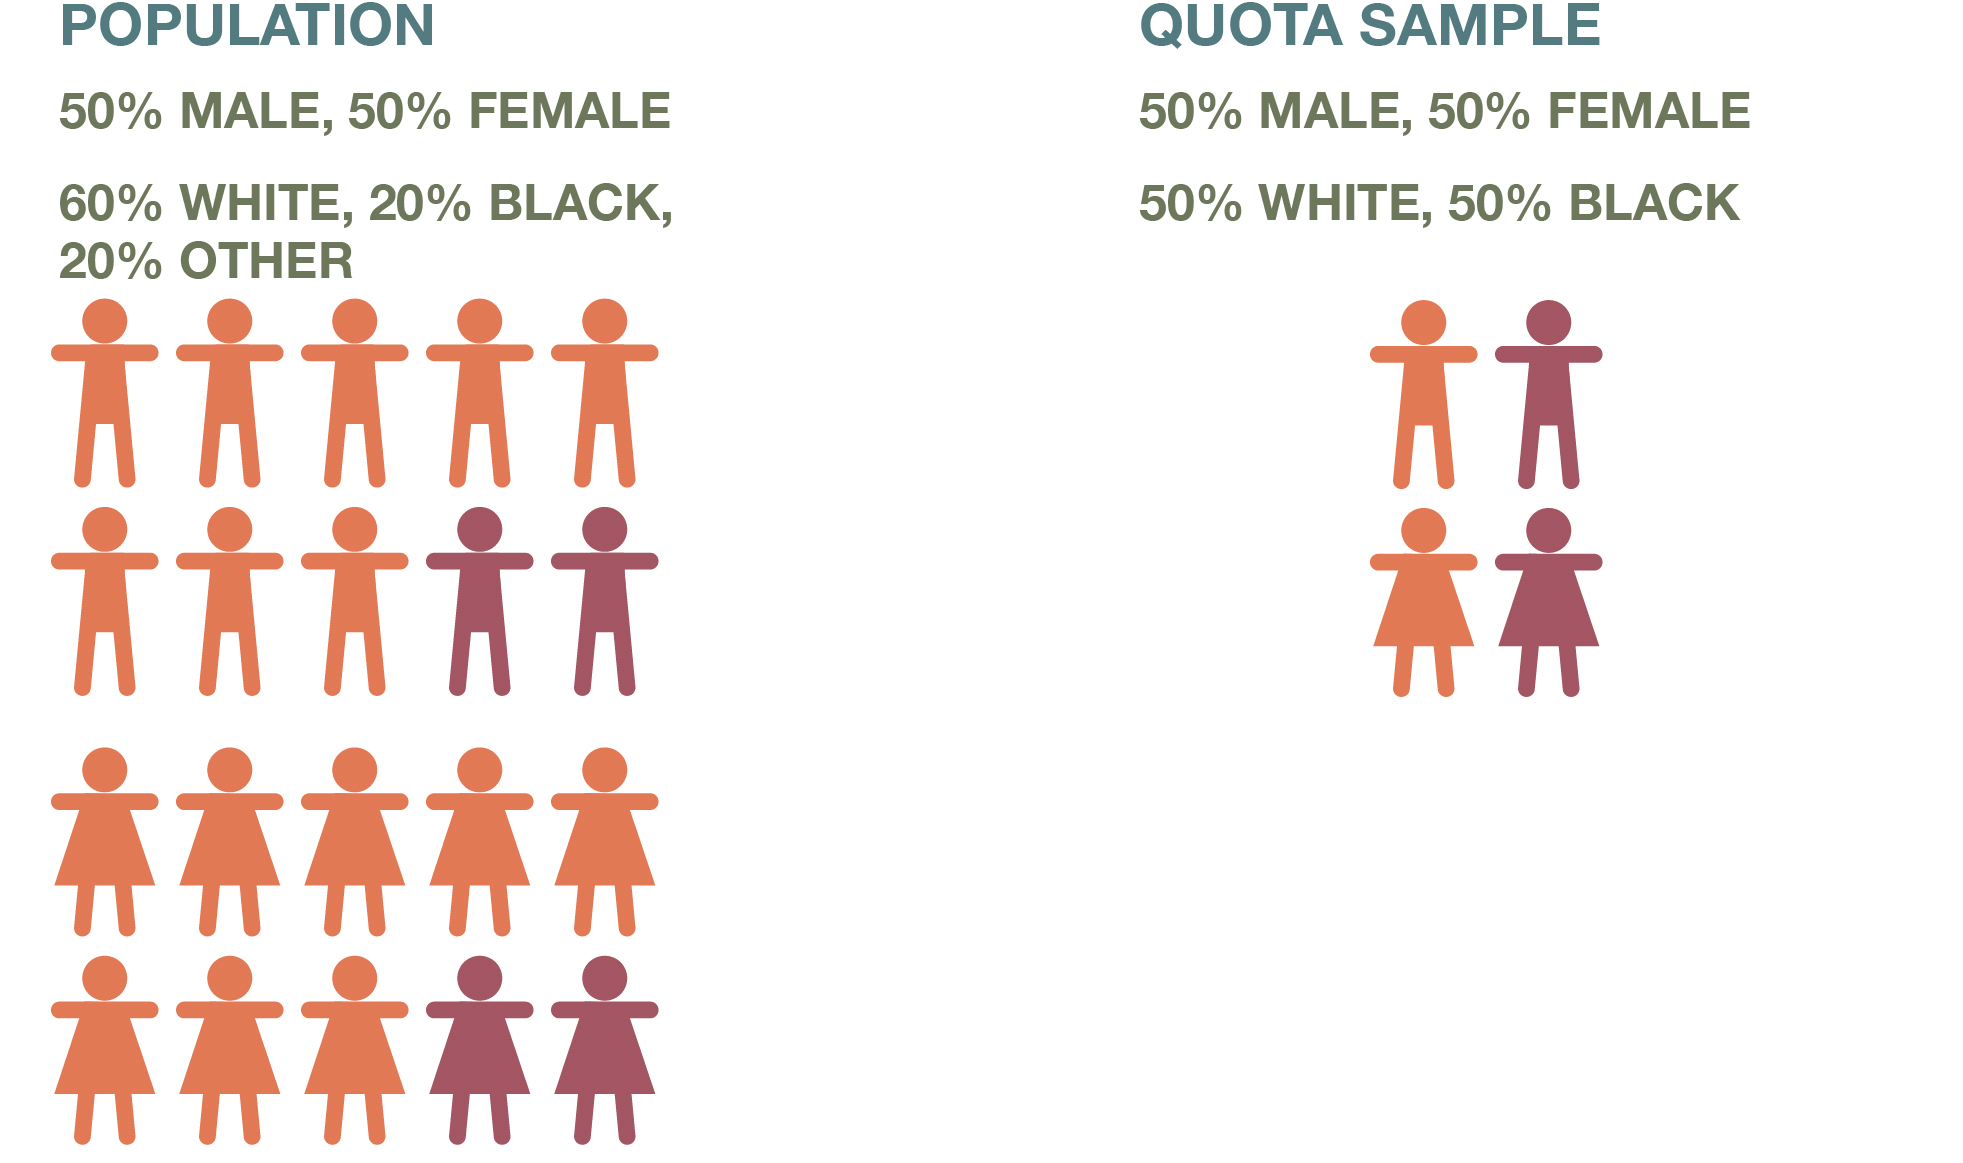
When conducting quota sampling, you first identify categories that are important to the study and for which some variation is likely. You create subgroups based on each category and decide on how many people (or other units of analysis) to include from each subgroup. You then collect data from that specified number of cases for each subgroup.
Suppose you are doing a survey of student satisfaction with on-campus housing. The two types of housing on your campus are apartments that include full kitchens, and dorm rooms in which residents do not cook for themselves but eat in a cafeteria. As a researcher, you might wish to understand how satisfaction varies across these two types of housing arrangements. Perhaps you have the time and resources to survey 100 campus residents, so you decide to survey 50 from each housing type. Let’s say that your review of the literature on university housing also suggests that campus housing experiences vary by gender. To address this potentially important factor in your study, you settle on four subgroups for your sample: men who live in apartments, women who live in apartments, men who live in dorm rooms, and women who live in dorm rooms. Your quota sample includes 25 people from each subgroup.
Note that the quota sample in this example is not a representative sample in the full sense of that term. It’s likely not the case that the residents of on-campus housing at your university are split evenly between men and women and those in apartments and those in dorm rooms. So any statistics you calculate for your sample will not necessarily reflect those of the actual population of students living in on-campus housing. For this reason, researchers would normally prefer a probability sample, which would mean randomly sampling respondents from the entire population of students who live in on-campus housing. This process could get you sufficient numbers of people in each of the four subgroups just described through random selection alone, and you would not have to dictate a threshold of 25 respondents for each category.
That said, researchers may have reason to use quota sampling rather than probability sampling techniques. It may be difficult to recruit a truly random sample from the target population, and yet the researchers still will want to make sure they have adequate coverage of important kinds of variation in the sample. In this case, a nonrepresentative sample can be justified by theory—specifically, by theories of what those important factors are. In the campus housing example, you could justify your choice of four subgroups varying by gender and housing type based on your knowledge (from the literature or your preliminary observations) of what factors shape the experience of on-campus housing in noteworthy ways.
Furthermore, quantitative researchers can conduct quota sampling in ways that give them some confidence that their results are generalizable to the population of interest. For instance, political pollsters can construct a representative sample of voters in an election by recruiting sufficient numbers of people in important subgroups. Specifically, their samples might have quotas for Democrats and Republican voters, college-educated and non-college-educated voters, and white and nonwhite voters, given how much those factors are known to affect voting decisions. Each subgroup would be represented in the sample in proportions that match their proportions in the overall population—whose characteristics the pollster can uncover from census data or other surveys. If the pollster (1) is right about what characteristics really do shape voting decisions and (2) has accurate and up-to-date knowledge about the prevalence of those characteristics in the overall population, then their findings should be generalizable to that population: a poll based on this constructed sample will reflect voters’ overall preferences.
Those two conditions are not always easy to achieve. For instance, George Gallup’s coup in predicting the 1936 presidential election (discussed in the sidebar Deeper Dive: Sampling Gone Wrong) ensured that the approach he pioneered, quota sampling, dominated the field for a decade. But in 1948, Gallup and most other pollsters were wildly wrong about the outcome of that year’s presidential election, as described in the next sidebar Deeper Dive: Sampling Gone Wrong (Again). The polling industry subsequently turned to probability sampling techniques that were just being developed, no longer confident that they could regularly achieve the necessary conditions.
In more recent decades, however, quota sampling has experienced a resurgence of sorts. Rigorous phone surveys have become much more difficult and expensive to conduct (as we will discuss in Chapter 13: Surveys). As a result, pollsters are increasingly turning to online polls that use quota samples as an alternative to random samples gathered through phone polling. Modern-day quota sampling, however, uses a more sophisticated approach than what Gallup and his contemporaries had available to them. Rather than just dictating the recruitment of a certain number of cases in each relevant category, researchers also perform statistical weighting to adjust the sample after it has been collected—what is called postsurvey weighting. This weighting gives cases from underrepresented subgroups a greater impact on the results, which means that the statistics generated better reflect what one would find with a truly representative sample.
For example, the Pew Research Center conducts regular online surveys using its online panel, the American Trends Panel (ATP). They recruit their respondents offline by taking a random national sample of residential addresses—a sampling frame, as we mentioned earlier, often used to generate representative samples. Once respondents agree to participate in the ATP, Pew gives them online surveys to take. It then conducts postsurvey weighting, with each survey’s results “statistically adjusted to match national estimates for political party identification and registered voter status in addition to demographics and other benchmarks” (Kennedy et al. 2021). This weighted sample is meant to be representative of the national population.
Deeper Dive: Sampling Gone Wrong (Again)
As we described in Deeper Dive: Sampling Gone Wrong, the magazine Literary Digest erroneously predicted in 1936 that Franklin D. Roosevelt, the Democratic incumbent running for reelection, would lose in a landslide. Literary Digest had recruited its survey respondents in a way that generated a huge—but woefully biased—sample. Survey techniques were rudimentary at this time, and pollsters did not yet have good strategies for obtaining a probability sample of U.S. voters. Nevertheless, up-and-coming pollster George Gallup successfully predicted the election’s outcome. How did he do that? Using quota sampling, Gallup had figured out which characteristics—such as gender, age, household income, and area of residence—would be decisive in determining how Americans voted. He created subgroups based on these categories and set quotas for each one. Then he recruited respondents to fill his quotas, winding up with a sample that looked like the population—at least in terms of the specific characteristics he had identified as being decisive.
When Gallup’s prediction in 1936 turned out to be correct, he instantly became the face of the new science of political polling. His polls started regularly appearing on the front pages of newspapers like the Washington Post. And his legend only grew after Gallup successfully called several subsequent presidential elections based on quota samples. Other pollsters, such as Elmo Roper and Archibald Crossley, used quota sampling with similar success.
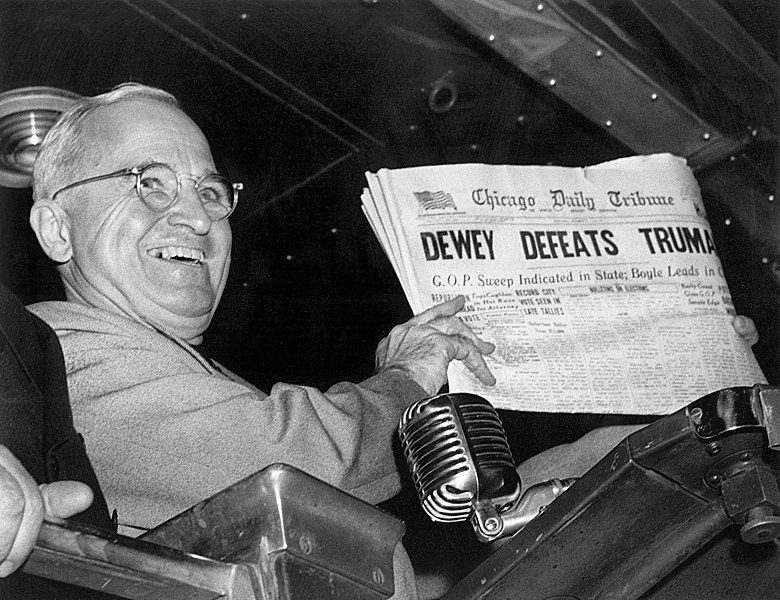
In 1948, quota sampling’s long streak of electoral success ended. That year, prominent polls based on quota samples—Gallup’s included—incorrectly predicted that the Democratic incumbent Harry Truman would lose to his Republican challenger Thomas Dewey.[1] Gallup was so sure about Truman’s loss that his organization stopped polling three weeks before the election, even though 14 percent of voters indicated in polls that they were undecided. With many national polls predicting a Dewey victory, newspapers prepared editions of their papers for printing on the morning after the election with headlines declaring Dewey the victor and speculating on choices for his presidential cabinet. Truman ended up winning by 5 percentage points, and the morning editions were embarrassingly wrong—as captured in that iconic photo of the president-elect holding up a newspaper with the headline “Dewey Defeats Truman.”
Various factors contributed to the fact that the polls were so off in 1948. It is possible that voter opinion had swung in the last weeks of the campaign. The polls may have captured the overall sentiment of the country’s voters, but they failed to predict accurately who actually turned out to vote (a topic to be discussed further in Chapter 13: Surveys) (Lester 1998).
After that year’s stunning miscall, pollsters made sure to survey voters up until election day and to do a better job identifying voters likely to get out and vote. But arguably the most dramatic change in polling after 1948 was the shift toward probability samples whose respondents were selected randomly from the population. Pollsters increasingly saw nonprobability sampling approaches as too risky. The chief weakness of quota sampling is that it relies on our existing knowledge of what the population of interest actually looks like across the characteristics we believe matter. When we don’t have an accurate picture of the population and its decisive characteristics, our results can turn out to be wildly wrong (Neuman 2006). After 1948, pollsters worried that their quota categories were not adequately representing the electorate, and they gradually gave up on this approach. “Political polling was non-probability, and for a number of years they got away with it. In 1948, they got burned,” pollster Warren Mitofsky told the Associated Press in a retrospective on that critical presidential election (Lester 1998). In the 1960s, Mitofsky would pioneer the use of phone surveys using random-digit dialing, the polling method that eventually succeeded quota sampling.
Purposive Sampling
By now you might have a justifiably dim view of nonprobability sampling. We noted the serious problems of representativeness that plague samples drawn from convenience sampling, snowball sampling, and quota sampling. Why would any sociologist in their right mind use a nonprobability sample? Simply put, qualitative researchers do so because their methods prioritize depth in their research over breadth—in-depth knowledge rather than generalizability. In probability sampling, the selection of cases is random, given the goal of generating representative samples whose statistics are generalizable to the population of interest. In purposive sampling (sometimes referred to as theoretical sampling), the selection of cases is guided by some larger purpose on the part of the researcher—specifically, their theory about what concepts and processes matter.
Typically in qualitative studies, purposive sampling across at least two levels of analysis is required. First, the researcher needs to specify the field site they wish to examine—the location or grouping chosen for study to understand a phenomenon present within a larger context. For the purposes of sampling, we are using the term site in a broad sense to refer to the specific locations or groupings from which our micro-level data (e.g., in-depth interviews with individuals situated in those locations or groupings) will come. This sort of staged approach is necessary because unlike quantitative researchers, qualitative sociologists would not study a random sample of Americans (or Virginians) to understand what Americans think. Instead, they would choose a city or community to study—maybe more than one, if they are doing a larger study—and then find people to interview or observe in that locality. Rather than studying a random national sample of organizations, they would choose one or more specific groups (perhaps located in one or more specific localities, too). Rather than studying a random national sample of workers, they would choose one or more specific occupations or companies or workplaces. The hope is that the specific localities, organizations, or occupations they pick would be able to tell them something about Americans, organizations, or workers more broadly.
In purposive sampling, the site is always a stand-in, or representative, for something larger. (Indeed, qualitative researchers often use the term case selection when they are talking about their choice of a particular site to study: they want to argue on behalf of that specific locality, organization, or occupation as an ideal or useful case of that larger phenomenon.) For instance, if we are studying evictions in Milwaukee, we aren’t just interested in that city’s eviction problem—ultimately, we want to say something about evictions in all cities, as the sociologist Matthew Desmond (2016) was able to do in his Pulitzer Prize–winning ethnography on the subject. That said, it is important to emphasize that the site a qualitative researcher chooses will never be “representative” in the sense we have been using throughout this chapter. That would require a much larger sample and some kind of probability sampling approach.
With any luck, however, the site will be useful and informative in generating and refining theories. We will have more to say about site selection in Chapter 9: Ethnography, but the most important thing to note is that some purpose should justify your site selection when you are using a theoretical sampling approach. Answer the question, “What is this a case of?” Specifically, you want to argue on behalf of what makes your choice of a site interesting and potentially productive. (Don’t just say you did it because the locality happened to be where you live, or the organization happened to be one you volunteer for, even though feasibility and access are obviously important reasons for choosing a particular site, too.) At the same time, you don’t have to choose a site that is “average” across all the relevant variables—say, the “average” U.S. city in terms of housing prices, or the “average” company in terms of workforce size and revenue, or the “average” occupation in terms of wages. If you are studying one site or even several sites, there is no way your case selection will be truly representative of all of the possible localities, organizations, or occupations to study—there is just too much variation to account for. Future qualitative research can tackle other sites, and future quantitative research can give us a bird’s-eye perspective with a representative sample. Your goal is to produce research that says something meaningful about this site and can plausibly be true across other sites as well.

Granted, some qualitative sociologists have made a name for themselves by studying what they argued was the quintessentially “typical” instance of a site. Robert S. Lynd and Helen Merrell Lynd (1929, 1937) conducted an influential research project on Muncie, Indiana—which they called “Middletown” in their books—to understand how American culture was adapting to dramatic economic and technological change. That study was replicated in the late 1970s and again in 1999 (Caplow 1982, 1983), and as a result of this research, Muncie has gained a reputation for being the “typical” American small city. That said, rather than going on a dubious quest for a somehow “ideal” or “exemplary” site, it is often more theoretically useful to examine what Katherine K. Chen (2015) has called extreme cases. These are examples of sites that display characteristics or behaviors that are not the norm—they are outliers, or deviant cases, that stray from commonly seen patterns in instructive ways. (While Chen used the term “extreme cases” to apply to organizations, we could apply this logic to any kind of site.) As Chen points out, extreme organizations can show us processes or perspectives that we rarely see in more typical groups, making it easier to study those phenomena. Because of their extraordinary nature, making them the focus of study can highlight practices that are taken for granted in most organizations. And they can present intriguing puzzles or interesting tensions because of their uniqueness. For example, Chen (2009, 2012) conducted a study of the Burning Man organization, which puts on an annual arts festival in Nevada. Burning Man is not your typical organization—or even your typical arts festival—but that fact did not make Chen’s study a pointless academic exercise. On the contrary, Burning Man provided a fascinating case of an organization that had managed to rapidly grow even though it rejected the conventional approach that most organizations took to survive and succeed: formal bureaucratic rules, hierarchical structure, and centralized power. Burning Man was not ordinary, and its exceptional nature needed to be explained—which, in turn, provided insight into possibilities for democratic organizing and consensus-based decision-making in organizations more broadly.
Particularly ambitious researchers may decide to compare and contrast two (or more) sites. Investigating multiple sites allows the researcher to see, among other things, how changing a key set of variables may lead to different outcomes. For instance, Tomás Jiménez (2008) sought to examine the role that “immigrant replenishment”—the continual migration of immigrants from a particular country—played in sharpening the ethnic identities of third-generation Mexican Americans. Jiménez’s purposive site sampling operated on multiple levels. He chose immigration from Mexico—out of all the possible countries to study—because the experience of later generations of Mexican Americans differed sharply from that of the descendants of European immigrants in the twentieth century, given that European immigration dwindled over that time. In other words, Mexican immigration was Jiménez’s extreme case—an outlier that challenged prevailing understandings of the expected progress toward assimilation and incorporation among the descendants of immigrants. In designing his interview-based study, however, Jiménez also had to make site decisions regarding the places where he would conduct his interviews. He chose two cities—Garden City, Kansas, and Santa Maria, California—which both were currently experiencing replenishment of their Mexican migrant populations. However, the replenishment in Garden City had only recently begun again after a long period of little immigration, whereas in Santa Maria, the replenishment had been continuous for generations. As it turned out, the experiences of Jiménez’s interviewees were the same across these two sites. This often happens in research—what you thought might matter doesn’t turn out to matter—and this null finding can itself be interesting. In any case, Jiménez’s decision to study two cities that were both experiencing immigrant replenishment had a clear purpose—namely, to see if varying the kind of immigrant replenishment would matter.

A classic example of a comparative-site study is Arlie Hochschild’s book The Managed Heart (2012), which examined how workers engaged in emotional labor, the effort put into modulating their expressed emotions on the job to provide superior customer service or further other goals of their employers. For this qualitative study, Hochschild chose to observe and interview two types of workers (two “sites” in the broad sense we are using): flight attendants and bill collectors. Her case selection was particularly ingenious. By looking at these two professions, she could see either side of the spectrum of emotional labor: pleasing customers and being incessantly cheerful and helpful (flight attendants) versus berating and intimidating debtors to coerce them to pay up (bill collectors). Here, too, theory drove the selection of the sites. A similar but more recent ethnography by Benjamin Snyder (2016) looks at three groups—long-haul truck drivers, financial professionals, and unemployed jobseekers—to understand how workers experience time in their day-to-day lives. Again, these three sites are not “typical” of all workers, but each category highlights the very different ways that individuals must adapt their bodies and minds to the rhythms of the modern economy.
After qualitative researchers decide on sites to study, they then need to apply theoretical sampling techniques to their choice of individuals to interview or places and events to observe. One useful strategy is to sample for range. In this strategy, the sample selection is driven by a theory of what variables matter (hence, theoretical sampling). The researcher tries to find enough cases with variation across those variables. Oftentimes, qualitative sociologists will expressly identify certain subgroups that they want to sample that span the desired range of variation.
In practice, a qualitative sociologist’s strategy of sampling for range looks like a mash-up of stratified sampling and quota sampling. Previously, we described stratified sampling as a probability sampling method, but the same basic principles can be applied to nonprobability samples—that is, dividing the population into subgroups, or strata, and then finding cases that fit those subgroups. As with quota sampling, the researcher might have a certain number of cases in mind for each of those subgroups. For example, for her study of unemployment, Sarah Damaske (2020, 2021) conducted 100 in-depth interviews with unemployed individuals in Pennsylvania. She employed a “stratified theoretical sampling strategy” (2020:8) that drew interviewees from four groups: 26 middle-class men, 18 middle-class women, 25 working-class men, and 31 working-class women. (“Class” was defined by whether or not interviewees had gone to college.) Note that this strategy of sampling within subgroups, or strata, could involve looking for “extreme” categories—say, sampling flight attendants and bill collectors to represent either end of the emotional labor spectrum of friendly and hostile work personas. But sampling for range does not have to cover such a broad sweep of variation, as Damaske’s research shows.
Indeed, purposive sampling may be an effective approach when a researcher wishes to include only people who meet narrow or specific criteria. For example, Amy Non and her colleagues (2019) were interested in learning about the stress experiences of Mexican women who are mothers and live in a new immigrant destination in the United States. They conducted a series of focus groups with women who fit their inclusion criteria: a self-described Mexican-born immigrant, age 18 or older, who had at least one child and lived in Nashville, Tennessee. In this case, the researchers’ goal was to find participants with specific experiences rather than trying to cover the entire spectrum of experiences.
When conducting purposive sampling, you need to make numerous decisions about both the inclusion criteria and exclusion criteria you will use—that is, how you will decide whether to include or exclude a person (or other unit of analysis) from your sample. Sometimes, you may decide to focus on just a particular subgroup of a larger population because that is the group you find most theoretically interesting or you wish to reduce the amount of variation so that other factors can be better observed. For instance, in his research on the reasons that working-class individuals are leaving the labor force, Robert Francis (2021) focused on working-class men rather than women, given how that trend has been more pronounced in recent years among men with less education. The exclusion criteria for his sample of in-depth interviews, therefore, explicitly excluded women. In Victor’s study of long-term unemployment (V. T. Chen 2015), he interviewed and observed unemployed workers who previously worked at auto plants in Detroit and Windsor, Canada—two cities across the river from one another. The inclusion and exclusion criteria were intended to provide more of an apples-to-apples comparison between the two groups being compared, who would be largely the same except that they lived on either side of the border, which would allow Victor to focus on how the different social policies in the United States and Canada made a difference in these workers’ lives. While narrowing the sample in these ways can be useful, we would not suggest getting too hung up over exclusion and inclusion criteria in purposive sampling—an advantage of this approach is that you can find unexpected cases that might not support your existing view of the phenomenon but are insightful nonetheless.
It is helpful to think of sampling as an evolving process in qualitative research. You do not sample all at once with a set plan in mind, as you would for a quantitative study. Instead, you should let theory guide you—from interviewee to interviewee, from observation to observation. Each case will offer new patterns that you can explore in subsequent interviews or observations. When another case fits the pattern—when the same causal mechanisms seem to be operating—you have some confirmation of your theory. When another case deviates from the pattern, you can find a way to explain it, refining and expanding your original theory in the process. To illustrate this approach of “sequential interviewing” (which obviously can be applied to other qualitative methods as well), Small (2009) provides a hypothetical example of a researcher, Jane, who is studying African American attitudes toward immigration. One interviewee tells Jane about experiencing discrimination from Latino immigrants when she was younger, which has made that person favor stricter immigration laws. This prompts Jane to formulate a theory linking personal encounters with discrimination from immigrants with later support of immigration reform. Jane tests this theory in future interviews by seeing if it holds up—replicates—across different contexts. Specifically, she finds other African American interviewees with similar experiences and sees if the causal process identified earlier replicates in their cases—that is, if encounters with discrimination also make them more likely to support immigration reform. Jane also finds African American interviewees who have not had such experiences, and those who experienced discrimination from another group, such as Russian immigrants. She refines her original theory to accommodate what those interviewees tell her: whether the absence of discrimination leads to less support of immigration reform, whether discrimination from other groups also shapes those policy views, and so on.
This approach of replicate-as-you-go plays to the strengths of the qualitative method. Unlike in quantitative studies, you can refine your theoretical focus as you add more cases to your sample—that is, as you do more observations or interviews. In this process of iterative sampling (or recursive sampling), researchers move back and forth between the process of sampling and the preliminary analysis of data—with their analysis informing their selection of new cases for their sample, and each new case providing more data to be analyzed (Cohen and Crabtree 2006). You can seek out specific cases to test the new hunches you develop in the field or to capture more variation across the variables you learn are important. As you sample, you should continually ask the key question, “What is this a case of?” That will help you understand the significance of each interview you do or observation you make, possibly generating additional theories to test or explore.
If you happen to stumble across a deviant case that doesn’t fit your current theory, you can seek out more data, including more cases, that might explain that deviation. Indeed, this search for instructive outliers is a key advantage of a purposive sampling strategy: you can find puzzling cases that surprise you, ones that you did not anticipate when you began your study, and the existence of each instructive outlier speaks to the need to refine existing theories to accommodate it.[2] (Sociologists call this approach of looking for surprising cases abduction, a topic to be discussed in Chapter 11: Qualitative Data Analysis.) Being able to move back and forth between sampling and analysis—the recursion involved in such an approach—allows qualitative researchers to focus on this important theoretical work.
As we discussed, a qualitative study typically continues this iterative process until the researcher reaches the point of saturation—when they are not gaining any more useful knowledge from each new case. In purposive sampling, this typically means that you have covered all the important forms of variation (perhaps as specified subgroups within your sample). Qualitative interviewing guru Robert Weiss (2004) suggests that a qualitative researcher will need at least five instances of any important “types,” or subgroups, within their sample. That means for a study with “between a half dozen and a dozen important types of respondents,” which is a typical solo-authored qualitative project, a “rough ideal” would be 30 to 60 respondents in your sample (Weiss 2004:48).
In Table 6.2, we review the situations when you might want to use nonprobability sampling and the drawbacks associated with each strategy.
Choosing between Nonprobability Sampling Strategies
Table 6.2. When to Use Nonprobability Sampling Strategies
|
Sampling Strategy |
Suggested Use |
Key Problems |
|
Convenience sampling |
When you want to quickly generate a sample for pilot-testing questions or conducting a pilot study |
Major problems with sample representativeness |
|
Snowball sampling |
When the nature of the topic or the population you are studying makes it difficult to recruit respondents or get them to talk candidly with you |
People in the same social networks tend to be similar, meaning you may miss important variation Socially isolated individuals will be less likely to be in your sample |
|
Quota sampling |
When you have key subgroups of your population in mind and want to make sure you have sufficient numbers of cases in each |
Requires weighting and/or sample selection in line with relevant population characteristics for the sample to be representative |
|
Purposive sampling (Theoretical sampling) |
When you want to follow the ideal approach for most qualitative studies When you want to supplement your strategy with other probability and nonprobability sampling techniques |
If you really need a representative sample, then this is not the best approach (and you should avoid other nonprobability sampling strategies, too) |
Key Takeaways
- Nonprobability samples might be used when researchers are conducting exploratory research, pilot studies, or qualitative research. They are especially useful when the researcher’s focus is theoretical and their goal is to obtain an in-depth understanding rather than a more generalizable understanding of an issue.
- The various types of nonprobability samples include purposive samples, snowball samples, quota samples, and convenience samples.
- A researcher’s findings need not be generalizable to be valuable; samples that allow for comparisons of theoretically important concepts or variables may yield findings that contribute to our social theories and our understandings of social processes.
Exercises
- Of the four nonprobability sample types described, which seems strongest to you? Which seems weakest? Explain.
- Imagine you are about to conduct a study of people’s use of the public parks in your hometown. Explain how you could employ each of the nonprobability sampling techniques described previously to recruit a sample for your study. Compare this approach to the random sampling techniques you used for Exercise 2 in Section 6.3.
- Now let’s say you wanted to do a qualitative interview-based study of U.S. college students to understand the effect of drug use on academic performance. How would you obtain a purposive sample? Compare this approach to the techniques you proposed for Exercise 2 and for the probability sampling strategy you suggested for the similarly themed study of drug use for Exercise 3 in Section 6.3.
- The PBS documentary The First Measured Century covers the 1948 election and other historically significant events related to social scientific measurement. ↵
- Sometimes, researchers call these outliers “negative cases”—”negative” in the sense they do not follow the expected pattern; an example would be the previously mentioned immigration study by Tomás Jiménez that focused on the “negative case” of Mexican immigration (in which assimilation patterns seen in previous European immigration do not hold, arguably because of immigration replenishment in the Mexican case). When outliers are particularly instructive, a single case can challenge existing understandings of a phenomenon. The term “black swans” is used to describe these situations (Taleb 2010). Europeans thought black swans were fictional creatures until they were actually spotted in Australia; that one sighting transformed existing thinking. In a similar way, an instructive outlier can shake and even overturn a prevailing theory, including any reasoning that followed from it. ↵
