
13. Survey Research
13.2. Types of Surveys
Learning Objectives
- Define cross-sectional surveys and outline some of the drawbacks of this approach.
- Describe the various types of longitudinal surveys, and how retrospective surveys attempt to mimic longitudinal surveys.
- Discuss the advantages and disadvantages of the various methods of administering survey questionnaires.
There are many different types of surveys that you can employ as a researcher, and they differ in two major ways: how frequently a survey is administered, and how it is administered to respondents. In this section we’ll go over these various approaches to conducting survey research.
Cross-Sectional versus Longitudinal Surveys
Cross-sectional surveys are surveys that are administered at just one point in time. You can think of cross-sectional surveys as a snapshot in time: they give us an idea about how things were for our respondents at the particular moment that they completed the survey.
One problem with cross-sectional surveys is that the opinions, behaviors, and other phenomena that such surveys are designed to assess don’t generally remain the same over time. As a result, generalizing from a cross-sectional survey about the way things are can be tricky. Perhaps you can say something about the way things were in the moment that you administered your survey, but it is difficult to know whether things remained that way for very long afterward. Think about how Americans might have responded if they had been administered a survey asking for their opinions on terrorism on September 10, 2001. Now imagine how differently people would responded responses if they had been asked the same questions on September 12, 2001—the day after the attacks on the World Trade Center and Pentagon.
A more mundane example of this problem comes from pre-election polling. (Poll is another word for a “survey,” though it is more commonly used for nonacademic surveys that gauge voter preferences or public opinion.[1]) One of the goals of political polls is to give people a sense of who is “winning” or “losing” an election before the actual vote is completed and counted. Polls can be useful in tracking people’s opinions over time in this way, but they are more problematic when they are used as predictions about who will win an election. Besides for all the sampling and measurement problems that plague polling (some of which we discussed earlier), they are just a snapshot in time, and voter opinions—especially for that rare breed of undecided voters—can change rapidly between the moment that a poll is conducted and the moment that voters actually vote. According to some election analysts, this very kind of abrupt turnaround in voter sentiment happened right before the 2016 U.S. presidential election. Most mainstream political polls leading up to Election Day suggested that former secretary of state Hillary Clinton would win the presidency. However, some last-minute factors—such as damaging campaign revelations in the news—turned a crucial segment of voters against Clinton in the final hours of the campaign, which some pollsters (perhaps self-servingly) say is the main reason that she lost and their polls got it wrong.
Longitudinal surveys make observations over some extended period of time. There are several types of longitudinal surveys, including trend, panel, and cohort surveys. Researchers conducting trend surveys are interested in how people’s attitudes or behaviors change over time. A key characteristic of trend surveys is that they do not require interviewing the same people at each time point. Because the interest here is in trends, not specific people, as long as your sample is representative of whatever population you wish to describe over time, it isn’t important that the same people participate each time.
The Gallup opinion polls are an excellent example of trend surveys (we discussed founder George Gallup’s innovative approach to polling in Chapter 6: Sampling). To learn about how public opinion changes over time, Gallup administers the same questions to different groups of people at different points in time. For example, since 1936 Gallup has asked Americans, “Do you approve or disapprove of labor unions?” (Saad 2023). In 1936, 72 percent of Americans approved of unions. That figure peaked at 75 percent in 1953 and 1957 before declining in subsequent decades. Approval fell to the 50s in the 1980s, when U.S. president Ronald Reagan ushered in an era of anti-union politics and policies, and it reached its nadir in 2009—48 percent—as the belt-tightening of the Great Recession sharpened criticisms of relatively well-paid unionized workers in the public sector and elsewhere. In 2022 and 2023, however, approval of labor unions shot up to 71 and 67 percent, respectively, the highest levels seen since the 1960s; perhaps not coincidentally, a wave of well-publicized strikes swept the country during these years.

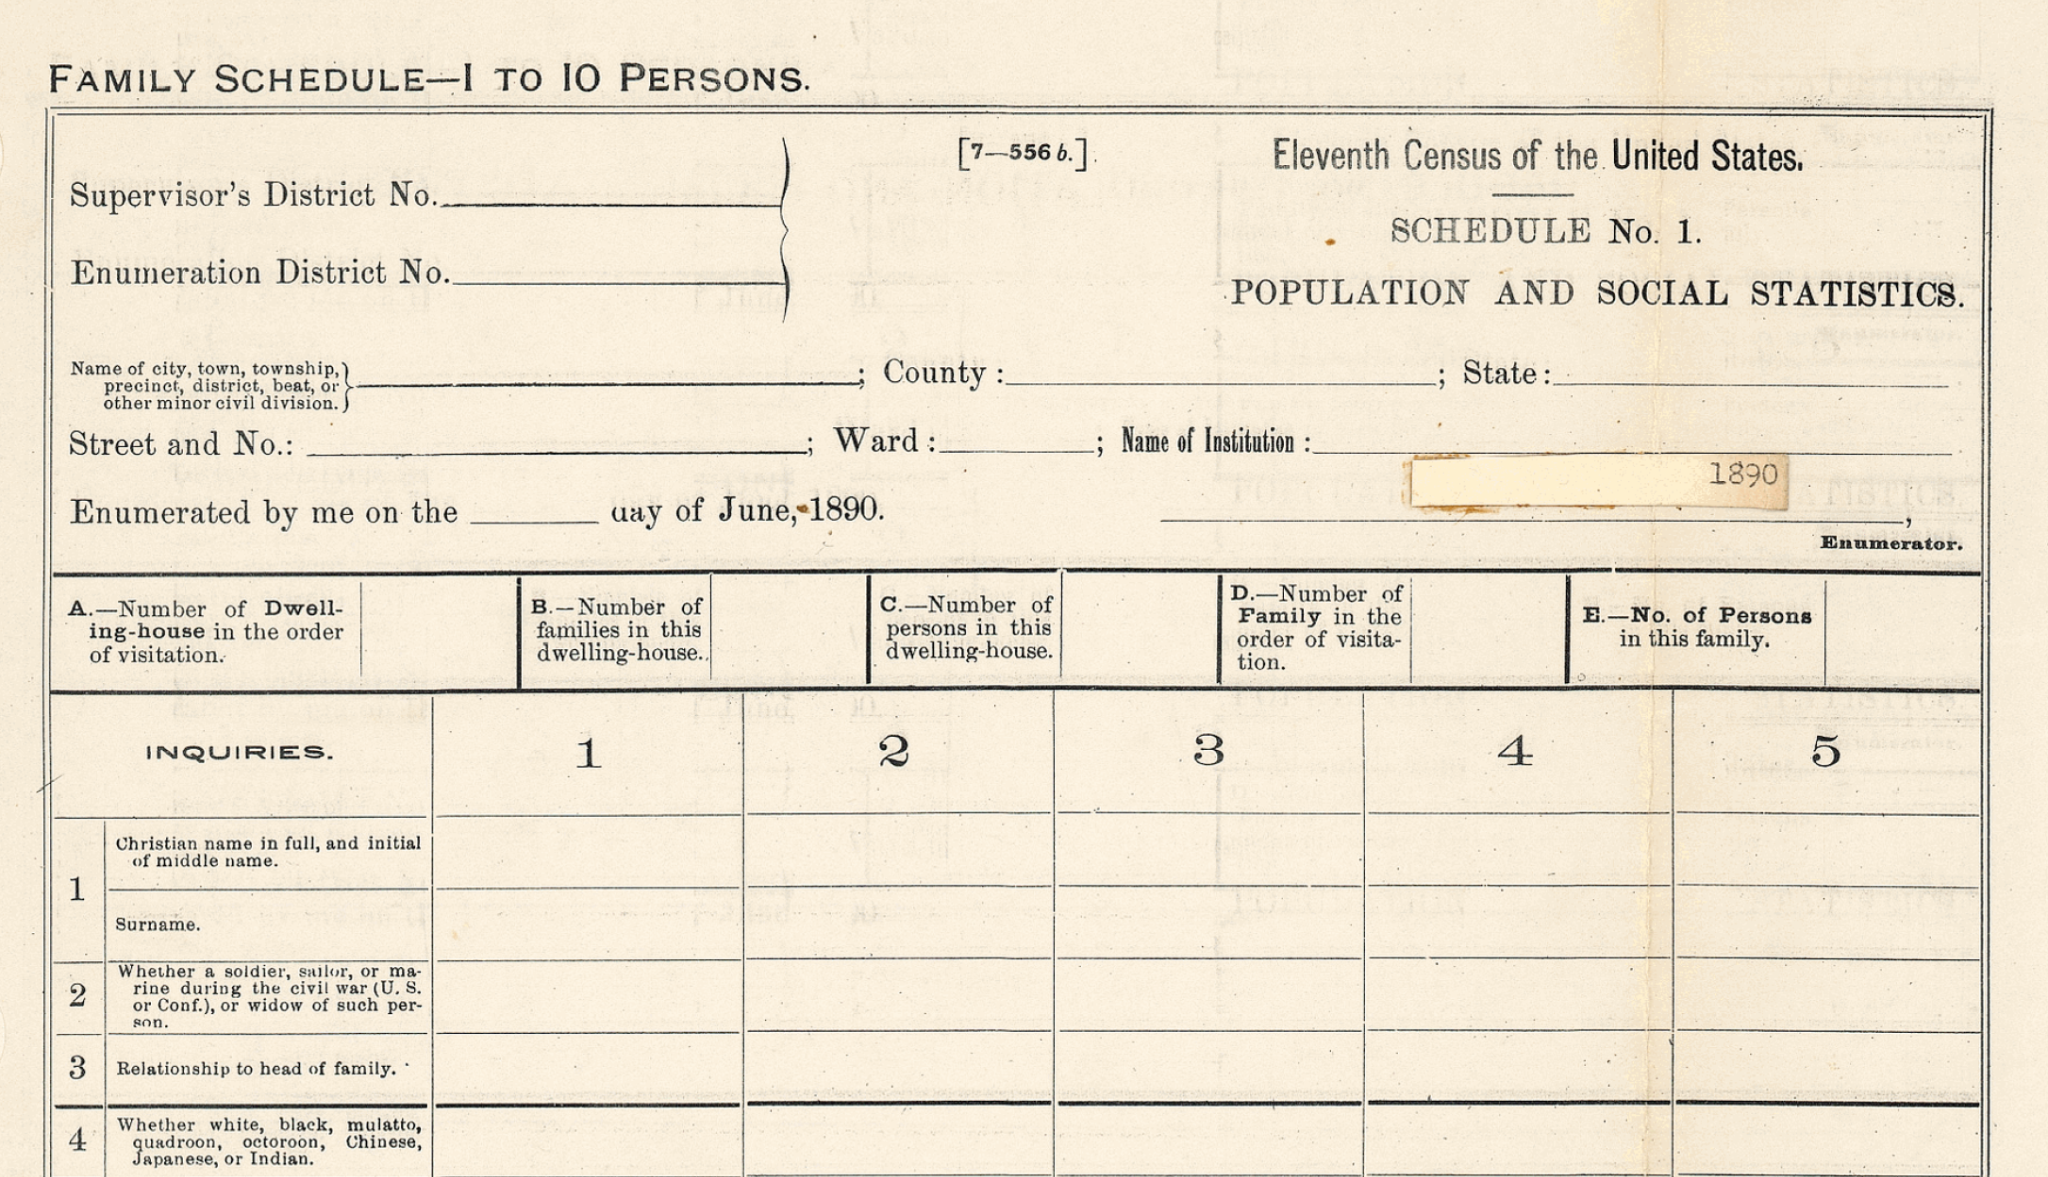
One problem with trend surveys is that the questions they use may have language that becomes outdated over time. As we have said, altering a question’s wording in any way may alter how people respond to the question. As a result, it becomes impossible to know whether any dip or rise in the trend line following a wording change is due to the revised language or an actual movement in public opinion. Take the GSS question we started this chapter with: “If your party nominated an African American for President, would you vote for him if he were qualified for the job?” When the question was first asked in 1972, the word “Negro” was used; in later years, “Black” was used, and more recently, “African American.” Clearly, the GSS needed to keep up with the times (“Negro” is so antiquated it would be jarring to hear in a survey interview), and you could argue that these minor alterations in wording did not lead people to answer the question in a substantially different way. The point is, though, we don’t know for sure, and in some cases changing the wording in a questionnaire creates major problems for researchers. Take the questions about race and ethnicity that the U.S. Census Bureau has posed over the centuries. In the 1890 census, a question asked if the respondent was “white, black, mulatto, quadroon, octoroon, Chinese, Japanese, or Indian” (see Figure 13.1). In 1940, the questionnaire asked if the respondent was “White,” “Negro,” “Indian,” “Chinese,” “Japanese,” “Filipino,” “Hindu,” or “Korean.” Clearly, the categories for the 1890 census do not match those in 1940, much less those used today. These major changes in question wording over time make it hard to say with any precision what the actual numbers of people we would consider African American, Asian American, etc., today were in those earlier times when the census questions were very different. Sociologists Claude Fischer and Michael Hout tried to do exactly that in their book Century of Difference (2006), but this task required making many assumptions about the available data that social scientists generally prefer to avoid.
Even if the language a survey question uses is outdated, it sometimes makes sense not to change it so that responses in earlier years can be properly compared to those in recent years. For instance, since 1988 the GSS has occasionally asked respondents whether they agree or disagree with the statement “Being a housewife is just as fulfilling as working for pay.” Nowadays, many people would use the term “stay-at-home parent” or something similar to convey the same idea, but the GSS has continued to ask this question in recent years without any edits to the wording. For trend surveys, seeing the ways that opinions evolve over time is the whole point of this longitudinal approach, and altering the question language could make the comparison more fraught in the ways we have described. Indeed, sometimes the relative changes over time in how people answer the same question are much more interesting than the breakdown of answers in a single year. The original question may not have been phrased in the best way, but whether its trend line goes up or down over time can still tell us a great deal.
In panel surveys, the same people participate in the survey each time it is administered. As you might imagine, panel studies are difficult and costly to conduct. Imagine trying to administer a survey to the same 100 people every year for, say, five years in a row. Keeping track of where people live, when they move, and when they die takes resources that researchers often don’t have. Furthermore, panel studies present special problems of sampling bias because they almost always lose respondents over time: people die, or grow tired of the study, or drop out for other reasons. As we discussed in Chapter 7: Measuring the Social World, losing participants can generate a form of bias (attrition bias) because the people who remain may have certain characteristics—being healthier, more committed, more enamored with research, and so on—that can skew the study’s findings in one or more directions.
When researchers successfully pull off a panel survey, however, the results can be quite powerful. Since 1988, researchers at the University of Minnesota have administered the Youth Development Study (YDS) every year to the same 1,000 people. Study participants were in ninth grade when the study began, and they are now middle-aged. Several hundred papers, articles, and books have been written using data from the YDS. One of the major lessons learned from this panel study is that doing paid work has a largely positive impact on young people (Mortimer 2005). Contrary to some popular beliefs, researchers found that work increases adolescents’ confidence, boosts their academic performance, and prepares them for future careers. Without the unique data that this panel survey was able to obtain, researchers might not have been able to arrive at such a counterintuitive finding.
Another type of longitudinal survey is a cohort survey. In a cohort survey, a researcher identifies some category of people who are of interest and then regularly surveys people who fall into that category. The same people don’t necessarily participate from year to year, but all participants must meet whatever inclusion criteria the researcher has set to be recruited for the sample. (Note that it is possible to have panel cohort surveys, and the YDS is an example of one: the respondents were all ninth-graders when the study began.)
The sorts of cohorts that researchers frequently study include people born around the same time period (i.e., generations), graduating classes, people who began work in a given industry at the same time, and people who have some specific life experience in common. A good example of an analysis of generational cohorts is a study by Christine Percheski (2008) of women’s employment. Percheski compared employment rates for women born across seven different generations: from Progressives born between 1906 and 1915, to Generation Xers born between 1966 and 1975. One of her findings was that the labor force participation rate—the percentage of the population either employed or actively seeking jobs—increased consistently across these cohorts of women. Percheski also found that Gen X professional women with young children had higher labor force participation than similar women from previous generations. Her analysis contradicted the speculation of some journalists that Gen X mothers were opting out of the workforce en masse (Belkin 2003).
One substantial benefit of conducting panel studies is that they make it easier to infer causality—that is, evaluate whether a cause-effect relationship exists between two variables. This is a research goal that is near and dear to the hearts of many sociologists, who don’t want to just describe reality, but explain it. As we discussed in Chapter 12: Experiments, experiments excel at this task because they randomly assign subjects into control and experimental groups and then introduce a treatment or stimulus. This research design makes it easy to infer that a change in the independent variable truly caused any outcomes that occurred in the experimental group. Among other things, the fact that the subjects were randomly assigned to the two groups rules out the possibility that preexisting differences between those groups explain those observed outcomes.
But with a cross-sectional survey, you have only observational data, not experimental data. As we’ll discuss in Chapter 14: Quantitative Data Analysis, you therefore need to apply statistical procedures in your analysis to ensure that any outcomes you observe are the result of changes in the independent variable rather than preexisting differences. But in a panel study, you essentially have built-in control and experimental groups: the research participant earlier in time is the control group, and the participant later in time (after the change in the independent variable) is the experimental group. This allows you to say with greater certainty that any changes in outcomes that a participant experienced were driven by changes in the independent variable of interest.
Let’s say you are conducting a study of the impact that having a criminal record has on a person’s employment prospects. If you had access to cross-sectional survey data, you would likely see that individuals with criminal records are much less likely to be employed. However, you wouldn’t know if this association was due to the criminal record itself, or some confounding variable—for instance, the fact that individuals with criminal records also tend to have personality traits that make them less employable. With panel data, however, you might be able to follow a particular individual before and after they were arrested. If you saw that the individual’s ability to obtain and maintain employment worsened after their entanglement with the legal system, you would have stronger evidence that a causal relationship truly exists between criminal records and poor employment outcomes, based on an assumption that factors like personality traits would have stayed more or less constant across the pre-arrest and post-arrest scenarios.
As we noted in Chapter 12: Experiments, you would have even stronger causal evidence if you conducted an experiment—as Devah Pager (2003) did with her groundbreaking audit study to measure the “mark” of a criminal record—but field experiments of this kind are also exceedingly hard to implement. A well-done panel study can tell you a great deal about causal relationships, and they have the added benefit of greater external validity—giving you a richer sense of how a phenomenon unfolds in the real world.
Consider the panel study that David Harding, Jeffrey Morenoff, and Jessica Wyse conducted for their book On the Outside (2019), which tracked Michigan state prisoners released on parole. Their study included a quantitative analysis of administrative data—data from an organization’s own records (in this case, the Michigan state government). Rather than needing to administer their own surveys, the researchers had access to Michigan’s data on every prisoner released in 2003—11,000 individuals, or the entire target population—whom they were able to track in state records from the date of their parole until seven years later. To flesh out the overall trends in their quantitative data, the researchers also conducted in-depth interviews and observations of 22 of those parolees, the study’s focal participants, over that time period. In all these ways, the three sociologists took advantage of their study’s robust longitudinal design to examine the factors that make it difficult for parolees to reintegrate into society after their release from prison.
Like cross-sectional surveys, retrospective surveys are administered only once, but they are still able to capture changes over time by asking respondents to report past behaviors, beliefs, or experiences. By relying upon respondents’ recall, retrospective surveys gather longitudinal-like data without actually incurring the time or expense of a real longitudinal survey. Of course, this benefit must be weighed against the very real possibility that people’s recollections are faulty. Imagine, for example, that you’re asked in a survey to respond to questions about where, how, and with whom you spent last Valentine’s Day. Given that the last Valentine’s Day can’t have been more than 12 months ago, chances are good that you can respond accurately to any survey questions about it. But now let’s say the researchers want to know how the last Valentine’s Day compares to previous Valentine’s Days, so they ask you to report on the preceding six Valentine’s Days as well. How likely is it that you will remember details from that far back? Clearly, your retrospective responses will not be as accurate as they might have been had you been asked that same question each year over the past six years—that is, as part of a panel survey.
We’ve discussed cross-sectional and longitudinal research designs in relation to survey research because these distinctions are made most commonly between different types of surveys. However, we should note that surveys are not the only method of data collection that can be cross-sectional or longitudinal. For instance, you could conduct multiple ethnographic observations of the same place over a certain span of time, or you could conduct in-depth interviews with a similar cohort of respondents every few years. You could even use multiple methods in a panel study: consider the panel study of parolees we just mentioned that relied on both qualitative and quantitative data. In fact, if the idea of doing a panel study has piqued your interest, you might want to check out the Up series of documentary films. While not academic research, the films offer an artistic approximation of a panel study. Filmmakers began filming the lives of 14 British children in 1964, when the children were seven years old. They have since caught up with the children every 7 years. The ninth and most recent installment of the documentary, 63 Up, premiered in 2019 (see Video 13.1).
Video 13.1. The Up Documentary Series. While the documentaries in Michael Apted’s Up series are not research studies, they illustrate the general approach of panel surveys, which follow the same people over a particular time period—often several years, and sometimes for decades. In 7 Up (1968), Apted profiled ten boys and four girls from varied class backgrounds when they were seven years old. Every seven years, he released a new documentary chronicling their lives in the years since, with the most recent installment, 63 Up (2019), featuring 11 of the 14 participants (one died and two did not participate).
Self-Administered vs. Interview-Administered Questionnaires
Surveys can be grouped into two categories based on how their questions are asked and answered. The first is self-administered questionnaires, which present respondents with a set of questions that they answer on their own. The second is interviewer-administered questionnaires, which entail having a researcher pose each question aloud and record the respondent’s answer. On the one hand, interviewer-administered questionnaires involve much more effort on the researcher’s part than self-administered questionnaires, and they present risks of certain biases because the respondent is answering questions in the presence of another person. On the other hand, having a researcher oversee the completion of the questionnaire helps ensure that respondents take the survey seriously and answer questions carefully and with greater clarity about what is being asked. We will discuss each approach in turn.
There are three ways of delivering self-administered questionnaires: in person, via mail, or online. In the first approach, researchers hand out self-administered questionnaires to the study’s participants in person. Traditionally, the in-person approach has involved handing out printed-out copies of the survey questionnaire, but increasingly researchers working on site will let respondents borrow tablets or laptops or use their own phones to access an online version of the questionnaire (thereby automating the data-entry process, as we discuss below).
Frequently, an in-person survey will be given to an entire group at one time. These group-administered surveys are very common on college campuses (researchers love to administer surveys in large lecture classes, where they have a more or less captive audience), but they can be employed in virtually any setting. In this approach, a sample of respondents is brought together at a common place and time, and each respondent is asked to complete the survey questionnaire while in that room. Respondents enter their responses independently without interacting with each other.
Group-administered surveys have a number of advantages. They ensure a high response rate because many of those asked to fill out the survey in such a setting will do so. If respondents do not understand any specific question, they can ask for clarification. And in many organizations, it is relatively easy to assemble a group of people in a conference room or cafeteria, especially if the survey is approved by higher-ups.
If you are not able to visit each member of your sample personally to deliver a survey, you might consider sending your survey through the mail. In this case, the same questionnaire is sent out to a large number of people. Respondents can complete the survey at their convenience and return it in the (hopefully postage-prepaid) envelopes you provide. The key advantages of mail surveys are that they are unobtrusive and inexpensive to administer (bulk postage is cheap in most countries). Furthermore, you can draw upon a sampling frame of all the postal addresses in a given geographical area, whereas other means of administering surveys do not always have an obvious sampling frame (for instance, there is no list of every American’s email address—at least not any a sociologist is privy to). However, you will need to mail a lot of surveys just to get a few responses because most people tend to ignore survey requests sent to them in the mail—or anything sent in the mail these days, to be fair. Even if they intend to fill out the survey, many respondents may wind up losing it. There may also be long delays of several months between when the surveys are sent out and when researchers get them back, completed, in the mail.
Because of these drawbacks, many researchers use mail surveys in conjunction with other methods. For instance, they may mail a survey that also contains a link to the online version of it, so that the respondent can fill out the questionnaire in whatever way they prefer. Oftentimes survey researchers will deliver the survey or an announcement about it via snail mail, and then follow up with a phone call or email, thereby providing multiple reminders about the survey (and possibly multiple ways to complete it).
Creating online questionnaires has become easy to do through platforms like SurveyMonkey, Google Forms, and RedCap, which administer surveys over the internet using interactive forms. This approach is relatively cheap (many platforms are free, at least for limited usage), and online forms can gather and process your data much more quickly than other methods of administering surveys. Furthermore, any changes you make to the survey occur instantaneously, without the need to print out another batch of forms—though remember that you should not be changing questions once a survey has been fielded.
To disseminate their online surveys, researchers can post a link to the survey on email listservs, social media platforms, discussion boards, or listings sites. They can target specific individuals with emails containing the survey link. They can even include a survey link on any physical flyers they distribute—perhaps using QR codes to encode the link for easy retrieval by potential respondents. It is worth noting that the rising popularity of online surveys has also created a cottage industry of for-hire survey respondents on platforms like Amazon’s Mechanical Turk or Qualtrics; some researchers who have found it hard to recruit respondents for their studies have posted surveys there, which freelancers fill out in exchange for compensation. (Buyer beware, though: in addition to the difficulties that online surveys inevitably face in gathering a representative sample, there are particular concerns about the quality of the responses obtained through these freelancer sites.)
One major advantage of using online survey platforms like SurveyMonkey and Google Forms is that they make the job of data entry much easier. Rather than having to take all the completed hard-copy questionnaires and tally up answers on every survey item, you can rely on the platform to do that work for you. Furthermore, some platforms allow you to download your survey results into file formats that are readable by data analysis programs such as SPSS and Microsoft Excel (see Chapter 14: Quantitative Data Analysis for a discussion of these programs). That means you are not restricted to doing your data analysis using the platform’s built-in tools, which can be quite rudimentary.
A key drawback of online surveys is security. With paper forms, a promise of anonymity may be easier to keep: once the data from the completed questionnaire has been harvested, the form can be destroyed, making it all the harder to link the answers back to the respondent. With all the identifying details that our online actions generate, however, you will need to be extra careful about the data you collect in this way; at the very least, you need to store your data someplace where it is password-protected and otherwise secure. Online surveys also face unique challenges such as the need to prevent multiple submissions from the same user or to keep bots or trolls from sabotaging a publicly available survey. Computing the response rate of these surveys may also be difficult to do if the survey link is posted on email listservs or online platforms instead of being emailed directly to targeted respondents. And while every kind of survey must deal with problems of sampling bias, online surveys are particularly vulnerable to it. As noted earlier, they do not lend themselves to an obvious sampling frame, which means that researchers who use online surveys often have to use quota sampling and weight their sample to match what they know about the target population (see our related discussion in Chapter 6: Sampling). Another issue that online surveys deal with is the so-called digital divide: they cannot reach people who do not have internet access or who are not sufficiently tech-savvy to complete an online survey. Even in rich countries like the United States, many rural areas and other marginalized communities lack decent and affordable internet access. Without proper adjustments, online surveys are likely to obtain samples that are skewed toward a younger, more urban, and more affluent demographic.
The alternative to self-administered questionnaires is having a researcher walk the respondent through each of the survey’s questions. When an interviewer-administered questionnaire is being fielded, the researcher conducts an interview with each respondent, posing questions directly to them rather than having them read the questions on their own. Unlike with an in-depth interview, however, the conversation is very much scripted: the interviewer reads each question in the questionnaire word for word, without any changes or improvised follow-up questions.
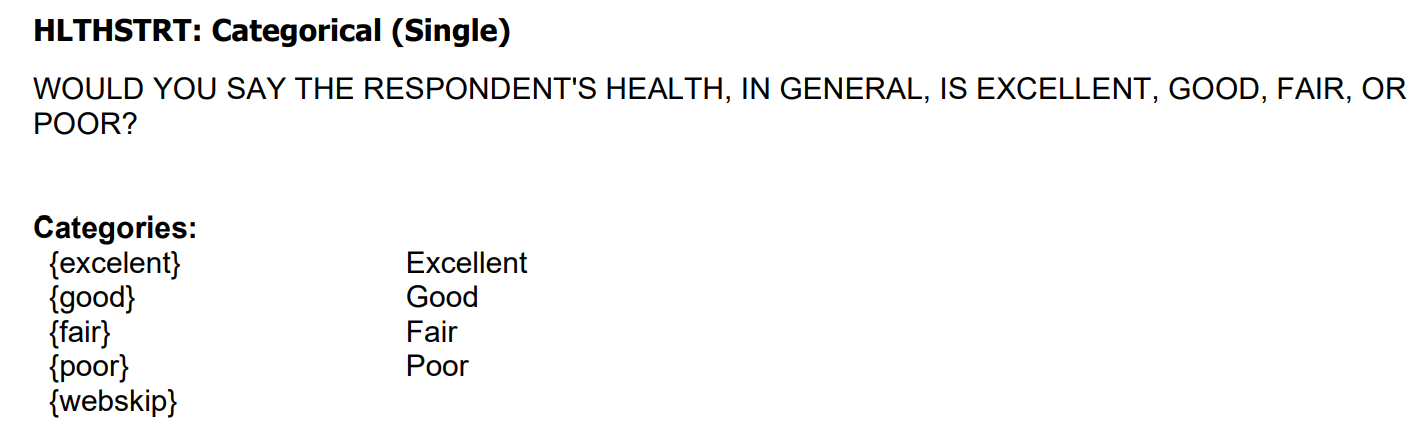
Interviewer-administered surveys are a more personalized form of data collection method than self-administered surveys. Importantly, the interviewer has the opportunity to clarify any issues raised by the respondent as the two of them go through the survey questions, hopefully addressing any confusion or concerns that may prevent the respondent from answering to the best of their ability. While the interviewers are required to follow a standardized set of questions, the interview script may contain special instructions for the interviewer that are not seen by respondents, which can affect the ordering of questions and other aspects of the interview. The interviewer may also be tasked with recording their own personal observations and reflections during the course of the interview, and as part of the survey protocol, they may even be presented with specific questions to answer about the respondent, such as generally assessing that person’s health—perhaps in addition to asking the respondent to assess their own health (see Figure 13.2 for an example).
In addition to demanding substantially more time and effort from researchers than self-administered questionnaires do, survey interviews also require trained interviewers. The researcher working in the field must be personable and enthusiastic enough to convince the respondent to sit through all the questions on the questionnaire, and they must be disciplined enough not to deviate from the survey protocol in any substantial way—that is, in any way that would make it harder to compare one respondent’s answers with another’s. The interviewer is also considered to be part of the measurement instrument, in the sense that their presence can alter the behavior of the respondent (what sociologists call interviewer effects). Survey researchers must consider how the identity of the interviewer (their age, gender, race, etc.) might influence how the respondent answers certain questions, and whether they need to vary those characteristics across their interviewers to diminish any bias created by these interviewer effects. They might also need to train the interviewer to avoid acting in ways that might bias the respondent’s answers—for instance, conveying emotions of disgust or excitement through their facial expressions in response to certain questions or response options. In general, social desirability bias is a greater problem with survey interviews, given that respondents can answer self-administered questionnaires without having to divulge any controversial opinions or sensitive details directly to another human being.
Two common types of survey interviews are face-to-face interviews and telephone interviews. In a face-to-face interview (also known as a personal interview), the interviewer meets the respondent in person. This is an approach taken by some major surveys (including the U.S. census), which may start with a sampling frame of physical addresses and send out interviewers to a sample of those addresses. As we noted earlier, face-to-face interviews tend to have the highest response rates of all survey methods: people find it harder to tell a person to their face that they do not want to participate or they want to drop out. (That said, some respondents will be more uncomfortable being interviewed in person, depending on their personality and the nature of the questions.) Particularly skilled interviewers can persuade even the most reluctant individuals to cooperate, dramatically improving response rates.
In telephone surveys, interviewers contact potential respondents over the phone, typically using some sort of directory or a random range of phone numbers as a sampling frame. The most technologically sophisticated approach to this type of survey research is computer-assisted telephone interviewing (CATI), which is widely used by academic, government, and commercial survey researchers. In this setup, the interviewer is guided through the interview process by a computer program that automatically pulls up instructions and questions to be asked on the interviewer’s screen. The system also selects respondents randomly using a random digit-dialing technique, and it records their responses using voice-capture technology.
Like with online surveys, telephone interviewing is not ideal for rural areas, where phone density is low. It also cannot be used for communicating non-audio information, such as images or video that a survey researcher wants respondents to react to. And in part because of the widespread use of caller ID, response rates for phone surveys have plummeted: many people no longer bother to answer calls from unknown phone numbers. If researchers can eventually get a respondent on the phone (through repeated calls and voicemails), they have a decent chance of getting them to agree to be interviewed. Remember our earlier advice: be polite but persistent, and ease the respondent into an interview with a line like, “How about we try some questions and see how it goes?”
Key Takeaways
- Cross-sectional surveys are administered at one time, providing a single snapshot of social reality. By contrast, longitudinal surveys are administered over time, allowing researchers to track how attitudes evolve and observe cause-effect relationships more directly.
- Retrospective surveys offer some of the benefits of longitudinal research but also come with a serious drawback—the lack of reliability in a respondent’s ability to recall the past.
- Self-administered questionnaires can be delivered in a hard-copy form to participants in person or via snail mail, but they are increasingly administered through online forms.
- Interviewer-administered questionnaires allow a researcher to clarify questions, make observational notes, and ensure that the respondent is taking the survey seriously, but they also raise concerns that the interviewer’s identity or actions might influence how the respondent responds.
- The word “poll” originally referred to the top of one’s head, and its usage as a means of counting speaks to a time when political “polling” amounted to having people in a room move to different corners depending on which candidate they supported—with the number of “heads” in each corner tallied up for each candidate (Lepore 2015). A related term is straw poll, which refers to a nonscientific poll with no random sampling (which is pretty much useless, from a social scientific standpoint); according to the New York Times columnist William Safire, the term was meant to evoke the idea throwing hay into the air to see which way the wind was blowing (Brockell 2020). Refer to Chapter 6: Sampling for a discussion of how heavily political campaigns rely upon polling to understand how potential voters think about candidates and what issues are important to them. ↵
