
3. The Role of Theory in Research
3.3. The Components of Theories
Learning Objective
Sociologists develop theories to explain social phenomena. At its most basic level, a theory is a proposed relationship between two or more concepts. Ultimately, a theory seeks to explain why a phenomenon occurs. A good theory must include four essential components (Whetten 1989):
- What? Which concepts should be considered as part of the explanation of the phenomena of interest?
- How? Now that we have identified the concepts, how are these related to each other?
- Why? What are the underlying dynamics that explain the proposed relationship between concepts?
- Who, where, when? What are the temporal and contextual boundaries of generalizability? In other words, what is the scope or range of the theory?
Let’s discuss each of these components in turn.
What Are the Concepts We Are Studying?

Concepts can be loosely defined as a mental image of a particular phenomenon that summarizes its key aspects. They are abstractions that allow us to organize and discuss our thoughts about reality. A concept captures what is distinctive or essential about that phenomenon—what applies universally, and not just to a single case.
For example, “masculinity” is a concept. What do you think of when you hear that word? Presumably, you imagine some set of behaviors, perhaps even a particular style of self-presentation. Through the upbringing we receive or the media we consume, we develop a set of shared understandings about our social world, including about what it means to be “masculine.” Of course, we can’t necessarily assume that everyone conjures up the same set of ideas or images when they hear this word. In fact, there are many possible ways to define the term. And while some definitions may be more common or have more support than others, there isn’t one true, always-correct-in-all-settings definition. For instance, what counts as masculine may shift over time, from culture to culture, and even from individual to individual.
You might be asking yourself why researchers bother defining a term for which there is no single, correct definition. But this is true for any concept you might measure in a research study: there is never a single, always-correct definition. (This tends to be less of a problem in the natural sciences—remember when we bragged about how the social sciences were harder?) When we conduct empirical research, our terms mean only what we say they mean.
As researchers, we must be careful to explicitly and clearly define our underlying concepts. This stage of our thinking process is called conceptualization. When we read other people’s work, we will want to pay close attention to how they conceptualized their work, too—which is just as important a part of their research as whether they competently conducted their interviews and analyzed their data. For instance, if we don’t thoroughly understand how a researcher has defined their key concepts, we can’t really understand the meaning of their research findings and conclusions.
Especially in quantitative research, conceptualization involves writing out clear, concise definitions for our key concepts. Think about what comes to mind when you read the term “poverty.” How do you know poverty when you see it? Is it about how much money people make? What they can buy? Where they live? Whether they have enough to eat? How their standard of living compares to those of their peers? Perhaps we could define poverty as the state of being deprived of basic necessities of life. That seems like a reasonable place to start, and in the early stage of conceptualization, it’s appropriate to brainstorm about the images and examples conjured up by concepts and play around with possible definitions.
However, this is just the first step. It’s also critical to consult previous work to understand how other scholars have already defined the concepts we’re interested in. (We’ll talk about finding and making sense of past studies in Chapter 5: Research Design.) This doesn’t mean we must use existing definitions, but understanding how concepts have been defined in the past will give us an idea about how our conceptualizations compare with the predominant ones out there. It will also help us decide whether we should adopt, modify, or challenge those conceptualizations.
After we’ve identified a clear conceptualization that we’re happy with, we should make sure that every term used in that definition will make sense to others. Are there any terms that need to be spelled out? If so, our conceptualization is not yet complete. Also, concepts possess different levels of abstraction. Some concepts, such as weight and age, are relatively precise and objective, while other concepts, such as personality and prejudice, may be more difficult to measure or visualize.
Sometimes, sociologists borrow concepts from other disciplines or even popular culture to explain a phenomenon of interest. For instance, distance is a basic concept of physics, but sociologists can apply this concept to understanding the degree of social separation between two individuals—whether they know the same people, or whether they feel affinity or hostility toward the other person’s social background. As that example suggests, sociologists often use existing concepts that are familiar to many people as metaphors for social life. To take one example, Michèle Lamont (1994) described the ways that people within one group try to distinguish themselves from people outside that group as boundary work. In doing so, she took an everyday physical concept—boundaries—and used it to illustrate a social phenomenon in a more intuitive and accessible way.
Let’s go back to the concept we started this chapter with, “masculinity.” Suppose we decide to follow other researchers by defining “masculinity” as “the social roles, behaviors, and meanings prescribed for men in any given society at any one time” (Kimmel and Aronson 2004:503). So now we’re done, right? Not so fast. If you’ve ever met more than one man in your life, you’ve probably noticed that they are not exactly the same, even if they live in the same society and at the same historical period. This could mean there are different dimensions of masculinity.
More complex concepts (here, the term construct is often used) encompass multiple ways of measuring or thinking about that particular concept. You might hear sociologists talk about multidimensional concepts, which are essentially overarching concepts formed from many underlying concepts. Culture, creativity, and writing skill are examples of these higher-order abstractions. For example, a person’s writing skill could be measured by a person’s vocabulary, grammar, and spelling. Each of these dimensions are important when thinking of someone’s writing skill, but each of them alone doesn’t adequately capture the overall concept.
Concepts have multiple dimensions when we can think of ways that representatives of that concept—say, “masculine” individuals—differ in the ways they express or embody that same concept. For example, we might consider how masculinity varies by region (is masculinity defined differently in different regions of the same country?), age (is masculinity defined differently for people of different ages?), or status (is masculinity defined differently for people who are members of privileged groups?).
Even within one culture, masculinity can have a variety of manifestations or aspects. For example, the Bem Sex Role Inventory (Bem 1974) includes multiple dimensions to describe traditional American masculinity, such as individualism, athleticism, dominance, aggressiveness, self-reliance, willingness to take risks, and leadership ability. Depending on your research question, each of these dimensions can be measured separately, or they can be combined into a single measure assessing overall masculinity.
Defining our concepts precisely and capturing all their relevant dimensions becomes even more important once we start measuring them in the real world. For instance, a seemingly simple concept such as income can be measured in many different ways. Are we talking about monthly income, or annual income? Their income before taxes, or after taxes? Their personal income, or their family income? Scientific research requires operational definitions that define concepts in terms of how we will actually measure them when collecting our data.
Stating how a concept will be measured—that is, defining it operationally—is called operationalization. We use a particular term to describe the operationalized form of a concept: variable. At its most basic level, a variable is a quantity or characteristic that can vary, and scientists often use this term interchangeably with “concept.” Formally speaking, however, a variable refers to a measurable representation of a concept—in other words, one particular way (out of many possible ways) that we have decided to measure this intangible idea. As abstract entities, concepts are not directly measurable. Variables are the ways that we choose (remember the idea of choice here) to measure them according to some operational definition. We’ll describe in detail the process of developing conceptual and operational definitions for our concepts in Chapter 7: Measuring the Social World.
If we are collecting our data for a quantitative research project, we generally need to do a lot of the work of conceptualization and operationalization upfront. Among other things, we should be certain about how we’ve defined our concepts before we start fielding the research instrument—the survey questionnaire or interview guide we’re using to measure those concepts. The content of the instrument must reflect the conceptualization process. For example, if we are surveying people about what policies they think should be enacted to reduce “poverty,” we’d need a clear definition of the term to guide us as we write up questions for our questionnaire.
Conceptualization in qualitative research proceeds a bit differently than in quantitative research. Because qualitative researchers are usually interested in the understandings and experiences of their research participants—the people or communities they study—it is less urgent for them to settle upon fixed conceptual definitions before starting to interview or interact with participants. For instance, if you were conducting qualitative research on the meaning of poverty, you would likely start by consulting previous literature and coming up with a working definition for poverty. This working definition would merely be a place to start, and you would not think of it as the only or best definition out there. (Working definitions often change over the course of your investigation, particularly as you get to know your field site or the group of respondents you’re interviewing.) You would bring this working definition of poverty into the field with you, but the definition that would really matter would likely be the one that your participants shared through their comments and behaviors during your data collection.
Note that your research participants’ definitions of a concept might not fit well with how scholars understand it. Consider, for instance, how differently ordinary people think about racial categories than researchers who study race do. These popular, or folk, understandings of concepts may or may not be “right,” but for the qualitative researcher, what’s often more important is how a person’s definition of a term may influence the ways they act. In this regard, your participants serve as indispensable experts that guide your research, telling you how people from their group or background understand any concepts you uncover. Typically, your job here as the researcher is to accurately and reliably record and interpret their understanding of the concepts they describe—not to impose your own understanding on them.
Because qualitative concepts change as researchers learn more information from their participants, getting them to comment on, extend, or challenge the definitions and understandings of other participants is a hallmark of qualitative research. This is typically the opposite of the approach taken by quantitative researchers. For quantitative studies, definitions must be set in stone before the data collection can begin. That’s because the research instruments—the survey questionnaires being used, for instance—can’t usually be revised after you start using them. Otherwise, the data you collect before and after those revisions can’t be compared on an apples-to-apples basis.
That said, regardless of whether you have chosen qualitative or quantitative methods, you should have clear definitions for your chosen concepts, and you should make sure that all the terms you use in those definitions are equally clear. That way, other scientists will know exactly what your terms do and do not mean—and can therefore evaluate your work fairly and accurately.
Deeper Dive: Revising Our Social Realities

Conceptualization must be open to revisions—even radical revisions—as scientific knowledge progresses and cultures change. We should remember that concepts are abstractions from reality, but they are not themselves reality. Forgetting this fact sometimes causes problems for researchers, and that’s why we have a special name for this error in logic: reification. Reification is the assumption that an abstract concept exists in some concrete, tangible way. If we wanted to be a true skeptic, we might see elements of reification in all aspects of our social lives. For instance, what is a “nation” like the United States, China, or India? Can we say that a “nation” has certain goals or preferences? If you peel away at this problem, you’ll find that at the end of the day the concept breaks down, and what we’re really talking about is specific government officials, or specific segments of the country’s population, who feel and act a certain way.
As social scientists, we can go down a rabbit hole of questioning everything and anything, and as we’ll describe later in this chapter, some sociologists adopt this critical perspective. But even if you acknowledge how simplified our social reality can be, you still want to be wary of how reification can muddy your thinking as a researcher. Think about the term “family.” If you were studying this concept, it would be important for you to consider the many differing ways that scholars—and the broader public—have conceptualized “family” over the years. Fifty years ago, researchers would have understood families in narrower ways than is common today. For example, they might have defined a “family” as “people related to one another by blood, marriage, or adoption.” Their research on families would therefore have considered only those social groups fitting that definition. But if adopted such a definition today, it would leave out, among other things, the growing numbers of people who choose to live together without marrying. Here, we would want to avoid reifying the concept of family by taking it to eternally mean one sort of household arrangement.
It’s not that researchers in the past were wholly wrong to adopt definitions of concepts like “family” that researchers today have largely abandoned. They were basing their definitions on what people knew at the time, and what practices were common. Their definitions of family were as real to them as our definitions are to us today. Furthermore, scholars typically want to reach some sort of lasting agreement about what various concepts mean, so that they can compare their results across studies and time periods. That said, if each new generation of researchers never challenged past conceptualizations, our scientific knowledge would be filled with blind spots, anachronisms, and prejudices from years ago. As important as scientific consensus is in building a robust body of knowledge, sociologists should never forget that particular people—from particular cultures in particular historical moments—have assigned the definitions widely used to describe the social world. These definitions are imperfect and subject to change.
How Are Our Concepts Related to Each Other?

In order to explain social life, sociologists don’t just identify key concepts relevant to a given social phenomenon. They also show how those concepts are related to each other. This can be as simple as saying that one type of group is associated with one type of behavior. For example, for her classic ethnography Unequal Childhoods (2011), Annette Lareau and her research team observed how parents raised their children. She found that middle-class parents took on a different parenting strategy than working-class or poor parents. Middle-class parents were more likely to act in ways that we associate today with “helicopter parenting”—filling their children’s schedules with enrichment activities, taking an active role in shaping academic and extracurricular interests, frequently engaging with their kids to talk through intellectual topics. Less affluent parents did not love or care about their children any less, Lareau argued, but they left their kids to their own devices, reasoning that children should be allowed to be children, with freedom and unstructured time to spend as desired. In Lareau’s theory of parenting, being a middle-class parent was associated with more engaged parenting—what she called concerted cultivation—and being a working-class or poor parent was associated with more hands-off parenting—what she called the achievement of natural growth. (Like Michèle Lamont did with her theory of boundary work, Lareau uses familiar imagery to make her theory more accessible—here, invoking a gardening metaphor of tending to plants.)
Depending on their intended use, variables may be classified as independent or dependent variables. An independent variable is a variable that we believe explains another variable. Specifically, changes in the independent variable are thought to cause changes in the other variable, which we call a dependent variable (because it “depends on”—is explained by—the independent variable). In the example study we just described, social class was Lareau’s independent variable, and parenting strategy was her dependent variable: being from a particular social class meant that parents raised their children in a particular way, Lareau argued.
Let’s break down how independent and dependent variables relate to one another. First, it’s worth mentioning at the outset that the letters “X” and “Y”—either in their uppercase or lowercase forms—are traditionally used to designate independent and dependent variables, respectively. (When scientists create graphs to show the relationships between two variables, they typically represent the independent variable with the horizontal X-axis and the dependent variable with the vertical Y-axis.) Second, it sometimes helps to use analogies to think about the relationship between your independent and dependent variables. For instance, think of a speaker whose volume you control with a knob. The dependent variable in this (contrived) case would be the volume. Here, we are measuring (in our lingo, operationalizing) volume in decibels, and our specific measurement, or value, of the variable can range from zero (no sound) to however loud the speaker can go. The setting of the knob is our independent variable: if the knob went from 1 to 11, the value of our independent variable would range from 1 to 11. We can manipulate the setting for our independent variable (that’s why it’s “independent”) and then the volume of the speaker will “depend” on the knob’s setting. If the values of the dependent variable change as we shift between values of the independent variable, we say these two variables are correlated, or associated; if the values of the dependent variable are unaffected, we say the two variables are uncorrelated, or unassociated. Correlation means that the two variables are related to some extent—an extent that we can actually measure with quantitative analysis, as we will see.
The example we just gave used two variables that were measured numerically—volume setting and decibels. But variables don’t have to be quantitative. As we will describe in Chapter 7: Measuring the Social World, concepts like gender can be categorized qualitatively—varying across categories like male, female, nonbinary, and so on (the different categories here are called attributes). A qualitative variable can serve as an independent variable, with shifts across its categories possibly explaining another variable. It can also be a dependent variable, with changes in another variable helping determine which of its values or attributes we see.
When we are analyzing concepts that can be quantified—whose measured values (i.e., variables) can increase or decrease—we can go further in describing the relationship between them. Specifically, we can describe any correlation that exists as positive or negative—what social scientists call the direction of the relationship. A positive relationship between an independent variable and dependent variable means that as the value of one variable increases, the value of the other variable also increases. A negative relationship (or inverse relationship) between two variables means that as the value of one increases, the value of the other decreases, and vice versa. Remember that this idea of “directionality” only applies to numerical variables that can actually increase or decrease.
Let’s use the work of political scientist Robert Putnam to illustrate these two relationships. Putman’s seminal book Bowling Alone (2001) argued that civic engagement was on the decline. His analysis found that Americans’ involvement in civic life—how often they volunteered for community organizations or joined clubs, whether they voted, how active they were in their religious communities, even how often they bowled in bowling leagues—had fallen dramatically over the previous decades. While a number of factors contributed to this drop in engagement, Putnam highlighted the role of television. To put it in simple terms, his theory proposed that the more TV people watched, the lower their involvement in civic life. And his data appeared to back up that claim, with measures of civic engagement falling as television watching increased in the late 20th century.

Here, we can see how Putnam’s theory contains the what and how elements of good theories. It proposes a relationship between two or more concepts—in this case, civic engagement and television watching. It describes the direction of the relationship, which happens to be negative: as civic engagement goes up, TV watching goes down, and vice versa. Putnam’s theory also put forward specific reasons that television watching might be causing lower civic engagement—the why element of theory. In his view, people were using up more of their limited free time to watch TV, thanks to how enticing and pervasive this content had become. As a result, they didn’t have the free time to get involved in their communities. Note that Putnam didn’t have as much evidence to back up this why part of his theory—that TV watching caused people to become less engaged citizens. He saw a clear correlation between these two variables, with their measured values moving in step with each other over the years, but it was harder for him to make a definitive case that television watching actually caused lower involvement. Specifically, Putnam couldn’t rule out that people were just less interested in volunteering for reasons that had nothing to do with the appeal of TV. (We’ll talk more about this issue of causality later in the chapter.)
When describing the relationships between their concepts of interests, qualitative researchers tend to shy away from using terms like “positive correlation” or “negative correlation,” which fit more with the formal language of quantitative research. That said, we can still talk about the direction of many relationships in qualitative studies. Take Lareau’s study of parenting. We could quantify her two concepts—saying that middle-class households are higher up on a scale of socioeconomic status, and saying that concerted cultivation is the state of being more engaged as a parent. Then we could say there is a positive correlation between socioeconomic status and parental engagement: as socioeconomic status rises, parental engagement increases. It’s worth noting here that qualitative scholars may protest when other researchers reduce the complex relationships they describe into simple quantitative associations. We’ll talk more about these issues in the later chapters devoted to qualitative research methods.
Especially in quantitative studies, researchers will explicitly state the relationship that they believe exists between two or more concepts in a hypothesis.[1] The hypothesis is a scientific conjecture—an educated guess—about how these concepts are related. An example of a hypothesis is: “An increase in a child’s family income causes an increase in the amount of education they later attain.” This statement does not have to be true, but it must be empirically testable—that is, the researcher must be able to use data to judge whether it is true or false.
A good hypothesis also specifies how the underlying concepts will be measured. We can make our example hypothesis more concrete by using specific variables—specific operational definitions—in place of the concepts above. For example, since annual household income and years of education are ways of measuring income and educational attainment, respectively, we can substitute them in our hypothesis, like so: “An increase in the annual household income of a child’s family causes an increase in the number of years of education they later attain.”
How do we develop hypotheses? We can generate them using logic. Given what we know about existing theories, what sorts of reasonable and concrete hypotheses can we think up, which we can then go out and test? Our empirical observations (or those of past studies) may also suggest certain patterns—certain relationships between concepts—and our research can see if those patterns hold up more widely. (As we will describe in the next chapter, these two approaches—one starting with theory and one starting with observations—can be described as deduction and induction, respectively.)
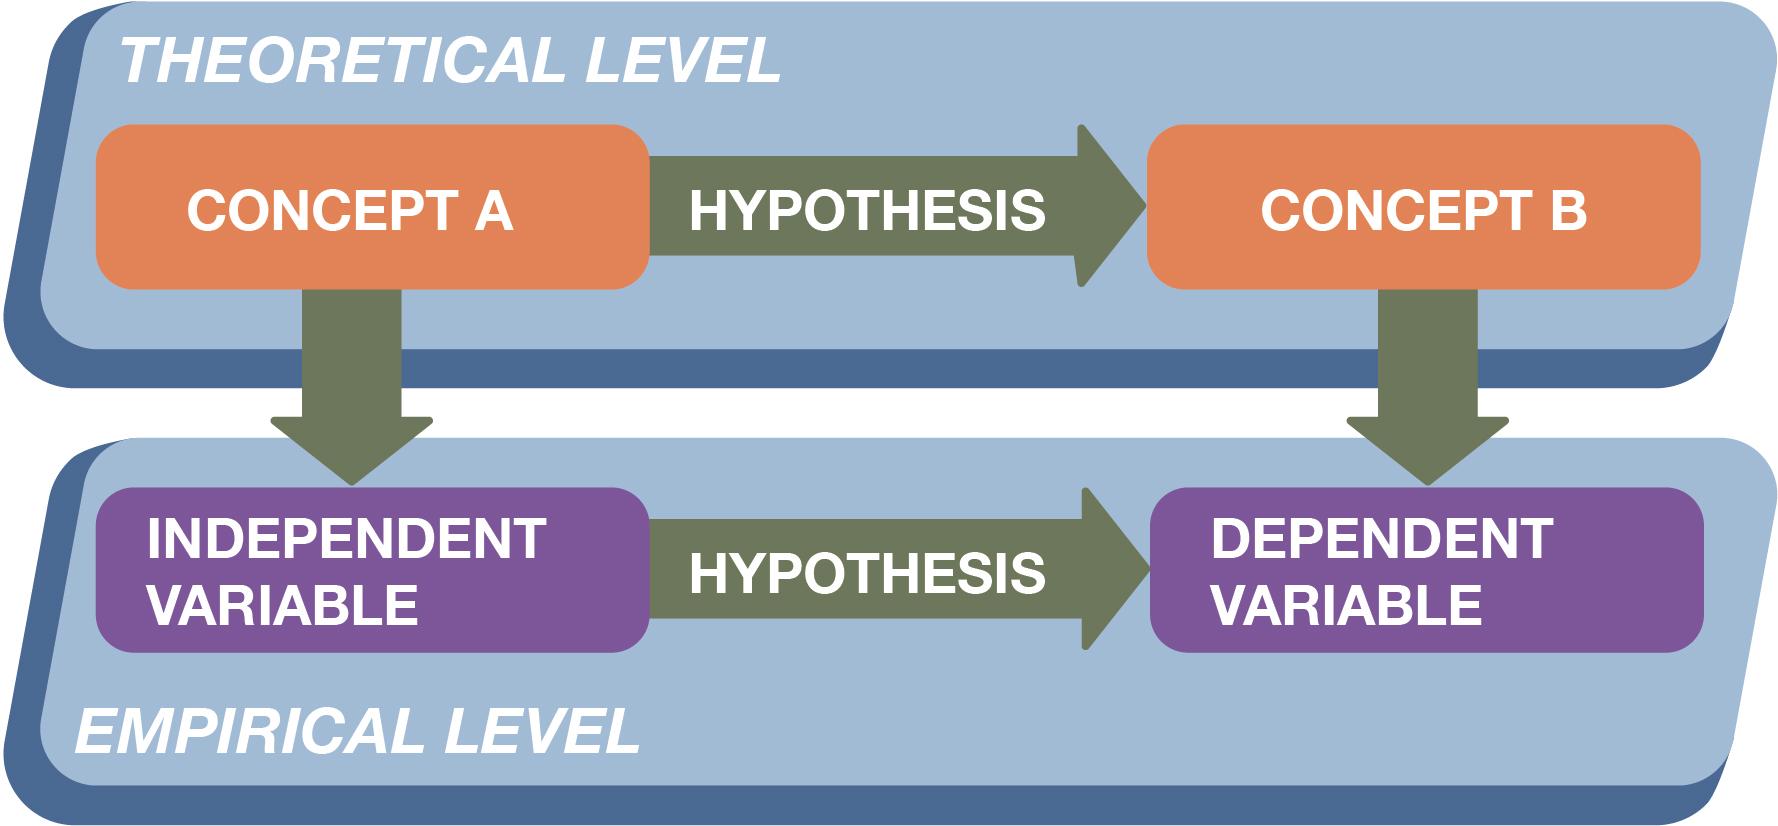
Let’s connect what we’ve learned so far regarding concepts, variables, and hypotheses. Figure 3.2 illustrates how social scientists operate on the two levels we described at the beginning of this chapter: a theoretical level and an empirical level. Through theory, they connect abstract concepts that describe our social world, and through empirical observation, they measure those concepts using concrete variables. They generate hypotheses that link multiple concepts—and link the variables corresponding to those concepts—and put forward our best guesses about the nature of those relationships. Then they test those hypotheses using the observations they have systematically collected.
Thinking like a researcher means becoming skilled at moving deftly back and forth between these theoretical and empirical levels. As social scientists, we ultimately are interested in theoretical relationships—the ways that abstract concepts like income and education relate to one another and thereby influence people’ lives. But we conduct research in the real world, which means we need to measure these concepts in concrete terms—by dollars of annual household income, for example, and years of acquired education.
Figure 3.2. The Theoretical and Empirical Levels of Research
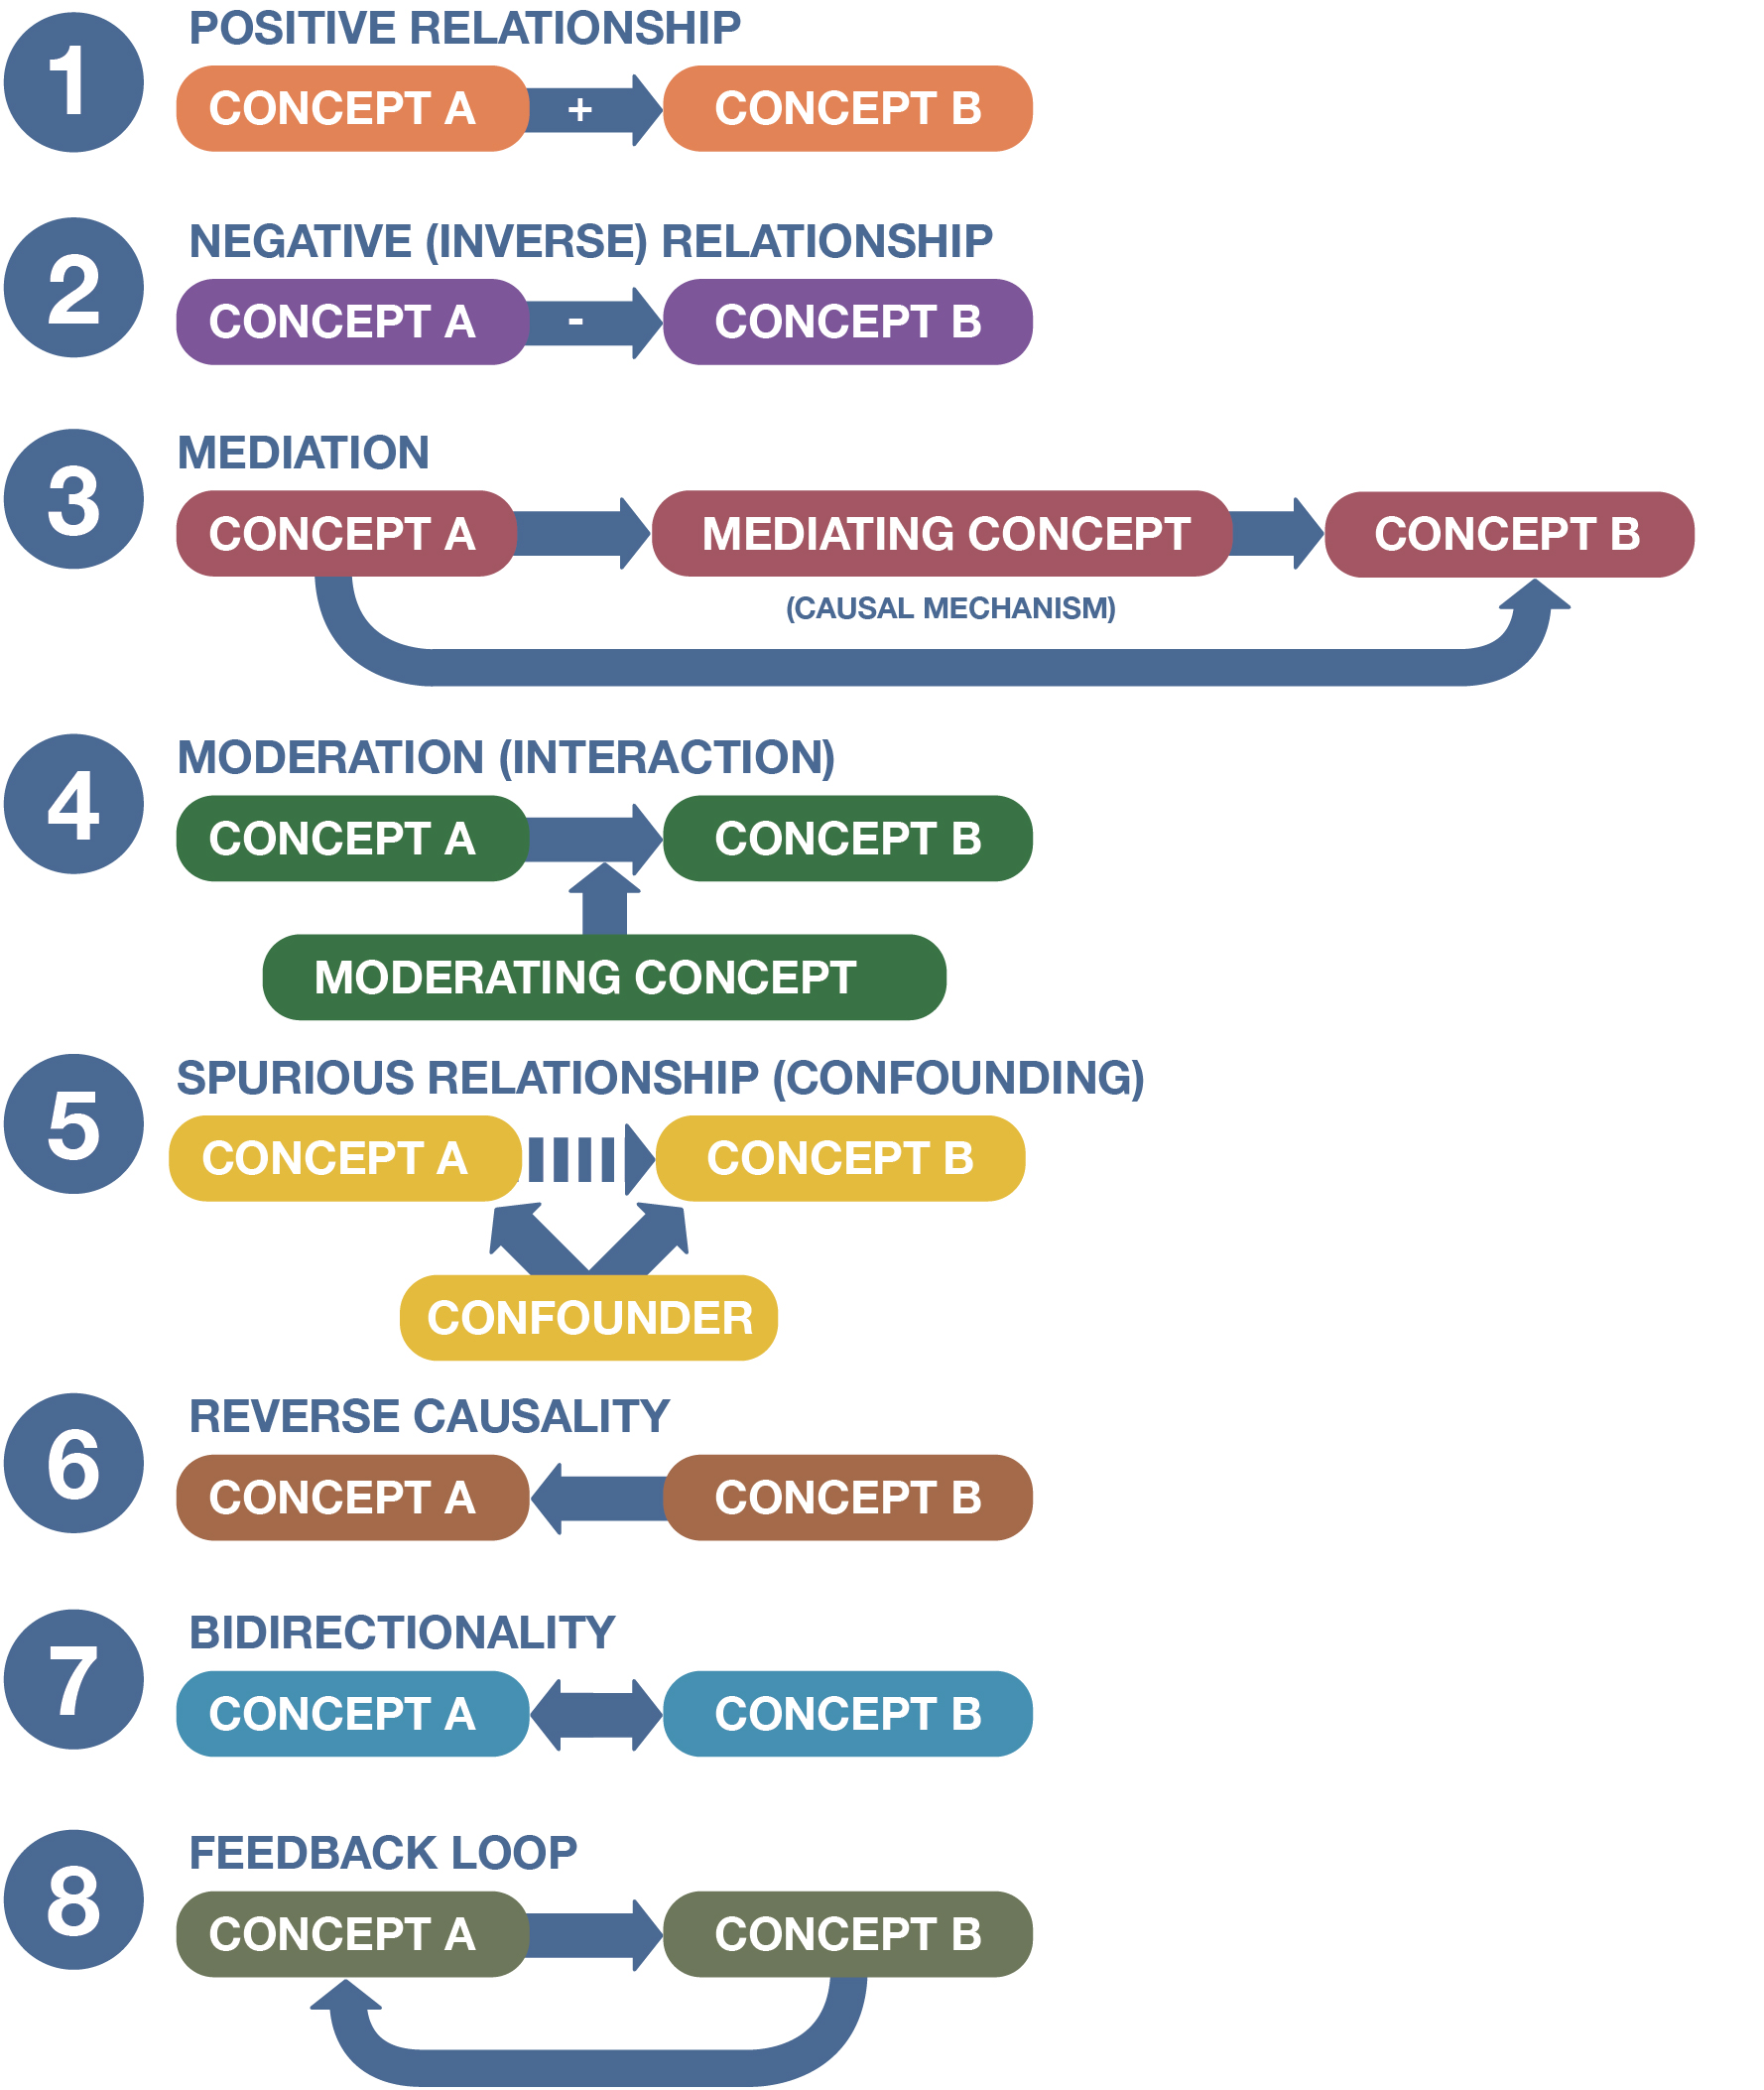
As you consider how concepts relate to one another, it’s useful to visualize those relationships with boxes and arrows, as in Figure 3 below. This is called a concept map. Each box refers to a specific concept (or its measurable representation, a variable). The plus or minus sign above the arrow in each diagram indicates the direction of the relationship: positive or negative. (Note that the relationship between qualitative concepts won’t have directionality, as they can’t be said to “increase” or “decrease.” For example, more men than women may say blue is their favorite color, but we can’t say the relationship here is positive or negative, since neither concept—gender or color—is being quantified.)
The arrows between the boxes show the direction of causality. “Direction” in this sense is different from the “direction” of a relationship. In the first two diagrams, the arrow goes from concept A to concept B, and so we say that a change in concept A causes a change (either positive or negative) in concept B. If the arrow were reversed, we would say a change in concept B causes a change in concept A. Sometimes the direction of causality is obvious. Hot summer days cause more ice cream consumption, as any ice cream van driver knows well, but your decision to eat gallons and gallons of Rocky Road ice cream will have no effect on local temperatures (unless you eat so much that global ice-cream production must ramp up to satisfy your insatiable appetite, thereby generating more carbon emissions and worsening climate change—not really the likeliest scenario, but we won’t judge). However, in many cases, the causal arrow could go in either direction, as we discuss further below.
Figure 3. The Relationships between Concepts
Why Are Our Concepts Related to Each Other?
As we have described, theory is the tissue that connects raw data and critical thought. To put this another way, the what (concepts) and how (relations between concepts) constitute the subject of the theory—what we are studying—but they are merely descriptive. The why provides the explanation. Data (be it quantitative or qualitative) describes or characterizes; theory explains.
In the Bowling Alone study mentioned earlier, Robert Putnam analyzed data over decades showing that civic engagement had declined and TV watching had increased. But data alone is not particularly informative. If Putnam had not proposed a relationship between the two elements of social life, we may not have realized that television viewing does, in fact, reduce people’s ability and desire to participate in civic life. In order to understand the social world around us, it is necessary to develop theory to draw the connections between seemingly disparate concepts.
Another example of sociological theorizing illustrates this point. In his classic work Suicide (1897), Émile Durkheim was interested in explaining a social phenomenon, suicide, and employed both data and theory to offer an explanation. By aggregating data for large groups of people in Europe, Durkheim was able to discern patterns in suicide rates and connect those patterns with another concept, religious affiliation. Durkheim found that Protestants were more likely than Catholics to die by suicide. But why exactly was this the case? To explain this relationship, Durkheim applied his theory of social solidarity, which claimed that not being closely connected to other people—which he argued characterized life in many industrialized societies—would make individuals feel a lack of direction and stability, putting them at greater risk of suicidal thinking. Applying his broader theory to the data he was analyzing, Durkheim argued that the looser social ties found in Protestant religions led to weaker social cohesion, which in turn made Protestants more likely to die by suicide.
Without good explanations for why different concepts are related, we cannot understand what factors cause what outcomes in social life. Analyzing these cause-and-effect relationships is a key way that the social sciences help us to better comprehend our reality. While Durkheim’s analysis was flawed (a topic we’ll explore further in Chapter 7: Measuring the Social World), his study was a novel and pioneering use of theory to explain the relationship between two concepts that we might normally think have little to do with one another—suicide and religious affiliation.

Let’s turn back to Figure 2. Diagrams 3 through 5 can help us further flesh out our thinking about how and why concepts might be related to one another. So far we’ve been talking about relationships between two concepts, but as these diagrams illustrate, theories can link three or more concepts. Here you can see representations of mediated, moderated, and spurious relationships. You should know that these terms, like the terms positive and negative correlations, are more frequently associated with quantitative methods—even though qualitative researchers must also think carefully through the complex ways that their concepts might be related to another. It’s also worth reiterating here that many social scientists will use the term “variable” instead of “concept” when discussing these relationship types—they’ll talk about “mediating variables,” “moderating variables,” and “confounding variables,” for instance. We’re going to use the term “concept” to be precise, since variables are really the operationalized form of the underlying concepts, but many studies you read will do otherwise.
In mediation, a concept essentially stands between and links two other concepts. You can think of a mediating concept (or linking concept) as the pathway by which one concept affects another. As you can see in Diagram 3, the mediating concept is explained by concept A—that is, the measured value of the mediating concept changes as the value of concept A changes. In turn, concept B is explained by the mediating concept—its values change as the values of the mediating concept changes. If the degree of mediation is particularly strong, the linking concept can largely account for any influence that concept A has on concept B—it’s the causal mechanism here, the specific way that concept A affects concept B. An example is helpful here. Involuntarily losing their job often makes people feel depressed or anxious. It does so through specific mechanisms—for instance, by making people scared about whether they can pay their bills and otherwise make ends meet (what’s called financial strain). We could therefore say financial strain is an important mediator between unemployment and psychological distress. One way that quantitative researchers identify linking concepts like financial strain is by seeing if the correlation they observe between two concepts disappears when a third concept that logically could be driving that relationship is accounted for in their analysis—in that case, the third variable may play a mediating role.
When we discuss qualitative research in later chapters, we’ll have a lot to say about mediating concepts, which qualitative researchers are particularly good at identifying. Qualitative researchers, however, tend not to use the term “mediation,” but instead often talk about causal mechanisms (also called social mechanisms)—again, the specific ways that one concept affects another. You can think of social mechanisms as the literal “mechanisms”—the gears and belts—within a machine. With a physical machine, you put something into the box—say, harvested cotton in a cotton gin—and out comes something else—the cotton fibers stripped of their seeds. But what is happening within the machine? What mechanisms are operating that turn the input into the output? These are the causal mechanisms we wish to identify within the intangible “black box” of social life. They get at the essential why questions we seek to answer with our theories.
Indeed, qualitative studies frequently focus on these causal mechanisms, trying to flesh out a causal story (or explanatory story) of how exactly the input leads to the output. For example, countless studies have investigated how coming from a wealthy family makes it easier to become successful. But how exactly does that occur? Is it based largely on how much money one’s parents can pay for important investments like college tuition, or is it based on other resources that the family can bring to bear, like job contacts they have access to, or the knowledge and habits they instill regarding how to present oneself as a professional? Here, the ways that qualitative methods generate rich detail and illustrate complex processes can give us a particularly insightful understanding of the causal mechanisms linking concepts. Take Shamus Rahman Khan’s (2011) influential study of an elite private school, which showed how children of wealthy families benefited not just from access to costly academic opportunities, but also from less tangible advantages—such as the outward sophistication and “ease” they had acquired from their upbringing, which helped them win over college admissions committees and other important gatekeepers. Through studies like Khan’s, we can see the many concrete ways that the input of family wealth brings about an output of later success. Qualitative researchers focus so much on causal mechanisms in part because of their inclination to explain processes in such detail—in a sense, deciphering the machinery of the social mechanisms at work.
In moderation (also known as interaction), there is a concept that influences or shapes the relationship between two concepts. Specifically, the presence of this moderating, or conditioning, concept weakens or strengthens (or otherwise affects) the relationship between concepts A and B. As you might guess, it’s very easy to confuse mediation and moderation, given the similarities in what they do. It may be helpful to think of mediating concepts as standing between two concepts (Diagram 3)—that is, being the pathway by which one concept affects the other—and moderating concepts as changing that relationship (Diagram 4).
Let’s consider an example of a moderating concept. Katharine Donato and Gabriela León-Pérez (2017) analyzed data collected in Colombia to investigate if individuals with more education were more likely to emigrate to the United States. Indeed, the data showed that higher educational attainment was associated with a higher likelihood of migration. However, this relationship operated differently for men and women: as education increased, the corresponding boost in the likelihood of migration was greater for women than for men. Here we might say that gender is a moderating concept that changes the relationship between education (concept A) and migration to the U.S. (concept B). Put in a different way, there is a moderation effect (or interaction effect) at work here: the association between an individual’s education level and their migration decisions is different for men and women, given how gender moderates that relationship, or how gender and education interact in predicting migration.[2]
For quantitative variables, you might think of a moderating variable as either (1) steepening or (2) flattening the slope of the line that describes the relationship between two variables. In the first case, it makes the presumed effect of the first variable on the second stronger. In the second, it makes the presumed effect weaker. Sometimes, in fact, moderation can turn a positive relationship into a negative one, and vice versa. (We’ll talk more about how relationships between variables can be graphed in Chapter 14: Quantitative Data Analysis.)
Finally, spuriousness refers to situations in which the relationship between two concepts seems to exist but, in reality, they are linked by a third concept, what is called a confounder (or confounding variable). Diagram 5 depicts a spurious relationship. Here, concepts A and B are correlated, but no actual causal relationship exists between them (hence the red X). Instead, the confounder is related to both concepts; it “confounds” our understanding of the actual relationship between them. One well-known example of a spurious relationship is the link between coffee consumption and mortality: people who drink a lot of coffee have, on average, a higher risk of death. But a confounding variable—smoking—explains this relationship. People who smoke tend to drink coffee, and therefore the higher mortality rate we observe for coffee drinkers is due to the fact that they disproportionately smoke and are vulnerable to the many illnesses associated with smoking. In fact, when researchers statistically account for tobacco-smoking and other confounders, they find an inverse relationship between coffee consumption and mortality—that is, more coffee drinking is associated with a lower, not greater, risk of death (Freedman et al. 2012). (We call a confounder that actually reverses the association between the independent and dependent variable a suppressor variable.)
Let’s consider another example of potential confounding, which we’ll return to throughout this section. We may see a correlation between the amount of time children play violent video games and the aggressive behaviors they display, but that doesn’t mean the relationship is causal (this is a contentious issue in the research literature on this topic, in fact). Instead a third variable—say, a lack of parental attention—may cause both the playing of violent video games (perhaps because children are left unsupervised) and the aggression seen in children (perhaps because the children feel unloved).
You might have heard the saying, “Correlation is not causation,” and it is advice to take to heart: just because we see a correlation between two concepts doesn’t mean the relationship is causal. In the policy world, it is especially vital to identify spurious relationships because we can draw erroneous conclusions based on them. People feel strongly about banning or regulating certain products—from violent video games, to pornography, to guns—based on the correlations observed between their use and various negative social outcomes. However, it is not always clear that the relationships are causal—we just mentioned one possible confounder when examining the relationship between violent video games and aggression. If the underlying relationship is not causal, then a proposed ban or regulation won’t bring about the positive benefits we hoped to see. Instead, we will need to identify and address the real cause of the problem—which may happen to be a confounder we overlooked or couldn’t easily measure. Clearly, we don’t want to be making policies based on spurious correlations. We may spend lots of time, money, and other resources trying to influence one factor when another is really driving the phenomenon we’re interested in.
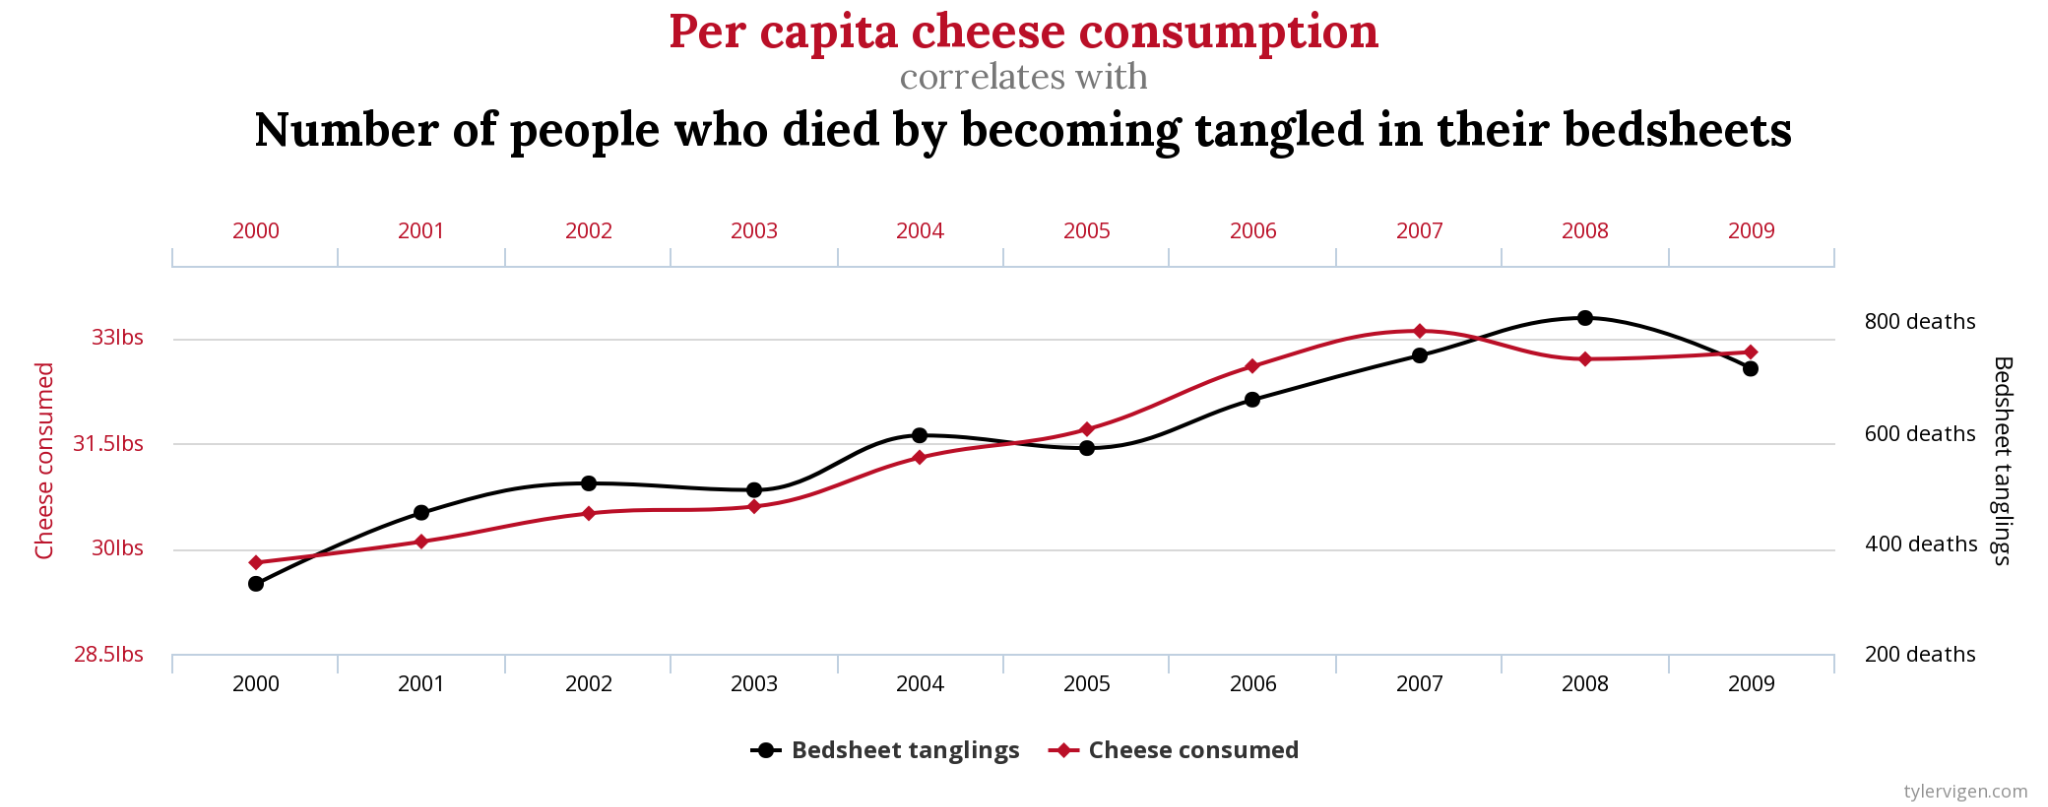
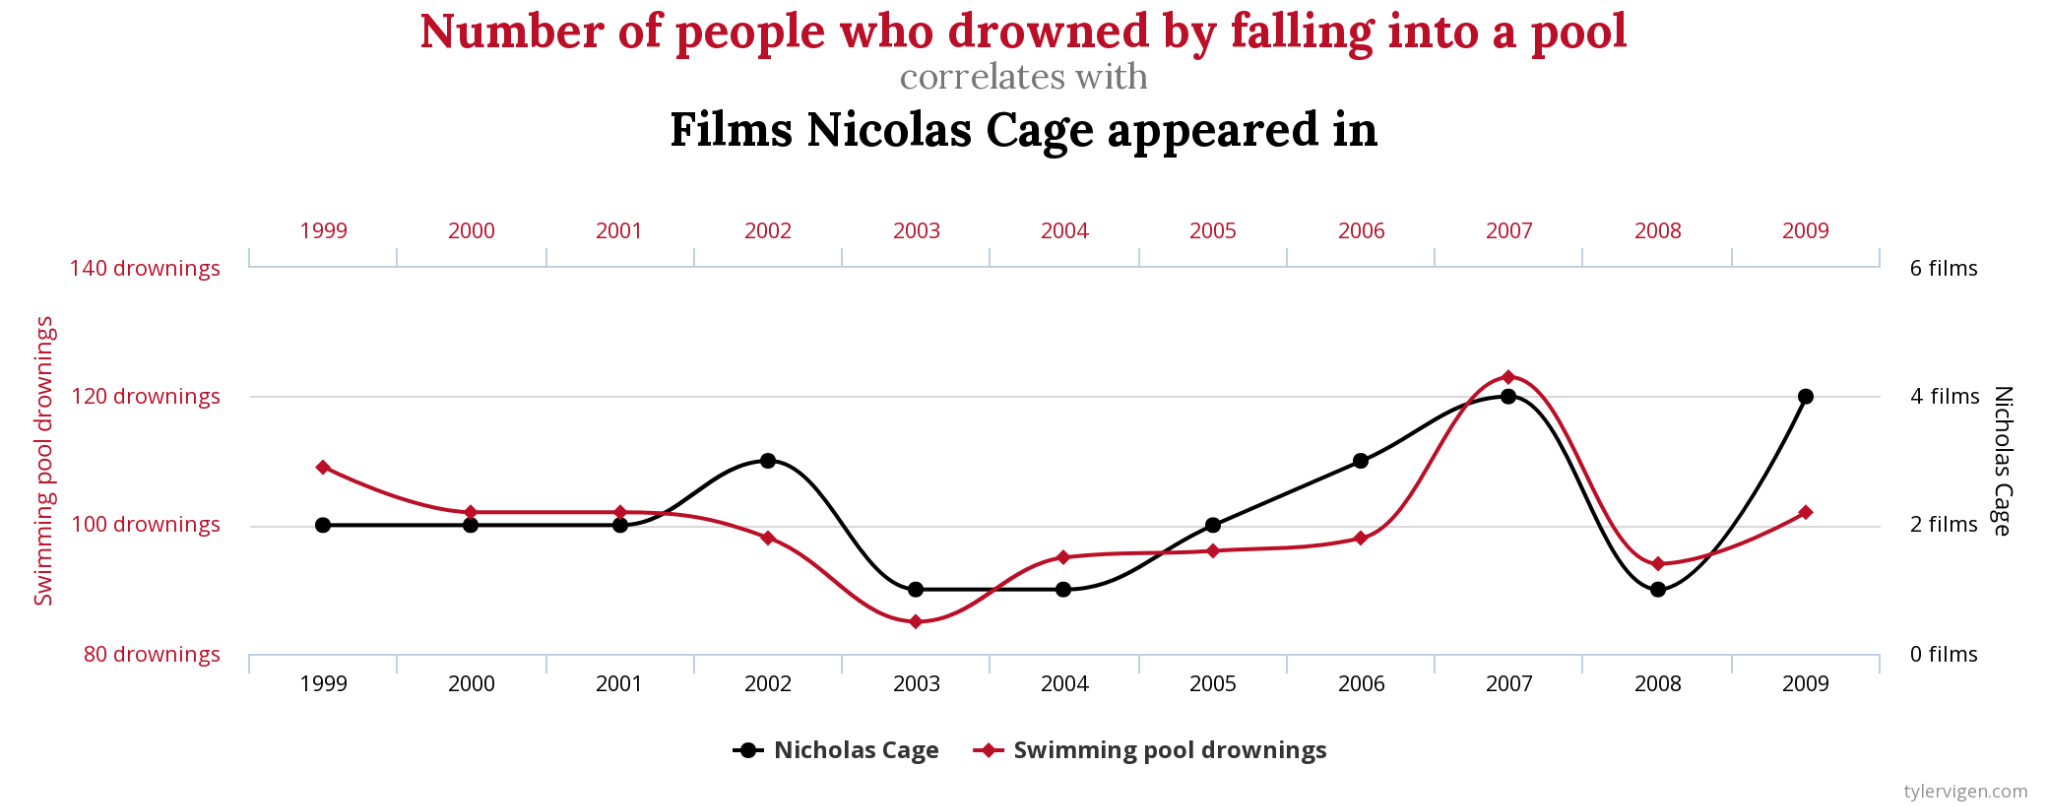
There are two possible reasons for spurious relationships. First, the relationship we observed may simply be due to chance. A website (and now book) called “Spurious Correlations” describes a number of fortuitous relationships between bizarrely matched variables. For example, it turns out the number of films the actor Nicholas Cage appears in every year is highly correlated with the annual death toll from people drowning by falling into pools. The correlation is even stronger between annual per capita cheese consumption and the number of people who die each year by becoming tangled in their bedsheets. Of course, none of these variables are related to the others. But sometimes social scientists can be fooled into thinking a causal relationship exists between two variables because changes in one appear to follow changes in another. Here, we need to start off by logically thinking whether one of our concepts could possibly affect the other one. (And no, a logical explanation is not one where the atrociousness of Nic Cage’s movies inspires mass drownings.) If we can’t think of any causal mechanisms that might conceivably connect these two concepts, we have grounds to conclude that the relationship we observed is spurious. In addition to using logic, another way to rule out chance correlations is to collect more data. Indeed, the “strong” correlations shown on the “Spurious Correlations” website very much depend on the choice of the years of data being shown. If you use a broader date range, you should see these chance correlations disappear.
The other reason that we come across spurious correlations is more serious and difficult to overcome. As we noted earlier, a third concept, the confounder may be related to our two concepts of interest, driving changes in both. As a result, we may think that shifts in concept A cause shifts in concept B when really a third concept lurking in the shadows is causing these changes—for this reason, sometimes social scientists call confounders lurking variables. (In Chapter 12: Experiments and Chapter 14: Quantitative Data Analysis, we’ll talk about how we can use controls—control groups or statistical controls, respectively—to address confounders.)
A somewhat related issue is reverse causality. In certain cases, we may believe that a change in concept A causes a change in concept B, but the opposite is actually the case (see Diagram 6). Consider the example we mentioned earlier: is it the case that violent video games cause aggression in teenagers, or do teenagers who already have aggressive tendencies—and who would have them regardless of whether or not they touched a violent video game—just prefer to play these sorts of games? The correlation we observed in the data between playing violent video games and having aggressive tendencies could be evidence of either scenario. To put it another way, both causal stories are possible based on the data we have. We don’t have a clear-cut answer to our why question about the reasons behind the correlation we’ve observed.
It is important to remember that a simple correlation between two variables doesn’t tell us in which direction the causal arrow points. Just like correlation is not causation, correlation by itself says nothing about which concept is driving the changes we’re seeing. As it does with spurious correlations, however, sometimes logic can come to the rescue, telling us whether it’s realistic to think that the relationship we’re studying goes in one direction rather than another. Here, we’re using theory (logic) to guide our inquiry, rather than just randomly identifying correlations. An easy example would be the relationship between gender and your income later in life—since the second concept comes after the first (your birth), it’s not possible for the causality in this case to run in any direction other than from gender to income.

Another way to address the problem of reverse causality is to collect data that allows us to decide between different explanatory stories. For example, if we conducted a longitudinal study that followed teenagers over multiple months or years, we could see whether a teenager who started playing violent video games saw their measures of aggression increase afterward. In a similar way, an experiment could tell us in a more convincing fashion whether exposure to violent video games changes people’s level of aggression, since we could see the “before” and “after” of that exposure among the study’s participants (and, crucially, compare what we find with the same measures for a control group). It’s important to note, however, that these alternative approaches have their own drawbacks, too: longitudinal studies are expensive and time-consuming, and experimenters will find it hard to simulate in a lab setting the actual exposure to video games that children receive in the real world. (We’ll discuss the challenges of assessing causality further in Chapter 12: Experiments).
So far, we’ve talked about the danger of reverse causality—believing that changes in one concept cause changes in another when the opposite is actually true. But what if the causal arrow points in both directions? Here, we would say the relationship is bidirectional (see Diagram 7). Bidirectional relationships are quite common in the social sciences: when you’re studying complex human beings, there are a lot of moving parts to consider, and social phenomena can frequently be both causes and effects. For example, does education cause people to be smarter, or do smart people just get more education? Probably (hopefully, for our jobs as professors), both causal stories are true. This issue, however, makes it exceedingly difficult to assess the “true” impact of going to school on people’s measured abilities. Specifically, unless researchers make adjustments, the analysis they conduct will overstate the impact of your education on your smarts, because part of what they are seeing is actually the effect of your innate intelligence on how much education you later receive.
To make matters more complex, we can also come across feedback loops, where a change in concept A leads to a change in concept B—which, in turn, loops back to change concept A (see Diagram 8). A classic example of a feedback loop would be what the sociologist Robert Merton (1948) called “self-fulfilling prophecies.” For instance, a person may take out their money from a bank, believing that the bank is on the verge of collapse. Every withdrawal, however, will prompt others to do the same, eventually leading to a collapse even if the bank was initially on firm financial ground. Referring to the diagram can help you visualize the steps in the process: an initial skepticism about the bank (concept A) leads to withdrawals (concept B), which loop back to create more skepticism (concept A), which in turn leads to more withdrawals (concept B). A more colloquial term often used to describe these self-reinforcing relationships is “vicious circles” (sometimes transmuted into “vicious cycles”), with the reverse, a “virtuous circle,” used to describe similar chains of positive results.
Social scientists have developed advanced techniques to isolate the causal effect of one concept on another concept, accounting for everything else. Nevertheless, judging whether and how a relationship is causal remains a tricky business, and sociologists need to be cautious about how they describe relationships—and humble about what they can legitimately conclude from their data. At this stage in your research career, just keep these pitfalls in mind as you judge the validity of your work or other people’s work. To clarify your thinking, we encourage you to use concept maps in order to make the relationships between the variables you’re interested in more tangible and intuitive. Consider each concept in terms of its operational definition as an independent, dependent, moderating, or mediating variable. Imagine how your concepts might relate to your other concepts of interest—and what missing concepts might fill in any gaps or better explain any relationships. Thinking like a researcher requires being able to think clearly and creatively about the many ways a set of concepts can be connected.
Deeper Dive: Idiographic and Nomothetic Explanations

Causal explanations can be idiographic or nomothetic. Idiographic explanations are those that explain a single situation or event in idiosyncratic detail. For example, suppose you did poorly on an exam. Why did this happen? Well, you forgot that you had an exam on that day. You also arrived late to class due to a traffic jam. Then, midway through the exam, you began panicking and couldn’t concentrate. But perhaps most importantly, the week earlier your dog ate your textbook, and because it was not an open-access textbook that you could access for free on the web, you were unable to study. All these factors played a role in bringing about your poor grade on the exam, and a thorough idiographic explanation would address all of them in order to truly understand why that tragic outcome occurred.
However, as detailed, accurate, and valid as idiographic explanations like this one can be, they do not necessarily apply to other situations, even ones involving the same person, and are therefore not generalizable. In contrast, nomothetic explanations seek to explain a class of situations or events rather than a specific situation or event. For example, we might want to figure out what factors best predict the sorts of students who will do poorly on exams—that is, whether their test grades are most strongly correlated with their family background, their work ethic, their mental health, or other characteristics. Because nomothetic explanations are designed to be generalizable across situations, events, or people, they tend to be less precise, less complete, and less detailed. However, they explain economically, using only a few explanatory variables.
As we’ve discussed, theories are intended to serve as generalized explanations for phenomena, and they are crucial to the work that sociologists do, given our broader interest in understanding how social life operates for all people at all times. As a result, most sociological research ultimately seeks to arrive at nomothetic explanations. Nevertheless, idiographic explanations can play an important role in research. Especially in qualitative research, we often want to understand the complex situations that individuals find themselves in—where many factors are at play—rather than reducing their experiences to simple models. Understanding a highly specific context can help sociologists generate creative and surprising theories that can later be considered more broadly.
What Are the Limits of Our Theory?
![On the left: screenshot of Daily Mail article about an American Army veteran who “rescue[d] bald eagle dangling upside down from a rope in 75-foot tree by ‘mowing down the branches’ with his rifle”; on the right: photo of a book about hygge alongside a candle, coffee mug, a sign that reads “Do whatever makes your soul shine”](https://pressbooks.rampages.us/sociology-research-methods/wp-content/uploads/sites/29/2023/06/combined-images.jpg)
A final important component of theories is a set of scope conditions, also known as boundary conditions. All theories are constrained by scope conditions, which tell us where the theory can and cannot be applied. For example, a theory may be bounded, or limited, by culture. Perhaps it is based on data from countries where people tend to be more individualistic in orientation, but it has not been tested in cultures where people have a stronger devotion to the well-being of the collective. Sabina Pultz and Ofer Sharone (2020) conducted a cross-national study of Danish and American unemployed professionals for this very reason. The existing literature emphasized how jobseekers engage in the emotional labor of networking in order to get hired. But that past work was largely conducted in highly individualistic societies like the United States. In a more egalitarian and collectivist country like Denmark, Pultz and Sharone found, jobseekers tended to be more skeptical about networking, seeing it as potentially exploitative, corrupt, and inauthentic.
Not recognizing the scope conditions of existing studies means that we might take a phenomenon to be widespread when it’s very much limited by what sorts of populations and places it has been previously studied in. For example, a theory may have been studied among children, but it is unclear whether it also applies to adults. Or, the observations underpinning a theory may have been done in localities that are completely different from other places and cultures where the same phenomenon occurs, making us question whether the theory is actually relevant there. Indeed, as we will discuss further in Chapter 6: Sampling, the psychological and sociological knowledge that we’ve gleaned from lab experiments has disproportionately come from so-called WEIRD societies—Western, educated, industrialized, rich, and democratic—which raises the perennial question of whether those findings apply more universally.
If we are to properly use or test a given theory, we must be explicit about all of its underlying assumptions and the appropriate boundaries of that theory—where it is valid, and where it is not. When you write up your research, be transparent and exhaustive in describing these scope conditions. When you read other people’s work, identify the true boundaries of their theory based on what data they actually have. Otherwise, the theories derived from this research might be applied to contexts they don’t fit—leading to erroneous conclusions.
Every study has scope conditions, and being straightforward about the limits of your study’s theoretical implications will not signal that your work is poor research—in fact, the opposite is true. We sociologists value honesty and humility about our findings. After all, we can’t study a phenomenon in every place on Earth, and yet not doing so means that there is always the question of whether things will be different in some other setting. (This is not just a problem in the social sciences—yes, the laws of physics hold in every place we’ve tested them on Earth and outer space, but what about in another solar system, galaxy, or universe?) That said, the fact that a phenomenon has been studied in one context but not anything doesn’t necessarily mean it’s not applicable elsewhere—the key question is if that context is different in specific ways that would change our findings, as we’ll discuss later in this textbook.
Key Takeaways
- Theories identify certain concepts of interest (in answer to the what question), they determine how those concepts relate to one another (the how question), they explain the reasons behind that relationship (the why question), and they describe the limits of what can be said about that relationship based on the available data (the who, when, and where questions).
- To test theories, researchers find ways of measuring those concepts (variables), develop hypotheses that relate those variables, and then analyze data that can support or reject those hypotheses.
- Understanding the relationship between two concepts is complicated by the fact that other concepts may mediate, moderate, or confound that relationship, and the causal arrow connecting these concepts may point in either or both directions.
- Sometimes, scientists distinguish between propositions—conjectures about the relationships between concepts—and hypotheses—conjectures about the relationships between variables (Bhattacherjee 2012). (Remember that variables are technically the measurable representations of abstract concepts.) ↵
- Technically, we would use the term “moderation” when we are clearly interested in how two concepts relate, and we are interested in a third concept only insofar as it moderates, or conditions, the relationship between those first two concepts. If we are not so focused on the relationship between two particular concepts, then we wouldn’t be so specific in our language. We’d say that there is an interaction between two concepts in predicting the values of a third concept, but we wouldn’t single out one of those concepts as a moderator. The distinction here is similar to the one that we make between correlation analysis and regression analysis, which we’ll cover in Chapter 14: Quantitative Data Analysis; for regression, we specify an independent variable and dependent variable, but for correlation, we are simply observing associations between variables, with no cause-effect relationship between those variables in mind. ↵
