
6. Sampling
6.5. Questions to Ask about Samples
Learning Objectives
- Identify several questions we should ask about samples when reading the results of research.
- Name some tenets worth keeping in mind with respect to responsibly reading research findings.
We read and hear about research results so often that we might overlook the need to ask important questions about where research participants come from and how they are identified for inclusion in a research project. It is easy to focus only on findings when we are busy and when the really interesting stuff is in a study’s conclusions, and not its procedures. But now that you have some familiarity with the variety of procedures used to select study participants, you are equipped to ask critical questions about the findings you read.
The first thing to ask is how the sampling was conducted. We have talked about the various probability and nonprobability sampling techniques and their strengths and weaknesses. With the study’s research question and overall approach in mind, you should have a sense of whether the researchers want to use their sample to make claims about the prevalence of certain characteristics or activities in the target population. If so, then a probability sample (or a quota sample devised to be representative) is called for. A study that doesn’t use a probability sampling technique is unlikely to give us results that we can generalize to the population of interest with much confidence. A probability sampling approach, however, probably doesn’t make much sense for a qualitative study that is focusing on developing complex theories and generating a more granular understanding of a phenomenon. With their inherently small samples, qualitative studies are better off pursuing a purposive sampling approach grounded in theories about what factors matter and allowing for in-depth investigation of causal mechanisms.
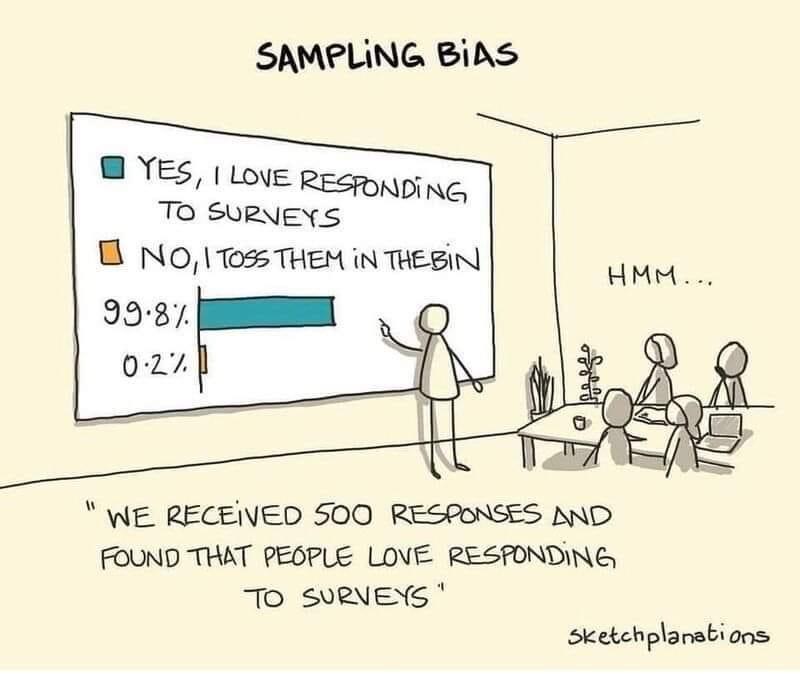
Sketch cartoon of a person pointing to the results of a survey in which 99.8 percent of respondents indicated that they love responding to surveys.
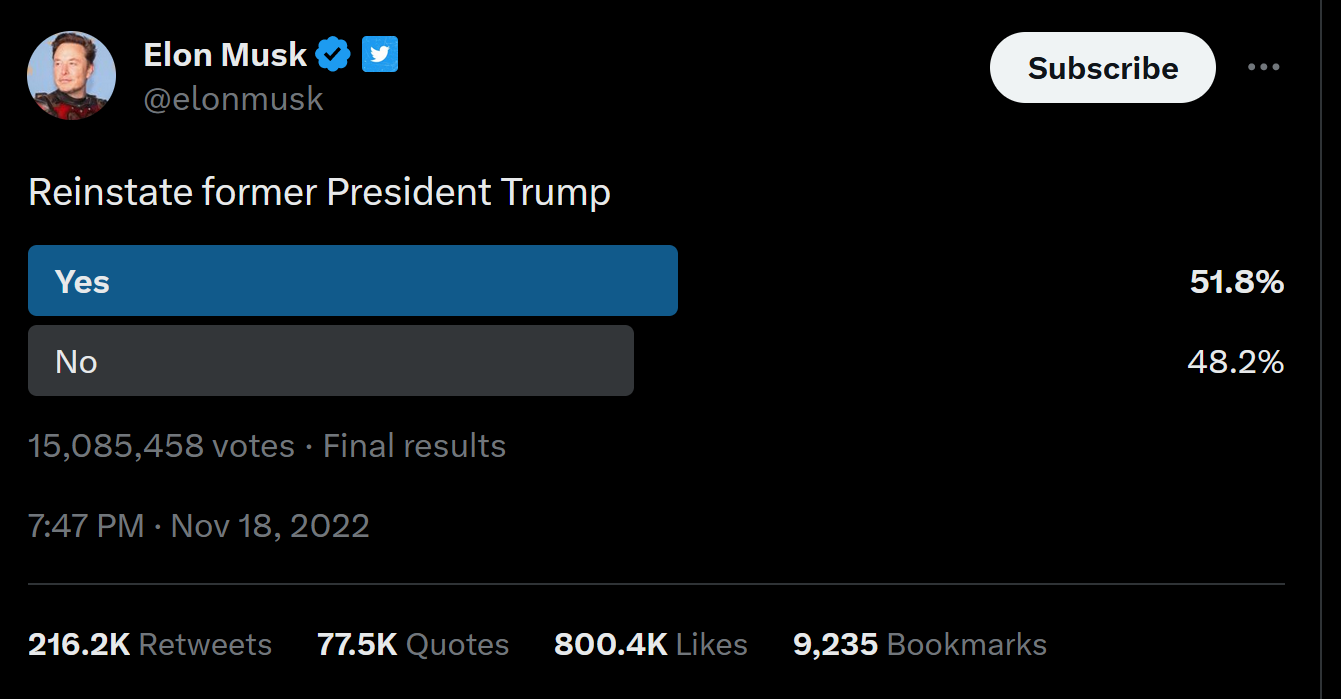
As a critical reader of research, you should also be aware of the many forms of sampling bias and how they are rampant in polls—scientific and unscientific—that are publicized widely. We already discussed the various ways that flawed samples can fail to faithfully capture what is going on in the target population. Every day, a news website will publish another survey of people’s opinions and self-reported behaviors. But how was the sample collected? Was it truly a random sample of the population of interest? Were some sorts of people more likely to respond than others? These questions should be asked of every sample.
Online polling is particularly fraught with these problems of bias (notwithstanding the quality online surveys we mentioned earlier that use quota sampling). As much as news and entertainment sites love hosting their own polls, virtually every one you take is fundamentally flawed from the perspective of scientific sampling. Let’s say a local site is asking for the public’s opinion about some community issue. Although the target population is the local community, the sampling frame would be much narrower—basically, every person who visited that site’s page with the poll. Particular groups of people in the local community would be underrepresented in the sample that is drawn from this sampling frame: those without access to the internet, those who do not read that news website, and those who dislike answering online polls.
Another issue with a single-issue online poll like this one is that people with strong opinions on the issue are more likely to participate. This is an example of what we call self-selection bias—that certain types of people are more likely to volunteer for (select into) the sample. Regardless of how many thousands of people end up taking this poll, then, it would be a dubious measure of the public’s actual views—much like Literary Digest’s poll of millions of U.S. voters turned out to be way off because of poor sampling.
Self-selection bias is similar to a form of sampling bias we mentioned earlier, nonresponse bias. This bias occurs when the people who chose not to answer our survey (nonresponders) look different from those who did respond (respondents) in terms of the variables that matter in our study. Even careful random sampling cannot avoid this problem. For example, in a mail survey on alcohol consumption, researcher Vivienne Lahaut and colleagues (2002) found that only about half the sample responded after the initial contact and two follow-up reminders. The danger was that the half who responded might have different patterns of alcohol consumption than the half who did not, which could lead to inaccurate conclusions on the part of the researchers. In other words, it was not only that the responders were potentially different from nonrespondents but also that they differed across one of the study’s key variables—alcohol consumption.
To test for nonresponse bias, the researchers later made unannounced visits to the homes of a subset of the nonresponders—coming back up to five times if they did not find them at home. They found that the original nonresponders included an especially high proportion of abstainers (nondrinkers), which meant that their estimates of alcohol consumption based only on the original responders were too high. (We’ll discuss methods for addressing nonresponse bias in Chapter 13: Surveys.)
Even when reputable polling organizations like the Pew Research Center conduct rigorous sampling, potential for bias continually creeps in. For example, a data quality analysis that Pew conducted on its online panel survey found that new participants were less Republican than those in prior waves, and individuals who lived in politically balanced areas were more likely to join than those in the country’s most and least pro-Trump areas (Kennedy et al. 2021). Furthermore, Trump voters were more likely to drop out of the panel. (The latter problem is called attrition bias: those who leave the study come from particular subgroups, thereby undermining the sample’s overall representativeness.) Once it identified these biases, Pew implemented strategies to modify recruitment and improve data quality. Not all pollsters do that.
With all the potential sources of sampling bias, how do we know when we can count on the results that are being reported to us? We can keep a couple of things in mind as we read the claims researchers make about their findings. First, remember that sample quality is determined only by the sample actually obtained, not by the sampling method. We may set out to administer a survey to a representative sample by correctly employing a random selection technique, but if only a handful of the people sampled actually respond to the survey (potential nonresponse bias), we will have to be very careful about the claims we make about our survey findings. As we mentioned earlier, researchers may also give into the temptation to talk about implications of their findings as though they apply to some group other than the population actually sampled. Though this tendency is usually quite innocent and does not come from a place of malice, knowledgeable consumers of research findings need to be attentive to this sort of bait and switch.
Conversely, you should be careful about critiquing studies—especially qualitative studies—by just pointing out their samples are not representative and stopping there. As we have repeated throughout this chapter, qualitative research in general does not generate representative samples. And even with quantitative studies, one could always point out that the same study could be done elsewhere—above all, in more non-WEIRD societies—to test whether the same findings hold up in that new context. Sample representativeness and study generalizability are critical concerns, but we want to judge a study based on what it is trying to do. Especially for qualitative studies, the more pertinent question is whether we expect the findings to change if the study was conducted in a different locality or among a different set of individuals. In some cases, we will have many reasons to suspect that the study’s results would not hold elsewhere—the site that was sampled is just too distinct. But oftentimes a good case can be made, even with qualitative projects with nonrepresentative samples, that the patterns and processes we observed in one context could plausibly be found in other contexts, too. For a theoretically sampled study, this claim might be enough—and we can always conduct more research to test out the theories we generated.
At their core, questions about sample quality should address who has been sampled, how they were sampled, and for what purpose they were sampled. Being able to answer these questions will help you better understand, and more responsibly read, research results.
Key Takeaway
Sometimes researchers may make claims about populations other than those from whom their samples were drawn; other times they may make claims about a population based on a sample that is not representative. As consumers of research, we should be attentive to both possibilities.
Exercise
Find a news story or blog entry that describes results from a social scientific study. How much detail is reported about the study’s sample? What sorts of claims are made about the study’s findings, and to whom do they apply?
