
6. Sampling
6.2. Populations versus Samples
Learning Objective
Understand the difference between populations and samples.
Deciding on your unit of analysis will help you specify what your population of interest, or target population, is—the larger group that your research question applies to. Populations in research may be rather large and encompassing, such as “people who live in the United States” or even “all human beings” (indeed, for many medical or psychological studies, the latter is the implied target population). The populations we study as sociologists are typically less vague, however. For example, even a large study that purports to study the views of “all Americans” will in practice specify which “Americans”—adults, citizens, legal residents, voters, or some combination thereof—they can or wish to study.
Now that you’ve identified your unit of analysis and your population of interest, you can start interviewing and observing folks, right? Not so fast. You want to think long and hard about your strategy for obtaining your sample, that subset of your population of interest from which you’ll actually gather data. This systematic and intentional approach to sampling is part of what distinguishes scientific research from other kinds of inquiry. Much of the rest of this chapter will be focused on best practices for obtaining scientific samples.

You might be protesting at this point—why do we need to bother with a sample? Why can’t we just talk to everyone in our population of interest? It is actually rare for researchers to gather data from an entire population. This might sound surprising or disappointing until you think about the kinds of research questions that sociologists typically ask. For example, let’s say we wish to answer the following research question: “How do the middle school experiences of students of various racial and ethnic backgrounds differ, and how are they similar?” Would you be able to collect data from all students across all middle schools in the country? In truth, you will rarely have the time or resources needed to gather data from every single person your study might be interested in. This means you have to make hard choices about sampling and then be honest with yourself (and with the readers of the paper you plan to write) about the limitations of your sample.
Both qualitative and quantitative researchers use sampling techniques to help them identify what or whom they will actually study. Because the goals of qualitative and quantitative research differ, however, so, too, do their sampling procedures. The two broad categories of sampling strategies are probability sampling (also called random sampling) and nonprobability sampling. Probability sampling is widely used in quantitative studies, and nonprobability sampling is more common for qualitative work.
Probability sampling helps us make precise claims about populations much larger than the actual samples that we gather. This approach is ideal if we want a high degree of confidence that the results of our study are generalizable—that they apply to the broader population from which our sample was drawn. Researchers (especially quantitative researchers) typically want their findings to be generalizable, but nonprobability sampling can also be justified under certain circumstances. The point of this nonprobability approach is often to sample in a way that allows researchers to closely examine the workings of a particular phenomenon and flesh out their theoretical understanding of it.
Quantitative and qualitative researchers also have different criteria for judging whether a sample is “sufficiently large”—in academic lingo, whether it has a high enough n, or number of cases.[1] We’ll go into those criteria next, but it’s worth recognizing that the most significant factor influencing the sample sizes of both qualitative and quantitative research is often the study’s budget. Larger samples provide us with greater confidence in our results, but they take more time, effort, and money to obtain. Conducting in-depth interviews or doing ethnographic observations is particularly labor-intensive, which is one of the reasons that qualitative studies usually have many fewer cases than quantitative studies.
Now let’s break down the features of a sample. Each case in our sample—say, each individual we interview—is called a sampling unit. When we analyze a sample quantitatively, we generate statistics—numbers like means, medians, and standard deviations that describe the sample (or some group within our sample). For example, if we collected a sample of the U.S. adult population, we might want to calculate statistics like the mean level of education of all the respondents within our sample, or the standard deviation of the annual incomes of any respondents who work for pay. Statistics are our estimates of what the actual numbers are for the population. Those population parameters—the means, medians, standard deviations, and so on for the whole population—are the numbers we really care about but that we usually cannot observe (that is the whole point of sampling). For instance, whenever we generate a statistic about support for a particular presidential candidate based on a political poll’s sample of surveyed voters, we are hoping that statistic tells us not only the percentage of the candidate’s supporters in that sample but also the percentage in the overall population of voters. With proper sampling, our statistic should be a good estimate of its corresponding population parameter. When our sample’s statistics generally match up well with the population parameters, we say our sample does a good job “representing” the larger population of interest. It is a representative sample, and any conclusions we draw from that sample should be generalizable to the population.
Throughout this chapter, we will be talking about populations and samples of people. Remember, however, that your object of interest as a researcher—your unit of analysis—does not necessarily have to be people. Some sociologists study songs, news stories, textbooks, government policies and laws, movies, and other symbolic or physical materials. (We’ll talk about specific strategies for studying some of these units of analysis in Chapter 15: Materials-Based Methods.) For example, in a study of media representations of immigration in Williamsburg, Virginia, sociologists Deenesh Sohoni and Jennifer Bickham Mendez (2014) used texts that referenced immigration as their sample. Specifically, they collected and analyzed news stories, letters to the editors, op-ed pieces, columns, and public commentary published in a local newspaper, the Virginia Gazette, in 2006 and 2007. These published articles made up their sample of cases to analyze. Note that their choice of a local newspaper to study is itself a sample—a sample (albeit of one case) meant to stand in for the media more broadly. (We’ll say more about sampling decisions at different levels later in this chapter when we discuss purposive sampling, which often relies on such an approach.)
This brings us to another bit of general advice about sampling: don’t be afraid to be unconventional and creative in choosing units of analysis and target populations to study or in identifying particular samples to gather. You don’t have to stick with the obvious approach of interviewing or surveying a group of people who have opinions on your topic. Many of the sampling methods described in this chapter can be used to select cases for human-based and materials-based research alike.
Representativeness: Matching Populations and Samples

As we’ve discussed, social scientists draw samples from the populations they’re interested in studying. Sometimes, however, you may find that the population you are drawing your sample from isn’t the population you’re really interested in. For instance, many psychological studies are truly interested in how human beings think and act—not just how Americans think and act, or how college students think and act. Yet if you’ve taken any psychology classes, you’ve probably noticed that the lab experiments that are the foundation of empirical work in this field largely recruit college students as their subjects—hungry undergrads who sign up to take lab tests in exchange for, say, $10 or a free donut. One analysis found that more than two-thirds of participants in papers published by top academic journals in psychology were located in the United States, and two-thirds of studies using U.S. samples that appeared in one well-respected journal, the Journal of Personality and Social Psychology, obtained their data from undergraduates taking psychology courses (Arnett 2008).
What are we actually learning from such studies? Joseph Henrich and his colleagues (2010) point out that behavioral scientists often make sweeping claims about human nature based on samples drawn only from WEIRD societies (Western, educated, industrialized, rich, and democratic). In fact, many widely accepted findings about human behavior—in regards to fairness, cooperation, visual perception, and trust, among other things—are based on studies that excluded participants from outside the United States and sometimes excluded anyone outside the college classroom (Begley 2010). This raises questions about what we really know about human behavior, as opposed to U.S. resident behavior or U.S. undergraduate behavior.
Even if a lab experiment was conducted on U.S. psychology undergrads, isn’t it still likely to tell us something meaningful about how human beings as a whole think and act? Yes, behaviors relating to cooperation and trust might vary greatly across cultural contexts, but college students from rich democracies aren’t all that different physiologically and cognitively from the rest of humanity, are they? The problem is that we will not know for sure until we do more research with non-WEIRD samples. This doesn’t mean we should dismiss those earlier studies, but we do need to be aware of their limitations. (This issue is similar to the one we previously discussed concerning units of observation and analysis, when the population we observe is not the same as the population we truly care about.) Although the theoretical conclusions of these studies can be generalized to the population that their samples were drawn from (say, U.S. psychology undergrads), it is not so clear that they also apply to the real population of interest (say, human beings).
Another issue that will come up frequently in this chapter is that of representativeness. As we discussed earlier, a representative sample captures important characteristics of the population from which it was drawn, in ways that are critical for the accuracy of the research being conducted. For example, if you wish to report about differences between men and women at the end of your study, your sample should obviously have sufficient numbers of both of these genders. In other words, your sample should contain the key sorts of variation that are present in your larger target population.
These sorts of concerns about a sample’s representativeness plague all social scientific research methods, not just lab experiments. Your choice of a particular sample will always depend on how feasible it is for you to collect it. The decision may also rest on how strong a justification you can make for your sample’s generalizability. For example, suppose you want to survey people about their preferences for cilantro—that notoriously divisive herb. Although some international surveys include respondents from many nations, most social scientists have the resources to study, at best, only the people in their country. And even if you could do a national study of cilantro, do you really have to? Do we expect the cilantro preferences of Virginians to be different from those of Arizonans? Probably not. If you expect no differences, then you might be justified in gathering a sample from a smaller, state-level population, with the assumption that the preferences of Virginians are similar to those of Arizonans. This assumption would not be reasonable, however, if you were studying attitudes about the federal government, because the political views of Virginians differ from those of Arizonans in notable ways. In that case, you would probably want to sample the entire U.S. population, or sample certain groups within that population that you think would be theoretically relevant.
As we described in Chapter 3: The Role of Theory in Research, every theory we generate has a set of scope conditions (explicit or implicit) that tell us where it applies, and where it does not necessarily apply. The extent to which our population of observation matches our population of interest provides us with a clear set of boundaries that constrain the generalizability of our findings. These limitations should be expected for any study.
Indeed, we can and should ask tough questions about the WEIRD-ness of the samples often used in the social sciences, but we must stress that all research is hard to do, and all studies have weaknesses. Any decisions we make, including decisions about sampling, inevitably have trade-offs. After all, sociologists who use other methods look with envy at lab researchers who have easy access to a whole bunch of (presumably) willing and able human guinea pigs to recruit for their samples. That access has allowed fields like psychology (including the sociological subfield of social psychology) to flourish, even if it has arguably come at the cost of sample representativeness. The more practical lesson to be drawn is that we should pay close attention to how well the population we are observing fits the population we are really interested in. We should be upfront about any mismatch and talk about our results with these sorts of limitations in mind. And we should ask hard questions about other studies that generalize their findings beyond the population they were actually able to sample.
Sampling Frames and Sampling Bias

Another task that researchers need to complete before sampling can begin is finding—or creating—a sampling frame. A sampling frame is the list of every single member, or element, of your population of interest. Sometimes, the sampling frame is more or less obvious. If your population of interest is all the students at a school, then presumably the school’s administration has that list somewhere in their records. But what if the administration is not willing to share that list with you (a common occurrence)? Well, then you might decide to use your school’s public directory as your sampling frame. As we will describe later, this sort of approach has flaws, too, but at least we have some way of generating relevant names.
What about sampling a huge and sprawling population—like all U.S. residents? A publicly accessible list of all Americans (residents or citizens) is not available to draw upon. Researchers, however, can get lists of all U.S. addresses. This is the sampling frame that many government surveys and other large-scale studies use to obtain nationally representative samples. Mailings can be sent to a sample of those addresses, with surveyors making follow-up visits (like those of census enumerators) as needed.
Regardless of the approach, sampling frames rarely match the population of interest perfectly, as depicted in Figure 6.2. For instance, if you used your school’s public directory as a sampling frame to identify its student population, clearly you would be missing certain people who chose not to be included in the directory or were left out for some other reason. Even if you had the resources to do mailings to a sample of all U.S. addresses, this approach would still exclude many Americans—most obviously, the homeless. In these two cases, we are dealing with sampling bias (sometimes called selection bias or sample selection bias).[2] Bias is a systematic error that may make our research findings inaccurate in some way (we’ll talk more about systematic versus random error in the next chapter). When this bias arises as a result of the sample selection approach we are using, we call it sampling bias.
Bias in sampling occurs when the elements selected for inclusion in a study do not do a good job of representing the larger population from which they were drawn. In the examples we mentioned, certain important segments of the population are “missing” in our sample—that is, they are underrepresented compared with their proportion in the actual population. This means that our sample is not representative, and the statistics we generate will be off the mark (“biased” or “skewed”) in comparison to the population parameters.
Later, we’ll say more about the different ways that bias can creep into samples, but it’s worth reiterating that researchers are not always so lucky to have access to the complete lists that organizations, corporations, or government agencies maintain of their employees, members, and citizens. And sometimes no list exists, period. Say that you wish to conduct a study of hairstyle preferences across the United States. Just imagine trying to create a list of every single person with hair in the country. When faced with scenarios like this one, social scientists might construct their own sampling frames. In the world of political polling, for instance, random-digit dialing has been a popular—if problematic—way of addressing the fact that no obvious list exists of American voters to contact. The assumption is that every modern American adult has a phone, so by calling numbers randomly, you should be able to reach every American adult. As assumptions go, this is not too much of a stretch, and political polls have operated reasonably well in spite of the obvious sampling bias that exists in this scenario—among other things, the fact that Americans who do not own phones are excluded from the sample.
Casting such a wide net with your sampling frame means you have to be especially diligent in weeding out all the cases in your generated list that do not fit your population of interest. For instance, if you are trying to survey American voters, then you don’t want to talk to anyone who picks up the phone who isn’t an American citizen and thus cannot vote. These cases would fall into the “Ineligible” category shown in Figure 6.2. Including these respondents in your survey results would create sampling bias, because your sample wouldn’t faithfully reflect the underlying population.
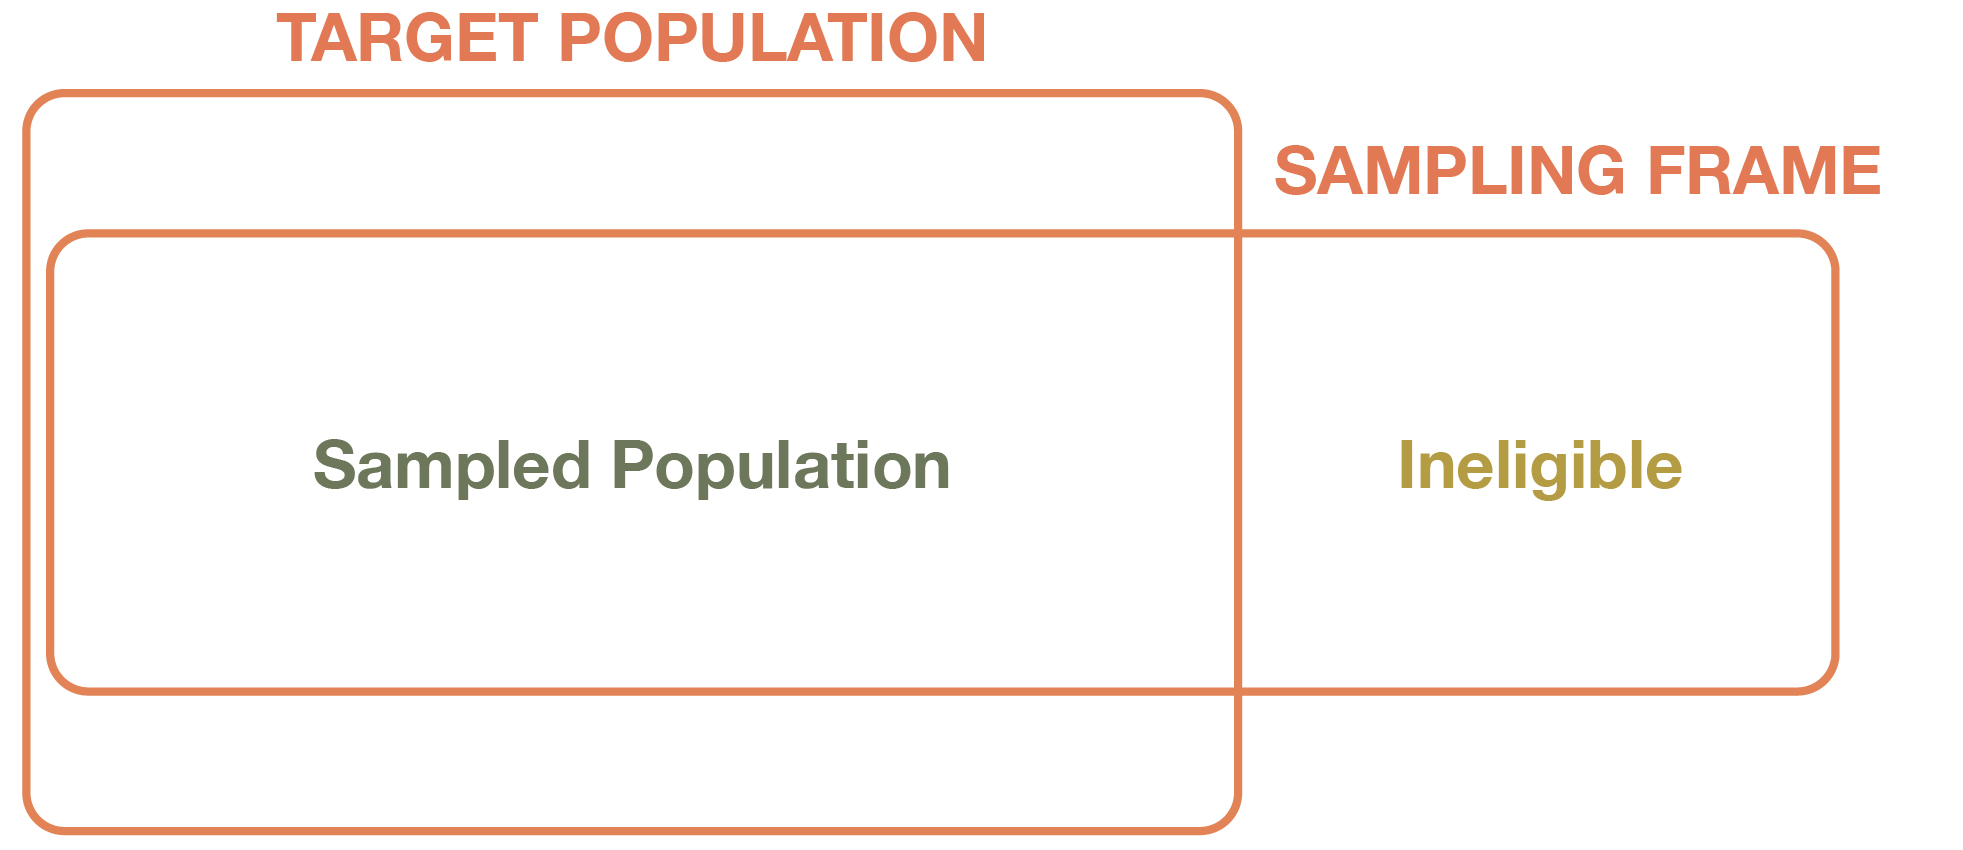
Take another look at Figure 6.2. Notably, the boxes for both the sampled population and the sampling frame overlap but do not match the box for the target population (note that the diagram is not drawn with any set proportions in mind). Obviously, our sample is usually much smaller than the population of interest, but it may be biased as well—that is, it may not reflect the characteristics of the true population of interest because of some systematic problem. The sampling frame we use may create some of that bias—for example, if it underrepresents certain subgroups of the population, or if it includes ineligible cases that we failed to weed out.
You may have noticed that in Figure 6.2 we labeled the middle box “Sampled Population” rather than “Sample.” We want to point out a key distinction, which is linked to another key type of sampling bias. For a survey, the sampled population is all the people we sought to recruit from our population of interest. But it is almost never the case that everyone selected for the sample actually responds to the survey. Some people may have died or moved away, and others may decline to participate because they are too busy, are not interested in the survey topic, or do not participate in surveys on principle.
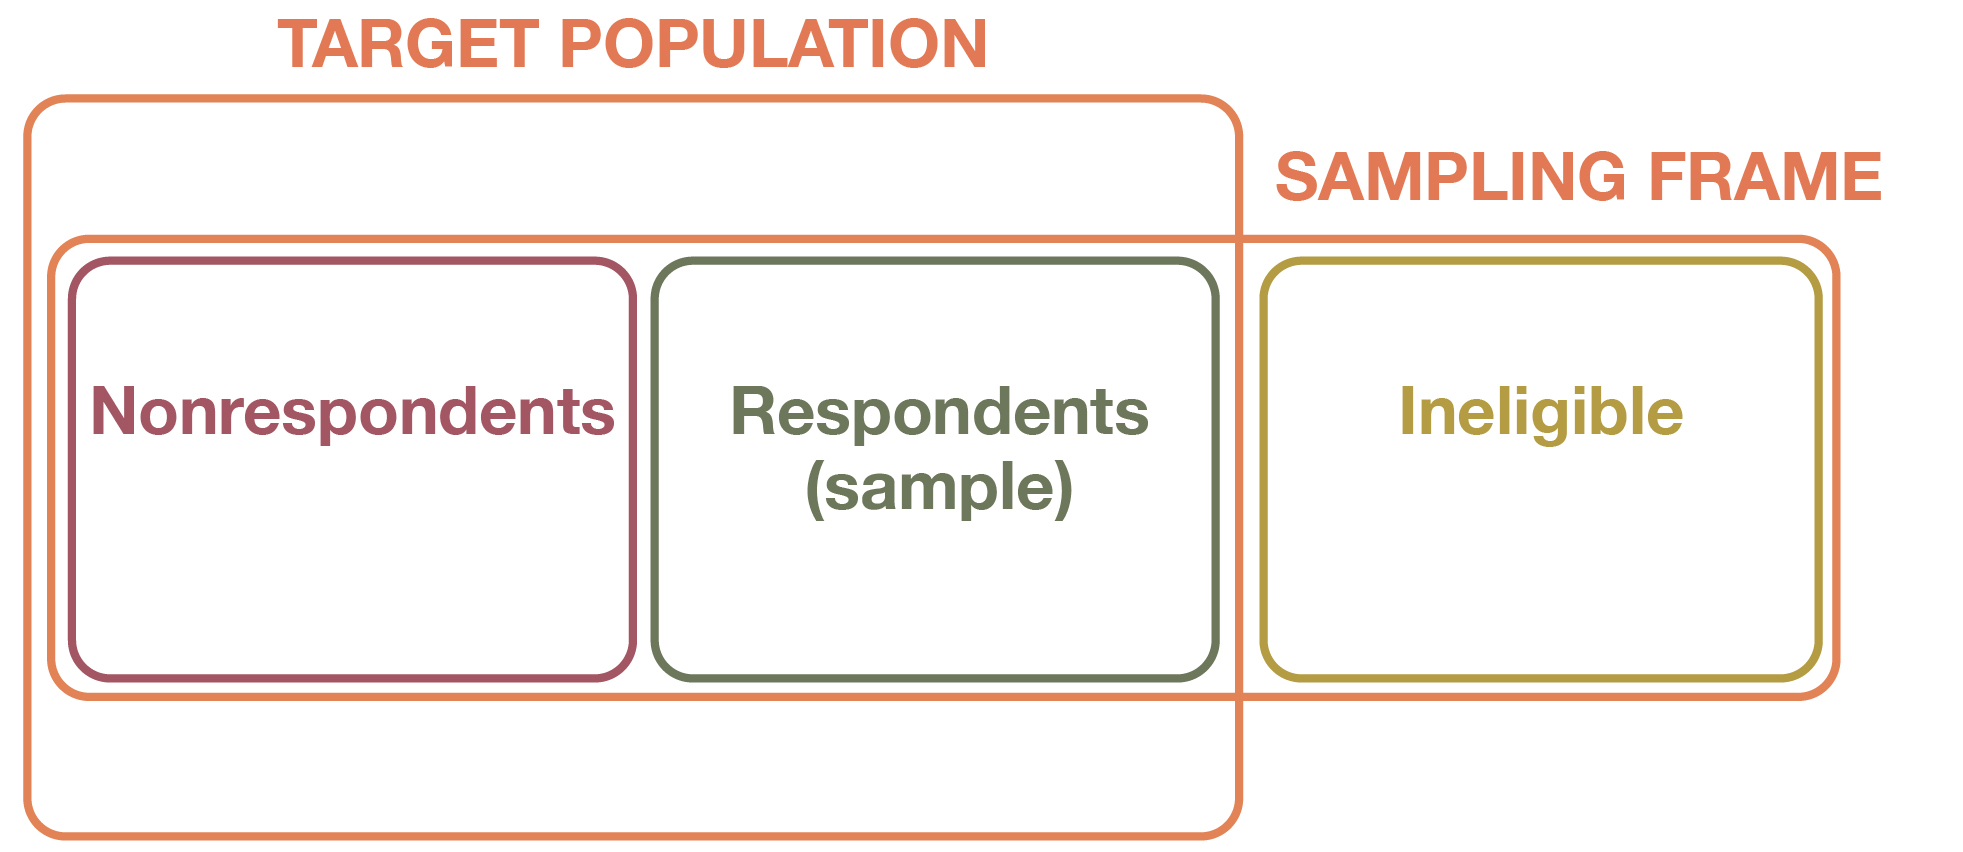
Take a look at Figure 6.3. Our sampled population is now divided into two groups. Those who actually take our survey are called respondents. These are the people whose responses are used to calculate our statistics, and this is our actual sample, whose size we report as n in our papers. Those who did not take the survey for whatever reason are called nonrespondents. Their numbers are frequently not reported in papers but can be inferred from our response rate—the percentage of all the people we asked who did take our survey (which is n divided by the number of people in the sampled population).
A low response rate is not a problem in itself, but it is generally a worrisome signal. As we will describe in Chapter 13: Surveys, modern-day political polls are able to provide competent estimates of voter opinion even with astoundingly (and increasingly) low response rates. The more important consideration is whether survey nonrespondents differ from survey responders in systematic ways. If there is a difference, then we may be dealing with nonresponse bias. For example, if Republicans are less likely to answer questions for a political poll (a real concern today in U.S. polling), then our sample will be skewed toward Democrats, and our sample will not be representative of actual U.S. voters. Response rates do figure into this equation because the lower the response rate, the more reason we have to believe that respondents and nonrespondents look different on key characteristics.
We’ll say more later in the chapter about the methodological issues that nonresponse bias can cause. For now, just be aware of the many ways that our samples can fall short of capturing the real population of interest.
Figure 6.3. Respondents versus Nonrespondents. If we are conducting a survey, we will usually fail to recruit some of the potential respondents in our sampling frame: we won’t be able to reach them, or they will refuse to participate. These individuals are referred to as nonrespondents. If they look different from our respondents in ways that are important to our study, then our sample will suffer from nonresponse bias.
Video 6.1. How a Flawed Sample Sank a Major Presidential Poll. Biased sampling led to a significant error in the Literary Digest’s predictions of the 1936 U.S. presidential election. Although the sample size was huge, the sampling frame did not reflect the population. This led to fundamentally flawed predictions and an embarrassing situation for Literary Digest. For that same election, the polling company Gallup was able to correctly predict the winner of the election using a substantially smaller sample. This case shows how correct sampling procedures can be more important than sample size.
Deeper Dive: Sampling Gone Wrong
When fielding a typical survey, it is extremely important to choose a sample that truly captures the population of interest so that any conclusions drawn from the sample can be generalized to the population of interest. Improper and biased sampling is a key reason that political polls sometimes get the outcomes of elections very wrong.
Video 6.1 illustrates how a biased sampling strategy gave way to a massive prediction error in the 1936 presidential election between incumbent president Franklin D. Roosevelt and Kansas governor Alf Landon. Literary Digest, one of the country’s most popular magazines at the time, had correctly predicted the presidential elections of 1920, 1924, 1928, and 1932 by sending postcards to a sample of Americans and asking whom they were planning to vote for. In 1936, they were confident the same strategy would work. Not only had Literary Digest been right for four straight presidential elections, but no one could beat their sample sizes. In 1936, they sent out 10 million postcards, getting back more than 2 million responses. (In political polls today, pollsters feel good about getting a thousand respondents.) Bigger is always better, right?
As it turned out, no. Even though the sample size was huge, the Literary Digest poll utilized a flawed sampling frame, which drew from lists that the magazine was able to obtain of people who owned automobiles and telephones. In 1936—the depths of the Great Recession—automobiles or telephones were amenities that only more affluent households could afford. As a result, the sample left out many poorer Americans—who that year broke in large numbers for the Democratic candidate, Roosevelt (Brockell 2020). Another major problem—arguably the more decisive factor (Lusinchi 2012; Squire 1988)—was nonresponse bias. The people who were likely to bother responding to a postcard survey and mailing it back were voters with strong opinions. At the time, Roosevelt was a polarizing figure who drew fierce criticism for his New Deal policies, which conservatives likened to socialism. It was no surprise, then, that the respondents who sent in their postcards disproportionately favored Roosevelt’s opponent.
Because the poll’s respondents did not adequately reflect the country’s electorate, Literary Digest blew its presidential prediction that year. The magazine declared that Landon would win 31 states. He ended up winning only two. Roosevelt snatched up an unprecedented 62 percent of the national vote, even though Literary Digest concluded he would win only 43 percent, a stunning prediction error of 19 percentage points. Meanwhile, an upstart polling outfit founded just a year earlier by journalist George Gallup conducted its own survey of voters, gathering a sample of 50,000 respondents—still an unnecessarily large number by modern standards. Gallup used a new technique called quota sampling (described later in the chapter) to generate a sample that more closely mirrored the actual U.S. electorate. Although Gallup’s sample was a tiny fraction of Literary Digest’s, he correctly predicted that Roosevelt would win. Adding to the humiliation, Gallup took Literary Digest’s sampling frame and drew his own sample of just 3,000 respondents, which, in a test of his new statistical methods, he used to precisely predict the magazine’s polling results before they were released (Brockell 2020).
Literary Digest folded just two years after its election debacle. Its massively incorrect prediction based on an astounding sample size of two million respondents has taught many generations of social scientists since then an important lesson: the size of a sample is not as important as its representativeness. You are better off with a small but well-chosen sample than a large but biased one.
Key Takeaways
- A population is the group that is the main focus of a researcher’s interest; a sample is the group from which the researcher actually collects data.
- Populations and samples might be one and the same, but more often they are not because we generally do not have the time or resources to survey or examine every member of a population of interest.
- Sampling involves selecting the observations that you will analyze, and it always opens up the possibility that your sample may not be representative of the target population because of various kinds of sampling bias or just bad luck.
Exercises
- Read the methods sections of a couple of scholarly articles describing empirical research. How do the authors talk about their populations and samples, if at all? According to their methods sections, which specific target populations are the researchers drawing conclusions about?
- Think of a research project you have envisioned conducting as you read this text. Would your population and sample be one and the same, or would they differ somehow? Explain.
- Typically, a lowercase n refers to the number of units in a sample, and an uppercase N refers to the number of units in the population; however, some authorities, such as the American Medical Association, use other conventions, such as treating N as the size of the sample and n as the size of subgroups within that sample. ↵
- Although selection bias and sampling bias are often used interchangeably, some scientists distinguish the two terms, with sampling bias being a subset of selection bias. ↵
