
7. Measuring the Social World
7.3. Indexes and Scales: Measures with Multiple Items
Learning Objectives
- Learn the two ways in which indexes and scales differ from one another.
- Be able to provide a concrete example of an index and a scale.
Many variables can be captured by a single question on a survey. Age and income are good examples: “What is your age?” is as straightforward as you can get, and so long as we operationalize income precisely (i.e., being clear about whether we’re asking about individual or household income, before taxes or after taxes), one well-worded item should suffice.
Unfortunately, most variables in the social world are not so simple. For example, it is hard to think of one item that would adequately measure a complex concept like sexism. To gauge whether a respondent has sexist views, for example, researchers might ask whether the person agrees with a statement like “It is more important to encourage boys than to encourage girls to participate in athletics,” with agreement indicating that the person holds sexist views (as defined in this way). But we might be skeptical that asking this one question truly reflects the wide variety of types of sexism.
For this reason, researchers routinely use multiple indicators to develop a single measure of a complex concept. Take the concept of “well-being,” for example. The Gallup organization, a well-respected polling outfit, conducts an ongoing survey of the American adult population about their well-being. The survey asks participants numerous questions covering five broad areas: career, social, financial, community, and physical well-being. Gallup uses their answers to questions about these five areas of life as indicators of the different dimensions of the complex concept they want to study.
As another example, suppose we wanted to measure how accepting the general public is of members of a particular racial or ethnic group. Because people might accept the presence of members of that group in some situations, but not others, ideally we would need to use more than one item to develop an overall measure. For example, we could ask several questions representing different levels of acceptance, such as the following:
- Would you be willing to have a member of this group visit your country?
- Would you be willing to have a member of this group as your colleague at work?
- Would you be willing to marry a member of this group?
Note that this question format is a condensed version of a Bogardus Social Distance Scale, named after the sociologist who invented this technique for measuring acceptance of social groups (Bogardus 1933). The three questions can be combined into a single variable that measures how much each respondent tolerates members of the specified group.
When multiple indicators are combined into a single composite measure, the resulting variable is called an index or a scale. Researchers often use the terms “index” and “scale” interchangeably, and they are similar in that they both use two or more indicators to generate one variable that measures a single concept at an ordinal or higher level of measurement. Technically speaking, however, scales and indices (also written correctly in the plural as “indexes”) differ from one another in two ways:
- The items that comprise an index are conceptually different from one another, whereas the component items in a scale are conceptually similar.
- The component items in a scale have some kind of intensity structure: as you move across the items, you see a greater intensity of experience, behavior, belief, and so on, being measured (such as how the Social Distance Scale moves toward more intimate relations with the members of a particular group—from tolerance of having them as tourists to tolerance of marrying them).
Let’s see how indices and scales work by considering several examples. Researchers at the Social Progress Imperative, a think tank based in Washington, DC, sought to compare the progress of countries around the world in three areas: basic human needs, foundations of well-being, and opportunity. They developed an index with a wide range of indicators covering each of these broad concepts and their various dimensions. Figure 7.6 diagrams the overall scheme.
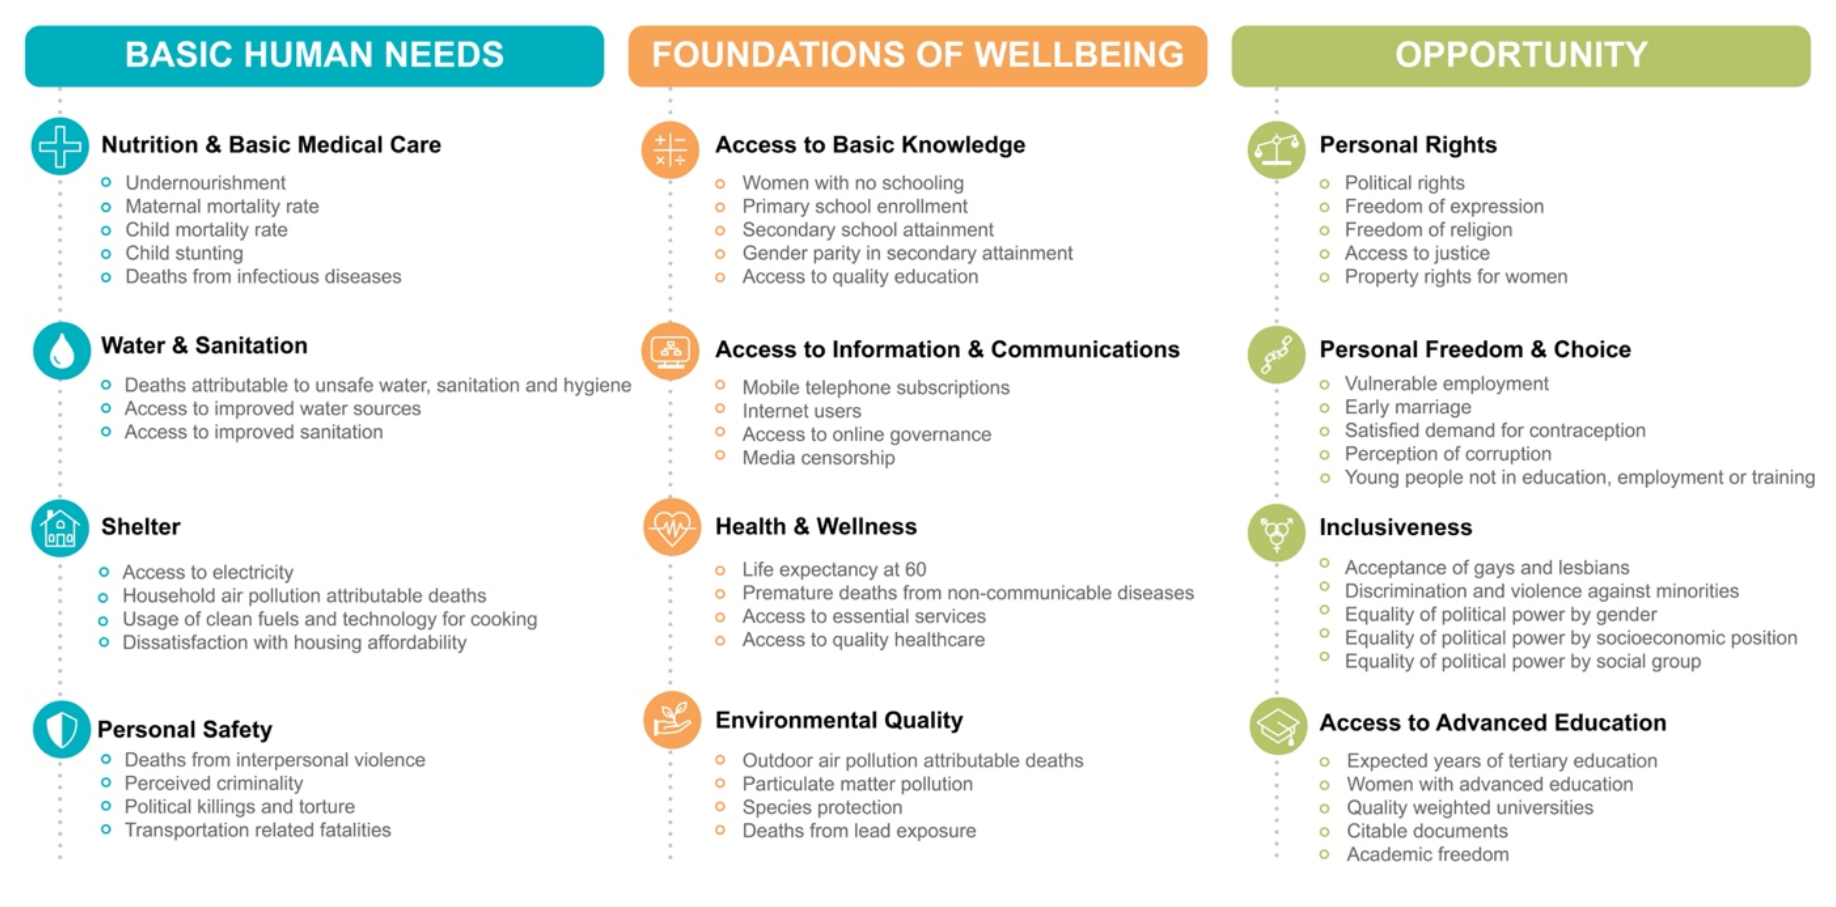
Rather than fielding their own surveys, the think tank’s researchers based their index’s measures on existing data collected by national and international organizations. For example, for the Nutrition and Basic Medical Care dimension, they used data on maternal mortality rates for each country from the World Health Organization. Because survey data measuring “acceptance of gays and lesbians” was not available for many Middle Eastern countries, they substituted a measure based on legal treatment of LGBTQ+ persons in those countries. We can debate the merits of these methodological choices, but it’s worth recognizing how much practical considerations can matter in the construction of any index or scale.
As is the norm for indices, the indicators used in the Social Progress Index are quite different from one another conceptually, even though they are designed to represent an overall concept of “social progress.” They are also measured in dramatically different ways. For example, “access to quality health care” in the Health and Wellness section is measured by country experts’ views of the percentage of citizens who are unable to “exercise their political rights as adult citizens” because they receive health care of a poor quality. In contrast, “expected years of tertiary schooling” (“tertiary” refers to learning in colleges and universities) in the Access to Advanced Education section refers to the “number of years a person of tertiary school entrance age can expect to spend within tertiary education,” based on government data.
The think tank’s researchers used mathematical techniques to combine these very diverse indicators. They then generated numerical scores for each country’s overall “social progress” as well as its progress within each dimension and subdimension. (You can find more details in the Social Progress Imperative’s methodology report and on its data page.)
So, how exactly is a scale different from an index? Let’s compare the Social Progress Index to the Bogardus Social Distance Scale we mentioned earlier. In the Bogardus scale, the indicators are conceptually similar to one another. All focus on situations involving the level of acceptance of a member of a particular social group. The first situation (“visit your country”) represents the lowest level of acceptance of the three items, and the third (“marry”) represents the highest level of acceptance. When compared with one another, then, the indicators form a logical intensity structure. If we scored people’s responses as “No” = 0 and “Yes” = 1, we would likely see the following patterns:
Table 7.4. Acceptance of Social Groups Scale (based on the Bogardus Social Distance Scale)
|
Acceptance of Social Groups (0 = No, 1 = Yes) |
||||
|
Visit your country |
0 |
1 |
1 |
1 |
|
Colleague at work |
0 |
0 |
1 |
1 |
|
Marry |
0 |
0 |
0 |
1 |
|
Total score |
0 |
1 |
2 |
3 |
Table 7.4 shows the patterns of responses that the “acceptance of social groups” scale will most likely generate. (It is based on the Bogardus Social Distance Scale, although the original scale created by sociologist Emory S. Bogardus had more questions and a different scoring system.) A respondent who has a total score of 0 obviously rejects this group in all three situations. A person with a score of 3 accepts this group in all three situations. But consider a respondent who has a total score of 1. That person is likely to be willing to have the group visit their country, but not be willing to accept the more intimate situations. It is possible that someone with a score of 1 could have answered “Yes” to the most intense level of acceptance—being willing to marry someone of this group—and then “No” to one or both of the other scenarios, but that would not make much sense because agreement with the last item implies agreement with all the preceding items. For the same reason, a respondent with a score of 2 is likely to accept the two less intimate scenarios but not the third one; any other set of responses that add up to 2 would not fit the logic of the questions. Because the component indicators have this logical intensity structure, they form a scale that measures acceptance of varying levels of intensity of contact with a particular social group.
Indices and scales can easily be constructed from multiple indicators that have the same response categories—such as questions that use the Likert response categories described earlier, which tell us how intensely a person agrees or disagrees with a particular statement. For example, consider several questions from the General Social Survey (GSS) probing the public’s views of various governmental institutions. The questions ask about respondents’ level of confidence in the “people running these institutions.” The response categories for all these questions are as follows:
- Hardly any
- Some
- A great deal
“Hardly any” represents the lowest confidence level, “some” represents an intermediate confidence level, and “a great deal” represents the highest confidence level.
Let’s create an index from three GSS questions that measure confidence in the U.S. federal government’s executive, legislative, and judicial branches, respectively. Because these three questions compare different dimensions of confidence in the federal government, and responses to one question don’t strongly imply a particular response to another question, we will consider this composite measure to be an index rather than a scale.
Because the response categories are exactly the same across the three questions, we can simply sum each respondent’s scores across the three questions to create our index. (As we will describe further in Chapter 14: Quantitative Data Analysis, things become trickier if your composite items have different response categories, especially if some questions have more categories than others.) Table 7.5 shows the distribution of summed scores for these questions in the 2021 General Social Survey. Respondents with a sum of 3 have answered all three items with a response of “hardly any” (coded as 1). Therefore, we conclude that they have the lowest confidence in the federal government. Respondents with a sum of 9 have answered all three items with a response of “a great deal.” Therefore, we conclude they have the highest possible confidence in the federal government. Respondents with sums from 2 to 8 fall in between these two groups because they have more or less inconsistent responses across the three component items. Overall, our data reveals a rather low level of public confidence in the U.S. federal government, given that more respondents scored near the bottom than near the top.
Table 7.5. Confidence in the U.S. Federal Government: Summed Scores for Respondents’ Perceptions of the Three Branches of Government (General Social Survey, 2021)
|
Confidence in Government Institutions |
|||
|
|
Percent |
N |
|
|
Summed scores scale |
3.00 (Lowest) |
13.60% |
360 |
|
4.00 |
20.10% |
530 |
|
|
5.00 |
21.40% |
565 |
|
|
6.00 |
25.80% |
682 |
|
|
7.00 |
12.70% |
336 |
|
|
8.00 |
3.90% |
102 |
|
|
9.00 (Highest) |
2.50% |
65 |
|
Note that this index could also be created by averaging each respondent’s score across the three items rather than summing those scores. The index we generated would still obtain a measure of each respondent’s general level of confidence in these three governmental institutions, but instead of summed scores, the results would be presented as mean (averaged) scores. Table 7.6 presents the distribution of those mean scores, ranging from lowest to highest.
Table 7.6. Confidence in the U.S. Federal Government: Mean Scores for Respondents’ Perceptions of the Three Branches of Government (General Social Survey, 2021)
|
Confidence in Government Institutions |
|
|||
|
|
Percent |
N |
|
|
|
Mean scores scale |
1.00 (Lowest) |
13.6% |
360 |
|
|
1.33 |
20.1% |
530 |
|
|
|
1.67 |
21.4% |
565 |
|
|
|
2.00 |
25.8% |
682 |
|
|
|
2.33 |
12.7% |
336 |
|
|
|
2.67 |
3.9% |
102 |
|
|
|
3.00 (Highest) |
2.5% |
65 |
|
|
The percentages and numbers of cases in Table 7.6 are identical to those in Table 7.5. However, the labels in the table are now means rather than summed scores. If a respondent has a mean score of 1, it means this person has the lowest possible score on all three questions. The only way to get a mean of 1.00 is to have said “hardly any” (coded as 1) for all three questions. On the other end of the scale, the only way to get a mean of 3.00 is to have said “a great deal” for all three questions. The other scores represent mixed responses when averaging the three questions. For example, respondents with a mean score of 2.33 achieved this by answering 3 to one question and 2 to two questions.
Because there is no difference in the percentages and numbers of cases for the two methods—summed scores or mean scores—the researcher could choose either approach. In practice, sociologists may prefer one or the other method of constructing indexes and scales, and you will see examples of both in the literature. The methods section of any academic paper that introduces an index or scale should explain which indicators were included, how they were measured, and how they were aggregated (merged) to create an overall score.
Even if your study involves complex variables, you won’t necessarily need to develop your own multiple-item measures. For some variables, you would likely be duplicating work that has already been done by other researchers. That’s another reason why it is important to consult the research literature in the early stages of designing your study. For example, if you are operationalizing the concepts of racism or sexism, consider using the Modern Racism or Modern Sexism indices developed by Janet Swim and collaborators (1995). If you are interested in measuring anti-immigrant views, check out Marco Marozzi’s index (2016) of perceived threat from immigrants. For attitudes toward transgender individuals, try the 20-item index created by Susan Walch and collaborators (2012). Also remember that scale formats like the Likert scale and Bogardus social distance scale can be applied to a wide range of phenomena—as can the semantic differential scale, Guttman scale, and Thurstone scale.
Using a multiple-indicator measure that’s already been developed not only saves you a lot of time and effort, but previously published articles using the measure also will often include information about its quality (specifically, its reliability and validity, the subjects of the next section). You may also find it worthwhile to modify an existing index or scale to match your study’s conceptual definitions. Although this can be a good idea in certain situations, note that changing even small parts of a measure can alter its effectiveness. Pilot testing is always recommended whenever you adapt an index or scale for your purposes.
Key Takeaways
- Sociologists use both indexes and scales to measure complex, multiple-item concepts.
- Indexes and scales differ from one another in two ways: for a scale, the component items should be conceptually similar to one another (unlike for an index, where they should be conceptually distinct), and they should have some kind of intensity structure.
