
11. Qualitative Data Analysis
11.1. Coding Qualitative Data

Learning Objectives
- Identify different strategies for coding the text of interview transcripts and field notes.
- Describe the approaches of open and focused coding in qualitative data analysis.
Whether the analysis process occurs in the field or after leaving it, you start by reviewing your transcripts and field notes. As you read, you try to identify codes in the text. A code is a label (a word or phrase) that tells us what a portion of text is saying or implying—what theme it conveys. Put another way, a code provides a shorthand representation of some more complex set of issues or ideas. Each code is linked to specific portions of the text (called a coding unit), which can range from a single phrase to multiple paragraphs. Imagine that you highlighted some text, and then labeled that highlighted text; that label—that word or phrase—is the code, and the highlighted text is the coding unit. Many different coding units can share the same code, allowing you to see how a specific theme plays out across your data.
The process of identifying codes in qualitative data is called coding. What’s the point of coding? Ultimately, you will arrive at an outline of the specific arguments you can make based on the data you analyzed. To get to that point, you’ll need to follow a process not unlike what we described in Chapter 5: Research Design for literature reviews: categorizing “like” bits of information into buckets (the “buckets” here being your codes). As you add more of your data to these buckets, you will start to see similarities and differences across the material stored in each one. This might prompt you to further divide an existing code into several codes that together describe the assorted dimensions of a phenomenon, or the multiple varieties of an idea. (The Greek root for the word “analysis” means “breaking up,” which fits the spirit of this approach of decomposition and dissection.)

While there are many types of coding procedures (Corbin and Strauss 2007; Esterberg 2001), one typical approach is to begin by doing open coding. This is a process aimed at identifying concepts or key ideas that are hidden within textual data and potentially related to the phenomenon of interest. When you do open coding, you read through each field note or transcript, line by line, and make a note of whatever categories or themes jump out to you. You may want to identify types of events or incidents, label ideas or actions, or flag perceptions or interactions.
Over the course of the coding process, you will read and reread (and reread some more) your transcripts and field notes. Familiarizing yourself with the data in this way will give you a clear idea about what themes are actually present in the evidence you’ve amassed. It will eventually generate a number of insightful codes that become the basis for one or more theoretical arguments. But as you might already be thinking, getting to that point—wading through all your data—will also be quite a chore. Just as quantitative researchers rely on the assistance of specialized programs to sort and analyze their data, so too do qualitative researchers—in their case, qualitative data analysis (QDA) software packages such as ATLAS.ti, Dedoose, MaxQDA, NVivo, and QDA Miner. These are programs specifically designed to help qualitative researchers organize, manage, and code large amounts of qualitative data. They allow you to import transcripts and other text files into a workspace. You can then easily label material, cut and paste passages, search for various words or phrases, and see wherever and how often a code was applied. More advanced users can take advantage of other features, such as the ability to code multimedia files, visualize relationships within a network of codes, create word clouds, and annotate your data in various ways.
For small qualitative projects, you don’t have to use QDA software. In fact, as we’ll demonstrate, you can produce an effective and fairly sophisticated coding scheme just by using a word processor like Microsoft Word. (This is known as manual coding.)
The sections that follow will go over some fundamentals of coding. We’ll give you some general guidance about applying codes with the help of QDA software as well as doing it the old-fashioned way. For the sake of brevity, however, our approach will be simplified, and we will not delve into more complex strategies recommended by expert qualitative researchers. For more information, we suggest that you pick up the many detailed reference books on qualitative data analysis, including Matthew Miles and Michael Huberman’s (2019) seminal textbook.
Descriptive Coding
In our bare-bones approach to coding, we distinguish between two general types of codes: descriptive and explanatory. Generating descriptive codes (also called index codes) is relatively easy. You see if any relevant themes come up as you read through the data—say, topics like “class,” “gender,” or “race,” or types of behavior or thinking like “violence,” “patriotism,” or “racism,” or any other issues or categories related to your research question. Each theme becomes the label for a code, and you should make a note of any bits of data that fit under that code—whether it’s just a sentence or entire paragraphs of text. (You can even code a single word if you’d like, though it’s better to code at least a full sentence so that you have more context about your data later in the process, as we’ll talk about later.)
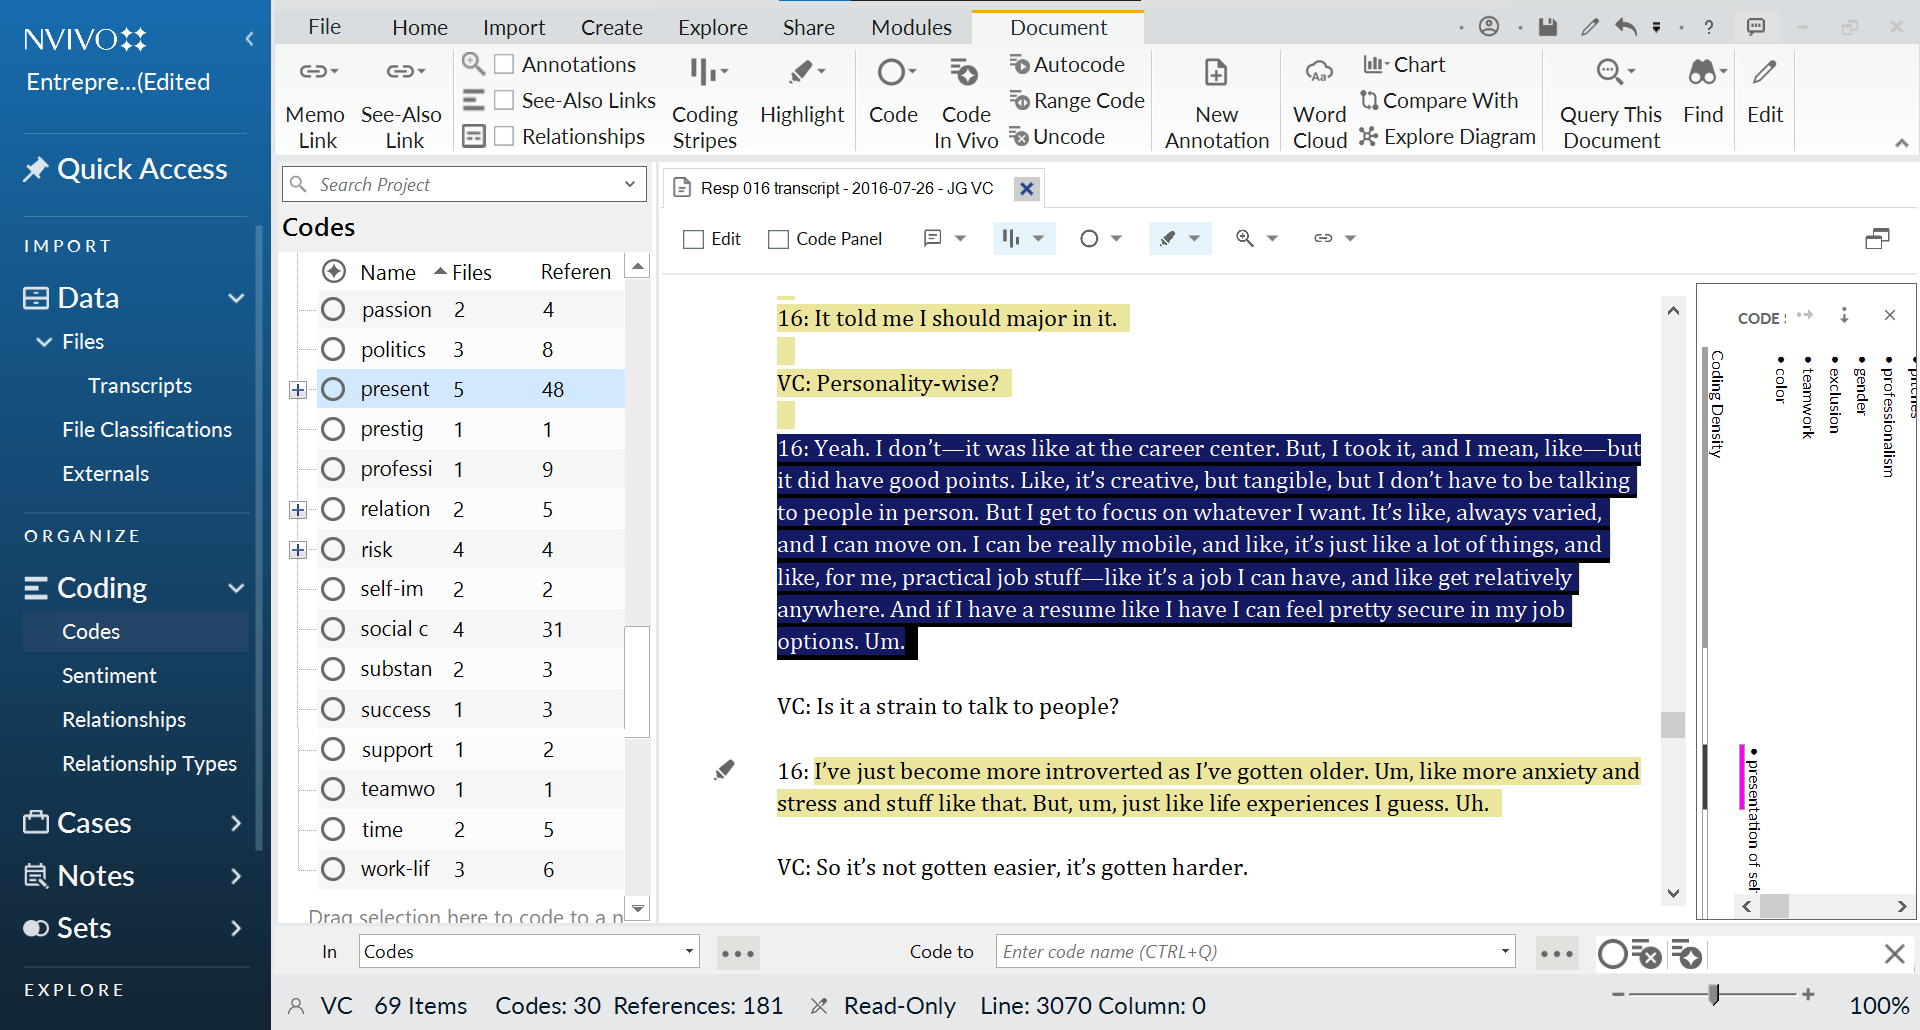
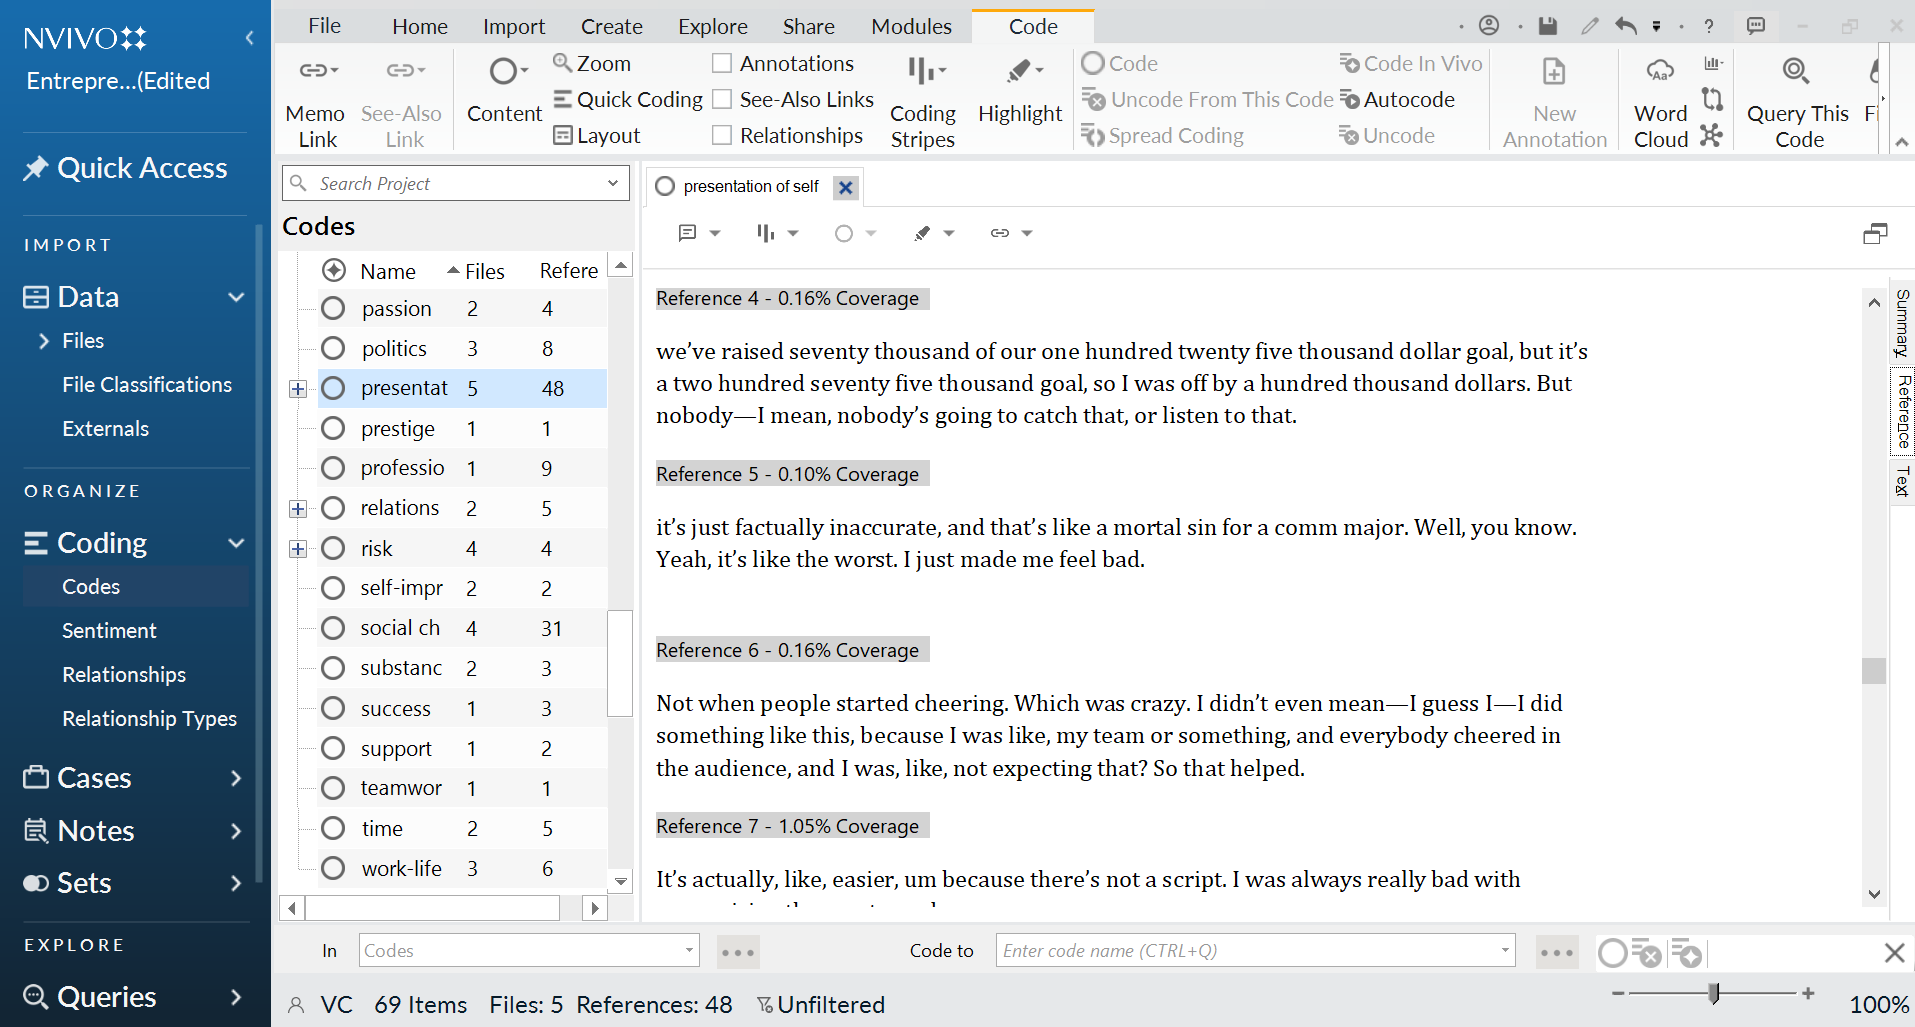
So how do you go about coding specific passages? If you are using QDA software, the process is simple: select the text and then click on the “Code” button (or whatever the equivalent is for your program). You can see what this looks like in Figure 11.2, which features the QDA package NVivo. Once you select the text and attach a code to it (or more than one code, if you wish), the program will label the text accordingly. You can code other bits of text with the same code. Then, when you’re finished with your coding, you will be able to generate a document that contains—in one place—all the text associated with your code (see Figure 11.3 for an example). This makes it easier to see any patterns in the data and copy and paste relevant quotes or other data into your actual paper.
You can follow a similar coding process using a word processor like Microsoft Word. For instance, you might create separate documents for each of the major codes you plan to use, and then copy and paste the associated coding units into each document. (Of course, you’ll probably want to read through a few of your transcripts first and generate a list of pertinent codes before you start copying and pasting anything.)
How do you decide upon what specific codes to use? Start with broad topics that have something to do with your research question. If you are studying how social class affects people’s experiences in high school, for instance, you might label any passages referring to those experiences with the—very broad—code class. (We’ll talk about how to sharpen the focus of your codes shortly, but for now, it’s fine to be somewhat broad.) You can also draw upon any relevant theories you are aware of—say, using the code presentation of self when you spot instances of people fretting over their public personas, or the code emotional labor when respondents talk about managing their feelings at work. Another way to generate codes is to let them emerge from the terms or phrases that your research participants themselves use (called in vivo codes). These codes may reflect particular notions or beliefs that are common among the groups you are studying (what are called folk theories).
The words or phrases you use for your codes are completely up to you. You are free to create your own naming conventions, and as we’ll see, it is actually a good thing when you depart from the literature and brainstorm your own codes—your own terms and theories. That said, researchers often use codes taken directly from the literature they’re immersed in to ensure that they are capturing all the aspects of the phenomenon of interest already known from past studies. Such standardization can make the process of coding seem less arbitrary to outsiders. Regardless of which approach you take, it is important to identify what criteria you are using for each code. (You may even want to write this down in a codebook, a list of instructions you use for coding text, which is especially useful if you are working with other people.) Being clear about the criteria for each code will not only add rigor to your coding, but it will make it easier to see if similar concepts can be grouped together (a topic to be discussed later).
As you can tell from the examples of codes we’ve provided so far, some may be simple and unambiguous, while others may be complex and viewed differently by different participants. For instance, whether a passage is about “work” may be pretty straightforward, but whether it reflects the concept of “emotional labor” may be more of a judgment call that different coders may disagree about. The sizes of coding units also vary widely. Simple codes, such as “organizational size,” may refer to just a few words of text (a quote to the effect of, “Our company has 500 employees”), while complex codes, such as “organizational mission,” may be assigned to a long text block of several paragraphs (perhaps encompassing the entire answer to a question you asked of a nonprofit director about their group’s mission).
As you proceed with your coding, it is important that you not let your original research question or tentative hypotheses cloud your ability to see categories or themes. You should actively seek out new concepts relevant to the phenomenon of interest. It’s called open coding for a reason—keep an open mind. You may have even noted some preliminary ideas for codes in your field notes or journal entries. Take full advantage of these hunches. Once a basic set of codes are identified, they can then be used to code the remainder of the data, while simultaneously looking for new concepts and refining old concepts.
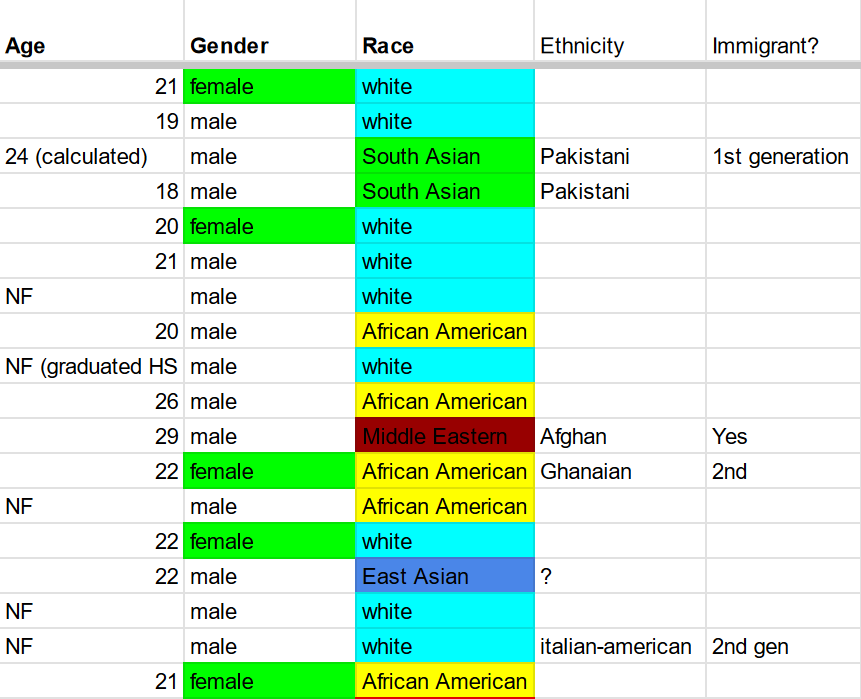
A specialized type of descriptive coding is called attribute coding. In this approach, you flag important characteristics of the case that was observed. When analyzing data from an interview-based study, for example, you would likely want to capture demographic information about your respondents, such as their gender, age, or race. If you’re using a QDA program, you can add codes to indicate where in each interview transcript that information is conveyed. If you are coding manually, you can simply record the details in a separate spreadsheet that lists all your interviewees and their demographic characteristics, as shown in Figure 11.4. (Even if you use a QDA program, you still might want to create such a spreadsheet to ensure that these key details are easily at your fingertips.)
What’s the point of attribute coding? For one thing, the demographic data you are organizing through this process will be crucial when you describe your interview sample in the methods section of your paper. Readers will want to know how old your respondents were, how many were white and nonwhite, and so on. Also, you can use these attribute codes to help you discern patterns in your data. For instance, do you see a tendency for people of a certain sexual orientation, gender, race, or class to answer one of your questions in a certain way? If so, that could be an interesting finding to explore, and your coding process will have led you to that insight. (At the same time, remember that you never have a truly representative sample in a qualitative study, so any patterns among your respondents should be considered only suggestive, and not presumed to hold up more broadly.)
We should reiterate at this point that qualitative analysis often happens when the researcher is still collecting data—sometimes, right after every interview or observation session that is conducted. For this reason, don’t think of the process of coding as something that has to happen after you leave the field. In fact, as we’ve suggested, there are major benefits to quickly reviewing your data as soon as you can, such as being able to adjust your approach for future observations and interviews based on what you already know. For any such preliminary analysis, you may not have access to full transcripts, and you won’t yet have an exhaustive list of codes at hand to draw from. Maybe you’ll just be able to jot down a few analytical notes that you wind up including in your field note. That’s fine. Try your best to integrate the techniques we have described whenever and wherever they are feasible.
So far, we’ve talked about descriptive coding—describing bits of data as reflecting this or that category, idea, or theme. As we discussed in earlier chapters, however, sociologists usually want to go beyond just describing reality. They want to explain it. Specifically, they want to make theoretical arguments that explain why they see what they see in the social world, or why the phenomenon they’re interested in unfold in the ways they observe. This goal of explanation means we’ll ultimately want to kick our coding up a notch and devise more ambitious and insightful codes. That said, when you begin the process of open coding, you should expect to be doing descriptive coding for the most part—categorizing the data rather broadly, with a focus on index and attribute codes. By coding in this way, you will become intimately familiar with the data. Eventually, inspiration will strike. You will think up ideas for actual arguments, and your coding will start moving in that direction. It may take several readings of your data to get to this point, however.
Explanatory Coding

To be honest, there isn’t a clear line between descriptive codes and explanatory codes (which are sometimes called analytic codes). You can think of this distinction as more of a continuum, with description on one end and explanation on the other. You gradually want your codes to move in the direction of explanation, which means not just categorizing data, but making arguments based on it. For instance, you should think about how or why two or more variables that you’ve uncovered in your coding are linked. You should also be on the lookout for new themes and ideas that may differ from, or complicate, your original research question or theory. As we’ve discussed before, this is a key advantage of qualitative research: its ability to surprise the researcher. With these goals in mind, here are some questions you can ask about each bit of text you review:[1]
- What is this a case of? What topic or aspect of the phenomenon you’re studying is it an example of?
- Does it raise any questions about the phenomenon you’re studying? Does it answer any questions (providing an explanation, etc.)?
- Does it contradict or complicate the existing theories? (Remember our discussion in Chapter 4: Research Questions of the abductive approach to analysis—looking for any “surprises” in the data, given existing theories.)
- Does it speak to a new theory? (As we will discuss later, don’t be afraid of brainstorming neologisms—your own way of succinctly describing a phenomenon—or refining existing terms.)

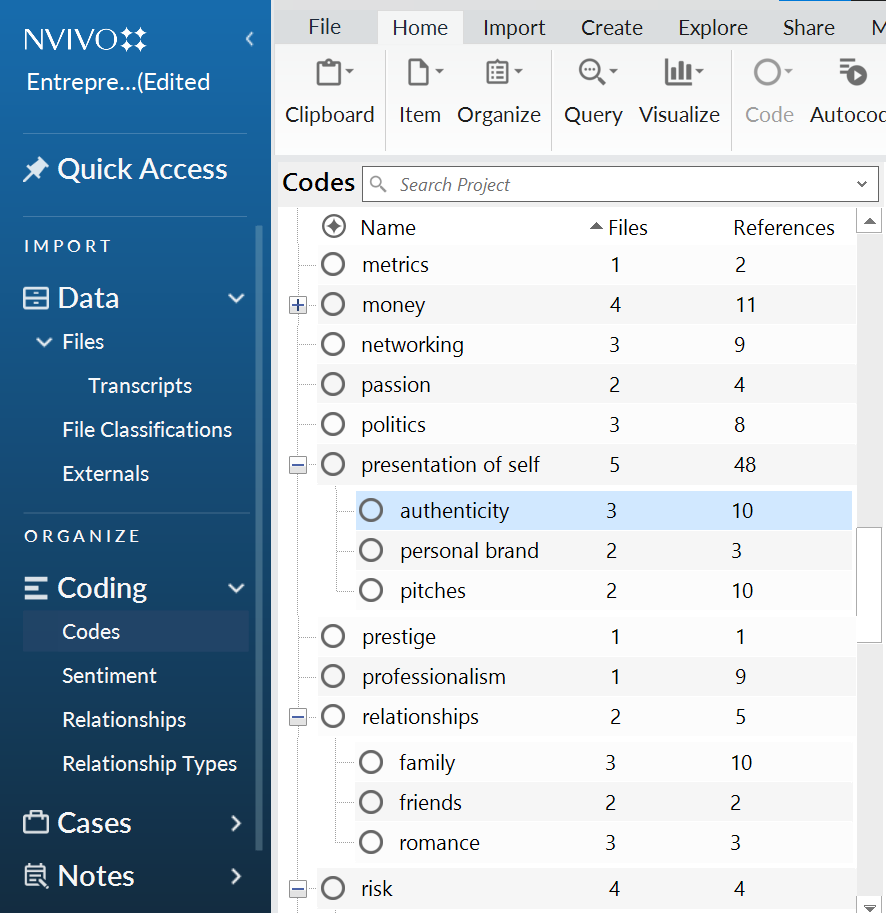
Through the process of opening coding, you will eventually wind up with many separate documents full of relevant data, each focused on a specific code. (In the QDA workspace, these would be the documents the program compiles of all the text associated with each code.) You can use these documents as the basis for coding memos (also called analytic memos). Coding memos present your preliminary ideas and hunches about the data you’re reviewing. For instance, let’s say you are coding manually and create a number of Word documents titled with the words or phrases of your most important codes, such as presentation of self (Figure 11.5 illustrates how these files might be organized on your computer). These documents are the broadest categorization of your data.
Now let’s dive a bit deeper. In the presentation of self document, suppose you have copied and pasted all the data from your interviews and field notes relating to this broad theory. You start going through the material in the document, noticing connections between your respondents’ quotes here and there. As you read, you feel the need to organize the material so that “like” bits of information are together, so you create sections within the document that get at more specific dimensions or understandings of the “presentation of self” across your data. As you continue to categorize your data in this way, your thinking about the topics in your codes becomes more tightly focused. As a result, you start to create subsections within the sections of the document, breaking down each concept into narrower ones—or even, if you’re lucky, into specific arguments about what patterns exist in the data or what factors might explain those patterns.
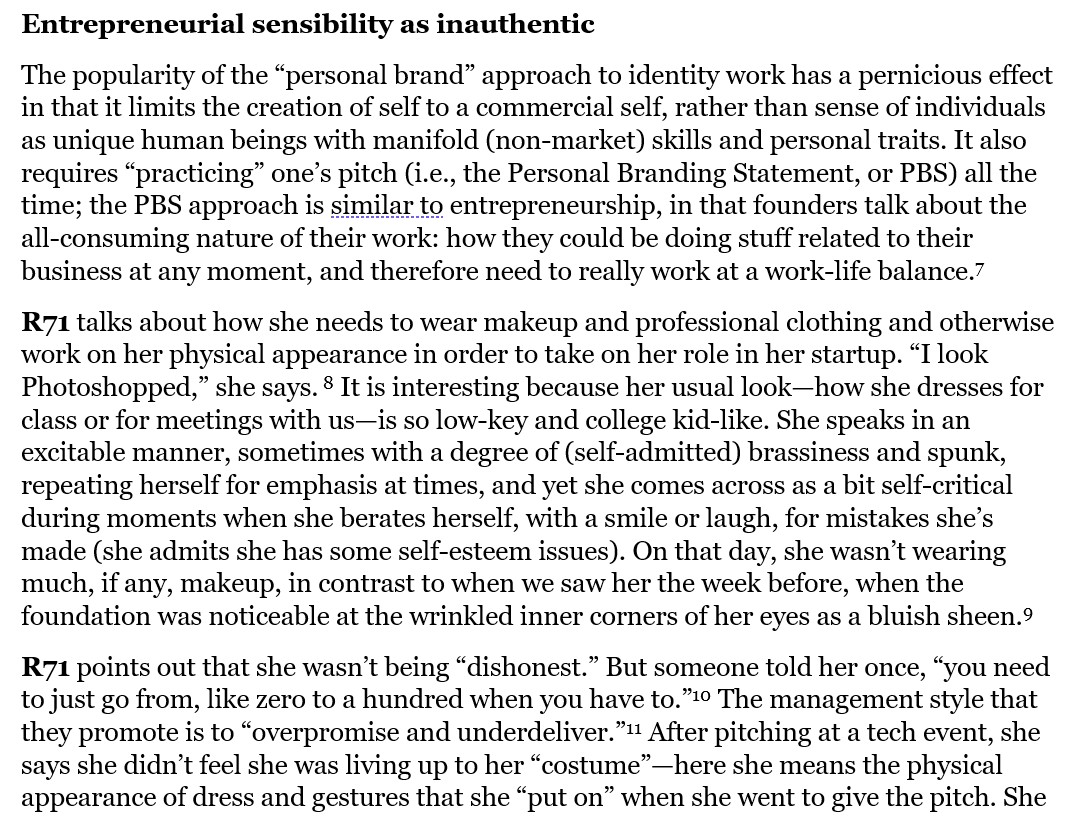
Through the sort of process we’ve just been describing, the sections (and subsections and subsubsections) in your coding memo will start to take the form of explanatory codes. For instance, let’s say you create a section within your presentation of self memo devoted to the topic of authenticity, which gets at the tensions that people feel about being “fake” in their public personas (see Figure 11.6 for an illustration). Then you start looking at all the data you’ve categorized in this authenticity section, and realize that there are several dimensions of authenticity to consider: authenticity as consistency (not being erratic, but showing a single persona); authenticity as sincerity (showing your “true” self); authenticity as passion (showing genuine excitement about the work you’re doing); and authenticity as intimacy (revealing a raw and unfiltered self). These become subsections in your authenticity section, and at this point, you might be wondering which of these dimensions of authenticity are more relevant to the phenomenon you’re studying, or which dimensions show up in particular social contexts. Now you’re generating tentative theories.
As you further refine your codes, you may tweak your definitions of them (e.g., how exactly should you define “authenticity”?) and what types of data would fall into each one. Pay special attention to any outliers or deviant cases—instances when a particular case (person, organization, observation, etc.) doesn’t fall into the existing theory that you or other scholars have devised to explain a relevant phenomenon. The sociologist Howard Becker (1998:87) aptly summed up this general approach: “identify the case that is likely to upset thinking and look for it.” In qualitative research, these instructive outliers are incredibly helpful because they show you where existing theories fall short—and, therefore, where they can be supplanted by new theories. Remember as well the point made in Chapter 4: Research Questions that there are no “negative” cases, only positive cases waiting to be explained.
By refining your codes, you are moving away from description and toward explanation. So far, we have talked about slicing up broad descriptive codes by describing different dimensions of each code—in line with this idea of “analysis” as “breaking up” data through categorization and labeling. Note, however, that you can also merge codes: creating higher-order codes that link multiple codes and thereby create larger “buckets” of information. (In grounded theory, the lower-order codes are called concepts, while the higher-order codes are called categories.) For instance, you might connect ideas about “authenticity” in your presentation of self code to a separate idea about personal branding, this notion of marketing one’s professional or personal identity to specific audiences. Rather than further breaking down your data, here you are drawing higher-level connections between different ideas (perhaps even visualizing these connections in a concept map, as described later). By thinking up these higher-order codes, you helpfully reduce the number of ideas you are working with and paint a “big picture” of what are the key factors necessary to understand a particular phenomenon.
Just like with breaking down codes, creating overarching categories can be done in phases—for instance, by combining codes into a set of higher-level codes, and then merging them into still higher-level codes. We should also note that QDA software makes the process of both merging and splitting codes very easy. In most programs, for instance, you can nest one code within another by simply clicking and dragging within the list of your codes.
What is the payoff for reorganizing and manipulating codes in all these ways? You will end up with a number of higher-level codes with lower-level codes nested within them. Some of these categories will speak to larger arguments about how or why the variables in your analysis might be connected—that is, what causal relationships exist, and what causal mechanisms operate within those relationships. And as you keep nesting sub-arguments within your overall argument, you will start to flesh out your empirical analysis, generating key takeaways and supporting points for the paper that eventually emerges. (Figure 11.7 shows how a paper can build upon the preliminary analysis in coding memos.)
Beyond this general advice, there are three analytical strategies you can take to generate theoretical arguments: neologisms, typologies, and concept mapping. We’ll discuss those approaches later, but first let’s wrap up the discussion of coding by talking about the second stage: focused coding.
Deeper Dive: Axial and Selective Coding
In addition to open coding, grounded theory experts Juliet Corbin and Anselm Strauss (2007) recommend two other coding techniques: axial coding and selective coding. You can apply all three procedures at the same time. When you conduct axial coding, you assemble categories and subcategories into causal relationships or hypotheses that can tentatively explain your phenomenon of interest. (Remember that in grounded theory, lower-order codes are called concepts, and higher-order codes are called categories.) The relationships between these categories may be clearly evident in your data, or they may be more subtle and implicit. To clarify them, you can differentiate between categories that represent conditions (the circumstances that generate or sustain the phenomenon), actions/interactions (the responses of individuals to events under these conditions), and consequences (the outcomes of actions/interactions). As you identify conditions, actions/interactions, and consequences across your data, you will start to generate overarching theories to explain why a phenomenon occurs, under what conditions, and with what consequences.
Another coding technique is selective coding, which involves identifying a central category or a core variable and systematically relating it to all your other categories. The central category can evolve from existing categories or can be a higher-order category that subsumes previously coded categories. New data is selectively sampled to validate the central category and its relationships to other categories (i.e., the tentative theory). By utilizing selective coding, you helpfully limit your analysis, prioritizing what’s truly important. At the same time, you need to keep an eye out for other categories that may emerge from the new data, which can signal that your initial theory needs to be further refined.
Moving from Open Coding to Focused Coding
Open coding will probably require multiple rounds of reading through your transcripts or field notes. The process, as we’ve described, is about inductively identifying patterns in your data, and refining and redefining your codes as you go. At some point, however, you will want to begin focused coding, a process of firming up and prioritizing the codes you developed during open coding and applying this finalized framework to the entirety of your data. This shift typically occurs when you reach saturation—that is, when additional data no longer leads you to revise the ways you perceive core categories or relationships.
Focused coding is a multistage process. First, you should read through the coding memos and other notes you made during the open coding process. Use them to help you collapse, or narrow down, the codes you identified across your data. Identify themes or categories that seem to be related, and see if you can merge some of them. Next, settle on your priority codes—the ones that seem most promising, given your research question and theoretical orientation toward the phenomenon being studied. Once you arrive at a short list of codes, make sure each one has a definition that clearly spells out what the code means, perhaps including these definitions in the coding memos you’ve already started or in a separate codebook. This process of explicitly defining codes will not only help you make further sense of your data, but it will also give you more confidence when talking about your findings. Finally, recode the dataset using your short list of codes, making sure to apply the definition of each code consistently throughout each transcript or field note you are recoding.
In open coding, you are constantly creating new codes and tweaking the definitions of existing ones, but once focused coding begins, the definitions should not change. Any deviation will make the data analysis less trustworthy. That said, if there are pieces of data that do not fit with your revised categorization scheme, then it is important to note those deviant cases—either listing them as exceptions in your final report, or going back to the open coding stage and rethinking the theories you generated.
Especially at the focused coding stage, using multiple researchers to code your qualitative data can be quite helpful. You may miss something a participant said that another coder catches. Similarly, you may shift your understanding of what a code means and not realize it until another coder asks you about it. Having multiple coders also gives your analysis greater credibility, because readers will have less reason to believe you cherry-picked your data to support your preferred arguments. With more coders come more logistical problems, of course—the research team must come to a consensus about the meaning of each code, and they also have to find a way of ensuring that everyone is applying the codes consistently across the data. (We discussed these sorts of issues previously when we talked about inter-rater reliability.)
When reading our descriptions of open and focused coding, you might have been struck by how labor-intensive these procedures are. We should point out that we have outlined best practices. To be honest, ethnographers do not always have the luxury of time and resources to pursue by-the-textbook analysis. Fieldwork is demanding in itself. Furthermore, qualitative data analysis can be exciting for the novel theoretical discoveries and rich empirical detail it generates, and you don’t want to stamp out any joy in that process by imposing an overly fastidious and pedantic approach. That said, it’s important to be as rigorous in your analysis as you can be so that you can ultimately be confident that your theories reflect the truth of your data. To that end, try your best to do preliminary analysis while in the field to ease the burden of the analytical work later on. And be patient through the long process of observation and coding. Sometimes, how a case you observe in the field relates to your larger phenomenon may not be apparent for some time. Let the data seep deeply into your brain, and eventually compelling insights will arise.
A final word about open and focused coding: QDA software makes these two processes much, much easier. You can easily merge or divide up your codes, as shown in Figure 11.8. You can remove coding units from categories where they no longer fit. And you can finetune your codes and apply them to large amounts of new data without much problem. Collaborative coding, too, can be managed more efficiently, and software features can even help you evaluate the inter-rater reliability of your coding versus those of your collaborators.
QDA software can also conduct automated analyses, processing large volumes of text data using user-defined rules. (This is especially useful for qualitative content analysis, described in Chapter 15: Materials-Based Methods.) To automate the coding process, however, you will need to create a coding schema that specifies the keywords or codes to search for in the text. You’ll also have to test that schema beforehand using a sample of texts to ensure it is not biased or incorrect. Otherwise, the resulting analysis may wind up being useless. Keep in mind, too, that software programs can miss sarcasm, metaphors, or other subtle meanings and contexts, which may lead to significant misinterpretations in large-scale automated analyses.
Actionable Research: A Q&A with Leslie Martin
Leslie Martin is an associate professor of sociology at the University of Mary Washington in Fredericksburg, Virginia. A scholar of urban sociology and social inequality, Martin’s research focuses on issues of neighborhood and community change. She has written extensively about affordable housing in growing cities and the social consequences of government policies that promote home ownership, drawing wide media attention for her work. She has also studied policies and programs to deal with homelessness and the perceptions that chronically homeless people have about their safety and access to public spaces. As the faculty director of Mary Washington’s Center for Community Engagement, launched in 2019, Martin has sought to strengthen relationships between the university and local organizations. The courses she teaches often incorporate hands-on, community-based learning, giving students a chance to volunteer locally while applying sociological perspectives to the analysis of community problems and opportunities. Martin received her PhD from Emory University and a master’s degree in urban studies from Temple University. Before becoming a professor, she worked as a housing counselor for a fair housing organization and an AIDS service organization. She currently serves on the board of Fredericksburg Continuum of Care, a regional coalition of homeless service organizations.
How did growing up in Richmond and attending Richmond city schools shape your sociological interests?
When I was growing up, race was always evident and on the table as an issue to be explored. As a student in the 1970s and 1980s, I was ”clustered” with a handful of other white students in elementary school classrooms—an attention to my comfort not often afforded to black students in integrating schools. My middle school was within walking distance of my house, but it was also attended by students from the other side of the James River who were bussed in to achieve integration. My high school was an explicitly racially mixed alternative school. I worked on the school newspaper, and we devoted significant time to interviewing students about their views on race. All of this contributed to my belief that talking about difference and inequality was not off-limits. This primed me for the sociological endeavor.
I pursued urban studies in a master’s program just because I fell in love with cities, but later I turned to urban sociology. I appreciated the explanatory tools that sociology in particular provides to help us understand urban patterns and urban inequalities.
You have conducted various types of research at the level of urban communities. What do we as sociologists gain from studying cities at the neighborhood level?
I often tell my students that they may think local issues are “boring” compared to national issues, which are more likely to make headlines, but the local is where the rubber meets the road. It’s where structural inequalities get acted out and directly impact people’s lives. We may be concerned about a punitive turn nationally in our approaches to homelessness, but what exactly are the consequences of the local policies now in place for people who lack housing? How does our city or town’s police department actually enforce quality-of-life ordinances?
Serious analysis at the local level—and often even the neighborhood level—allows us to see clearly who has power and how it is manifested. The local level is also a place where we can see ourselves as more powerful, more influential. Working together, we can often enact change in a local community to an extent that would be much more difficult to achieve at a state or national level.
In an academic article based on your study of gentrification in Atlanta (Martin 2008), you found that some residents voiced fears about threats to their children as a socially acceptable way of objecting to the class and race backgrounds of their neighbors. How did this nuanced argument about what was left unsaid in the in-depth interviews emerge from the process of qualitative data collection and coding?
What was amazing to me was that I did not ask my respondents about children at all. I had a semi-structured interview instrument that focused on how respondents experienced their neighborhood, its changes, and their engagement with neighborhood organizations. But while I was analyzing my interview data, themes about children kept emerging—across neighborhoods, and across categories of respondents. Obviously, asking people about where they live inspires answers related to family. What I found in my data was more than that, though. Respondents were not simply speaking about their own children. They were speaking about abstract “children” they wanted to protect.
In your current role as the faculty director of the University of Mary Washington’s Center for Community Engagement, what sort of work do you do to bring together faculty, students, and community actors?
Our center is fairly new, but we are building on 30 years of student-run volunteerism at Mary Washington that has led to long-standing relationships in the community. What we are hoping to do is to make that web of relationships stronger, richer, and more complex. We have been working to become a central access point for community members, and to connect people with the resources, offices, and expertise they need in new and creative ways. For example, our collaboration with Fredericksburg City Public Schools started with a student-run gift box drive during the December holidays, but we have extended that partnership with various campaigns. Early in the pandemic, we sent our students to the school district’s “internet cafes,” which filled gaps in the community’s online access. We’ve recruited faculty and staff to serve community-based school lunches. And we’ve served as a host site for high school students with disabilities who want to gain work experience through internships.
What sorts of opportunities for community engagement do you offer students in your courses?
In some of my courses, like a first-year seminar on housing and homelessness and an upper-level sociology course on social welfare programs, students complete a set number of hours working with a community-based organization of their choosing. They then reflect on their experience and how it connects with course materials several times during the semester. For example, in the social welfare course, we end the semester by discussing their community work after they’ve had a chance to read “To Hell With Good Intentions,” a classic essay by the Catholic priest and social critic Ivan Illich, along with more contemporary writings on the charitable mindset that many people take into volunteer work. We ask how these perspectives and their own experiences relate to what we have learned about the U.S. welfare state and theories of welfare state development. The combination of their community work and the critical reflection they do in class helps them see nuance in course concepts they may not have otherwise seen.
I also teach a public sociology course where students work with community partners on research projects. The research is community-driven, which means students learn to recognize the expertise that resides outside of the classroom. They have to figure out how to adapt their academic skills to serve the needs of the community. This is challenging work for all involved, but it has proven to be important for the students and useful for our partners. For example, one student research team surveyed our university’s students about their experiences of food insecurity, and the results of that study spurred the creation of the UMW Eagle Resource Closet, our on-campus food and toiletry pantry. During the first year of the pandemic, another student team partnered with a local homeless service organization to conduct interviews with people who had been temporarily sheltered in hotels. Students discovered that while the residents saw some advantages to living in hotels, they had significant concerns as well. Many had more difficulty accessing public transportation from the hotel location, felt isolated in a room alone, or wished for more contact with service providers. These findings helped the partner organization decide to pursue a different long-term strategy for housing the chronically homeless.
How would you define the kind of publicly engaged work you do, and what are the basic principles that you follow as a researcher who works with communities?
I characterize the work that I do as public sociology. I am not convinced it is always successful—this is a work in progress! I have been trying to take Mitchell’s (2008) critical service-learning model to heart, by focusing on developing authentic relationships, maintaining a social change orientation, and working to redistribute power. This is a tall order, and I try my best to approach these goals in my work.
What would you personally say is the best way that sociologists can contribute to social change? How should sociologists view that goal in relation to their goal of advancing scientific knowledge?
What a tension: I’m having my public sociology students read about that very debate right now. Personally, I am not very motivated by advancing knowledge for its own sake. I am very motivated by actionable research. My conception of “actionable” can include theoretical works as well as empirical work—anything that helps us understand systems of inequality, and efforts to disrupt those systems. To that end, doing work that holds meaning for us and those around us is important, and giving thought to where and how we share our findings is also key.
Do you have any advice for students interested in pursuing the kind of sociological work you do?
Anyone can be a public sociologist, and public sociology can be done anywhere. Following your passion is the most important thing. I’ve always been fascinated by housing issues, and I’ve been able to stay engaged in housing work since my undergraduate career. On this and other topics, you’ll find that there is plenty of room to do publicly engaged work—in social work or in advocacy, as a researcher or as a teacher.
Key Takeaways
- Open coding is an inductive process of allowing codes to emerge from the data and refining them as you go along. Focused coding draws from the codes created during open coding, applying them consistently across all the data being analyzed.
- During open coding, you should start with broad descriptive codes but gradually move in the direction of more focused explanatory codes. The latter pose specific arguments that have been inspired by the categorization of the data you have done throughout the coding process.
- Coding can be done manually in a word processor or by using specialized qualitative data analysis software like ATLAS.ti, Dedoose, MaxQDA, NVivo, and QDA Miner, which make it easier to organize, sort, and analyze qualitative data.
- This list builds upon an earlier set of suggestions by John Lofland and his coauthors (2005). ↵
