
13. Survey Research
13.3. Designing Effective Questions and Questionnaires
Learning Objectives
- Describe some of the ways that survey questions might confuse respondents and how to address these potential problems.
- Identify some of the guidelines you should follow when devising response options.
- Discuss why pretesting is important.
In this section we’ll provide some tips on posing clear survey questions that yield useful data. We’ll also give advice on how you might present those questions in your questionnaire. As you’ll see, constructing a survey questionnaire is an art. You must make numerous decisions—not just about the content of your questions, but also their wording, format, and sequencing. All of these factors can have important implications for how people respond to your survey.
Asking Effective Questions
Video 13.2. Writing Survey Questions. This video from the Pew Research Center goes over some pointers for posing good questions.
Much of the advice that we gave about devising questions in Chapter 10: In-Depth Interviewing applies to survey questions, too. Avoid biased questions. Steer clear of jargon and be very clear about what you are asking. The key difference, of course, is that the questions for a typical survey are entirely or almost entirely closed-ended. Furthermore, the inability to ask follow-up questions means that your questionnaire must be comprehensive, leaving nothing important out. And because you are posing the exact same questions word for word to every respondent, your standards for the clarity and precision of your language need to be even greater. You’ll definitely want to pretest your questions before fielding the questionnaire, as we will discuss later. But let’s start by reviewing some fundamentals, which will necessarily repeat some of our advice in earlier chapters.
The first thing you need to do in order to write effective survey questions is identify what exactly it is that you wish to know. Let’s say you want to understand how students at your school made the transition from high school to college. Perhaps you wish to identify which students were more or less successful in this transition and which factors contributed to their success or lack thereof. To get at these research questions, your questionnaire will need to find some justifiable way of operationalizing “success” (see our discussion of operationalization in Chapter 7: Measuring the Social World). Specifically, you will want to decide which questions you should ask to measure the “success” of someone’s high school-to-college transition. Your questionnaire will also need to ask about all the factors that might have influenced each student’s likelihood of success in that transition. Consulting the literature on the topic will certainly help, but you should also take the time to do some brainstorming on your own and to talk with others (perhaps even conducting exploratory in-depth interviews) about what they think is important in the transition to college.
Once you’ve identified all the relevant topics you want to cover in your questionnaire, you’ll need to write specific questions on those topics. Make those questions as clear and to the point as possible. This is not the time to show off your poetic writing style; a survey is a technical instrument and should be written in a way that is as direct and succinct as possible.
Although we have stressed the importance of being comprehensive, at the same time you don’t want to take an everything-but-the-kitchen-sink approach by uncritically including every possible question that occurs to you. Doing so puts an unnecessary burden on your survey respondents. To help you trim a long questionnaire, rank your questions and only include those that you view as most important. Otherwise, your respondents might give up and neglect to fill out the entire form—or, even worse, they might start giving random answers just to end their suffering, leaving you with garbage data. (Partly to address these problems, larger surveys like the GSS use a split-ballot design whereby the sample is split into groups, and each group receives a different set of supplementary questions in addition to a universal set of questions that everyone answers; this strategy of having multiple questionnaires, or ballots, increases the total number of questions covered while not further lengthening the survey interview.)
Make sure that every question you pose will be relevant to every person you ask to answer it. This means two things: (1) your respondents should have adequate knowledge about whatever topic you are asking them about; and (2) they should have experience with whatever events, behaviors, or feelings you are asking them to report. For example, you probably wouldn’t want to ask a sample of 18-year-old respondents how they would have advised U.S. president Ronald Reagan when news of his administration’s sale of weapons to Iran broke in the mid-1980s. For one thing, few 18-year-olds are likely to have any clue about how to advise a president. Furthermore, the 18-year-olds of today were not even alive during Reagan’s presidency, so they have had no experience with the event you would be asking them about.
Let’s apply this criterion of relevance to our example study examining students’ transitions from high school to college. In this case, our respondents should understand what exactly we mean by “transition to college” if we explicitly use that phrase in our questionnaire; otherwise, we need to break down that jargon into simpler and more concrete terms. Furthermore, we probably want to find respondents who have actually experienced the transition to college themselves if we are going to ask them about that topic (unless understanding younger people’s expectations about that transition—which may or may not turn out to be realistic—is our goal, of course).
Even more so than in-in-depth interviewing, the responses of survey respondents are very sensitive to the types of questions asked. You cannot follow up to tease out what people actually think, so poorly framed or ambiguous questions in a survey will likely result in meaningless responses with little value. Survey researchers should avoid questions that suffer from the following problems, all of which are likely to confuse at least some of your respondents:
- Jargon, culturally specific terms, and other potentially confusing phrasings: Survey questions should be stated using simple language, preferably in active voice, and without complicated words or jargon that may not be understood by a typical respondent. All questions in the questionnaire should be worded in a similar manner to make it easy for respondents to read and understand them. You should also avoid using terms or phrases that may be regionally or culturally specific. The exception, of course, is if all your respondents come from the region or culture whose terms you are using. Likewise, if your survey is targeted at a specialized group of respondents, such as doctors, lawyers, and researchers, using jargon may make sense. These respondents would be using such terms in their everyday environment, and you don’t want to bog down your questionnaire with unnecessary explanations of terms.
- Double negatives: Any time respondents are forced to decipher questions that utilize two forms of negation, confusion is bound to ensue. Consider this question: “Did you not drink during your first semester of college?” A response of “no” would mean that the respondent did actually drink—they did not not drink. Generally speaking, avoiding negative terms in the wording of your questions will make their meaning clearer.[1] An infamous example of the bewilderment created by negative terms is a 1992 Roper poll that asked, “Does it seem possible or does it seem impossible to you that the Nazi extermination of the Jews never happened?” A shocking 22 percent of respondents said it was “possible” the Holocaust never happened, which greatly alarmed the group that had commissioned the poll, the American Jewish Committee. However, when Roper fielded another poll two years later, it reworded the question to make its meaning clearer: “Does it seem possible to you that the Nazi extermination of the Jews never happened, or do you feel certain that it happened?“ This time, only 1 percent of respondents said it was possible that the Holocaust had never happened—still a worrisome figure, but one that didn’t portend an extreme and sudden spike in Holocaust denialism (Kagay 1994).
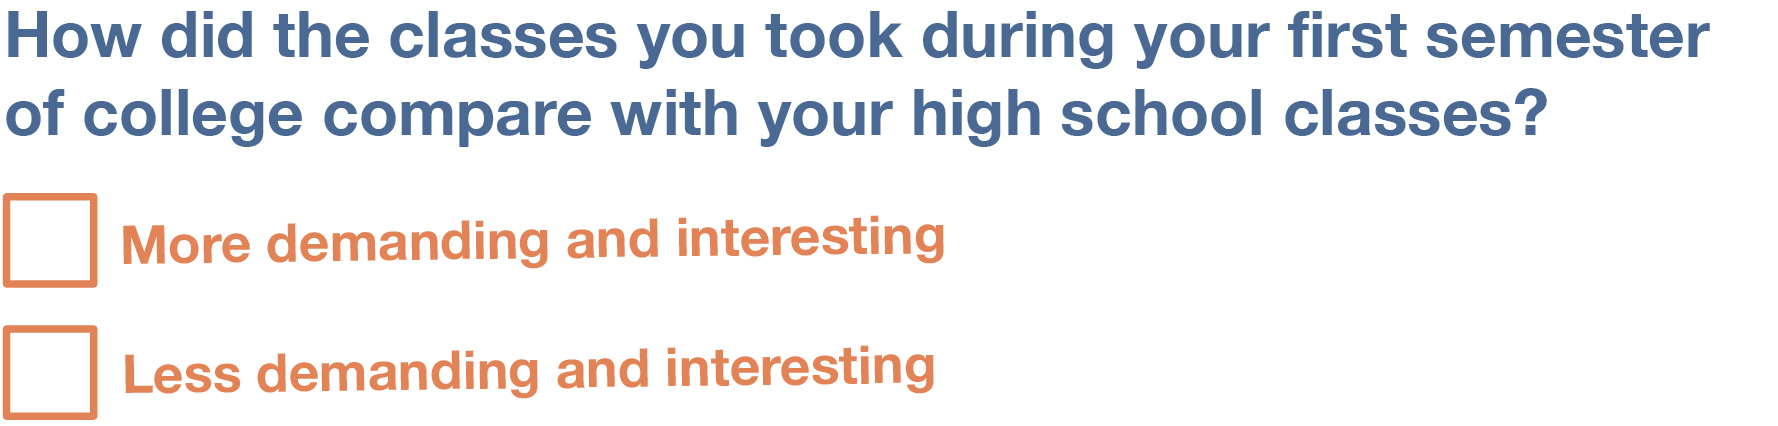
- Double-barreled questions: This refers to asking multiple questions as though they are a single question. This is a problem because survey respondents may not know how to respond. Let’s say we asked the following question in our survey about the transition to college: “Did you find the classes you took during your first semester of college to be more demanding and interesting than your high school classes?” How would someone respond if they felt their college classes were more demanding but also more boring than their high school classes? Or less demanding but more interesting? Because the question combines “demanding” and “interesting,” there is no way to respond “yes” to one criterion but “no” to the other.
- Leading or otherwise biased questions: As we discussed in Chapter 10: In-Depth Interviews, the questions you pose to participants—regardless of whether they are closed-ended or open-ended—should not lead subjects to answer in a certain way. Carefully scrutinize the phrasing of your questions to avoid biased language or a biased tone. In a similar way, try to minimize the inevitable problem of social desirability bias, the tendency for people to answer questions in a way that presents them in a favorable light. We all probably know the politically correct response to a variety of questions, whether we agree with the politically correct response or not. But we can phrase our questions in a way that does not make the “right” answer so obvious. As we discussed earlier in regards to in-depth interviewing, one way to encourage respondents who might be reluctant to give a stigmatized answer is to preface the question with a statement that suggests multiple responses are socially acceptable—for instance, “Some people think [alternative 1] … Other people think [alternative 2] … What do you think?” Reminding respondents of the study’s promises of anonymity or confidentiality can also help assure respondents that they can speak openly and truthfully. Another way to avoid problems of social desirability bias is to try to phrase difficult questions in the most benign way possible. Earl Babbie (2016) recommends imagining how you would feel responding to your survey questions. If you would be uncomfortable, chances are others would as well.
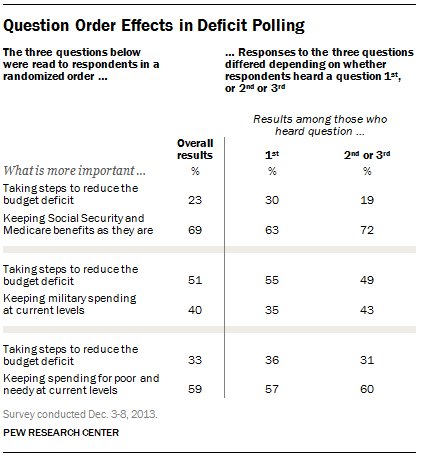
Note that the leading nature of certain questions can be very subtle. For instance, the Pew Research Center randomized the order of its questions on a survey that asked people whether they support either (a) maintaining spending in a specific area or (b) cutting that spending to reduce the budget deficit (Tyson and Doherty 2013). As summarized in Figure 13.3, the survey asked people about three spending areas—Social Security and Medicare benefits, military spending, and spending for the poor and needy—and presented the choice about whether to reduce or maintain spending in each of three areas in a random order. Pew found that people’s support for cutting spending in a particular area was highest when that question was asked first out of the three questions; it decreased, though, when the question about spending reductions in that area was asked later. For instance, when respondents were asked whether to cut Social Security and Medicare, 63 percent felt current spending levels should be maintained when that spending area was brought up first; 72 percent felt that way when it was brought up second or third, however. It seemed that people were more willing to slash a particular set of programs at first blush, but after they heard about competing priorities, they became more reluctant to do so. The way that question ordering can influence how people respond on surveys sometimes leads survey researchers to randomize that ordering, which can be applied to a questionnaire’s sections, to questions within a section, or even to the response options for a single question.
Response Options
While posing clear and understandable questions in your survey is certainly important, so, too, is providing respondents with unambiguous response options, the answers that you provide to the people taking your survey. In a quantitative survey, most, if not all, of your questions will be closed-ended in this fashion. This allows you to easily analyze your respondents’ answers to individual questionnaire items and identify patterns in those responses. As we discussed in Chapter 7: Measuring the Social World, there are many well-vetted types of closed-ended survey questions to choose from, such as Likert scales and semantic differentials.
Usually, you will want to ask respondents to choose a single (or best) response to each question you pose. That said, in some cases it makes sense to instruct respondents to choose two or more response options for a single question—for instance, if they are describing their racial and ethnic identity. One word of caution here is that accepting multiple response options for a single question will make things more complex when it comes to tallying and analyzing your survey results—in many data analysis programs, you will need to treat every response option as a separate yes/no question.
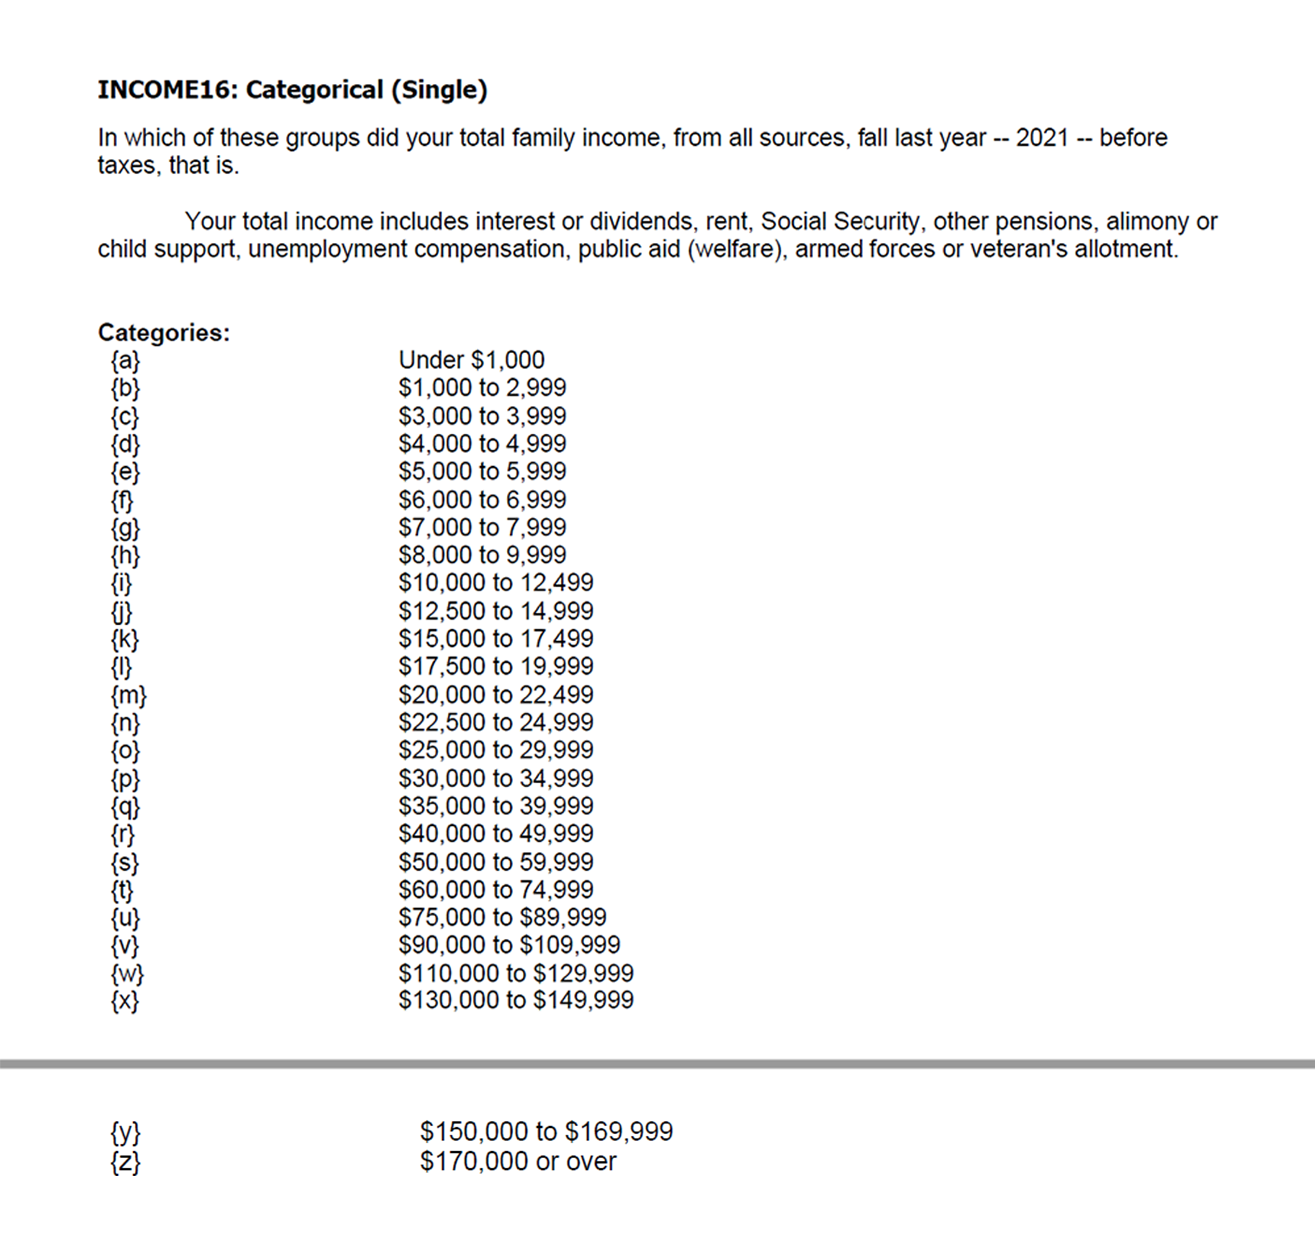
There are two major guidelines to follow when devising response options for closed-ended survey questions. First, be sure that your response options are mutually exclusive. Look at Figure 13.4, which contains a General Social Survey question asking about the respondent’s family income. Notice how there are no overlapping categories in the response options. In fact, the dollar amount for each income category ends in “999” so that the next income category can start with the round number, ensuring that a single respondent can never fall into two categories. Meanwhile, the first category (“Under $1,000”) and the last category (“$170,000 or over”) cover all possibilities lower or higher than the income range captured by the other response options.
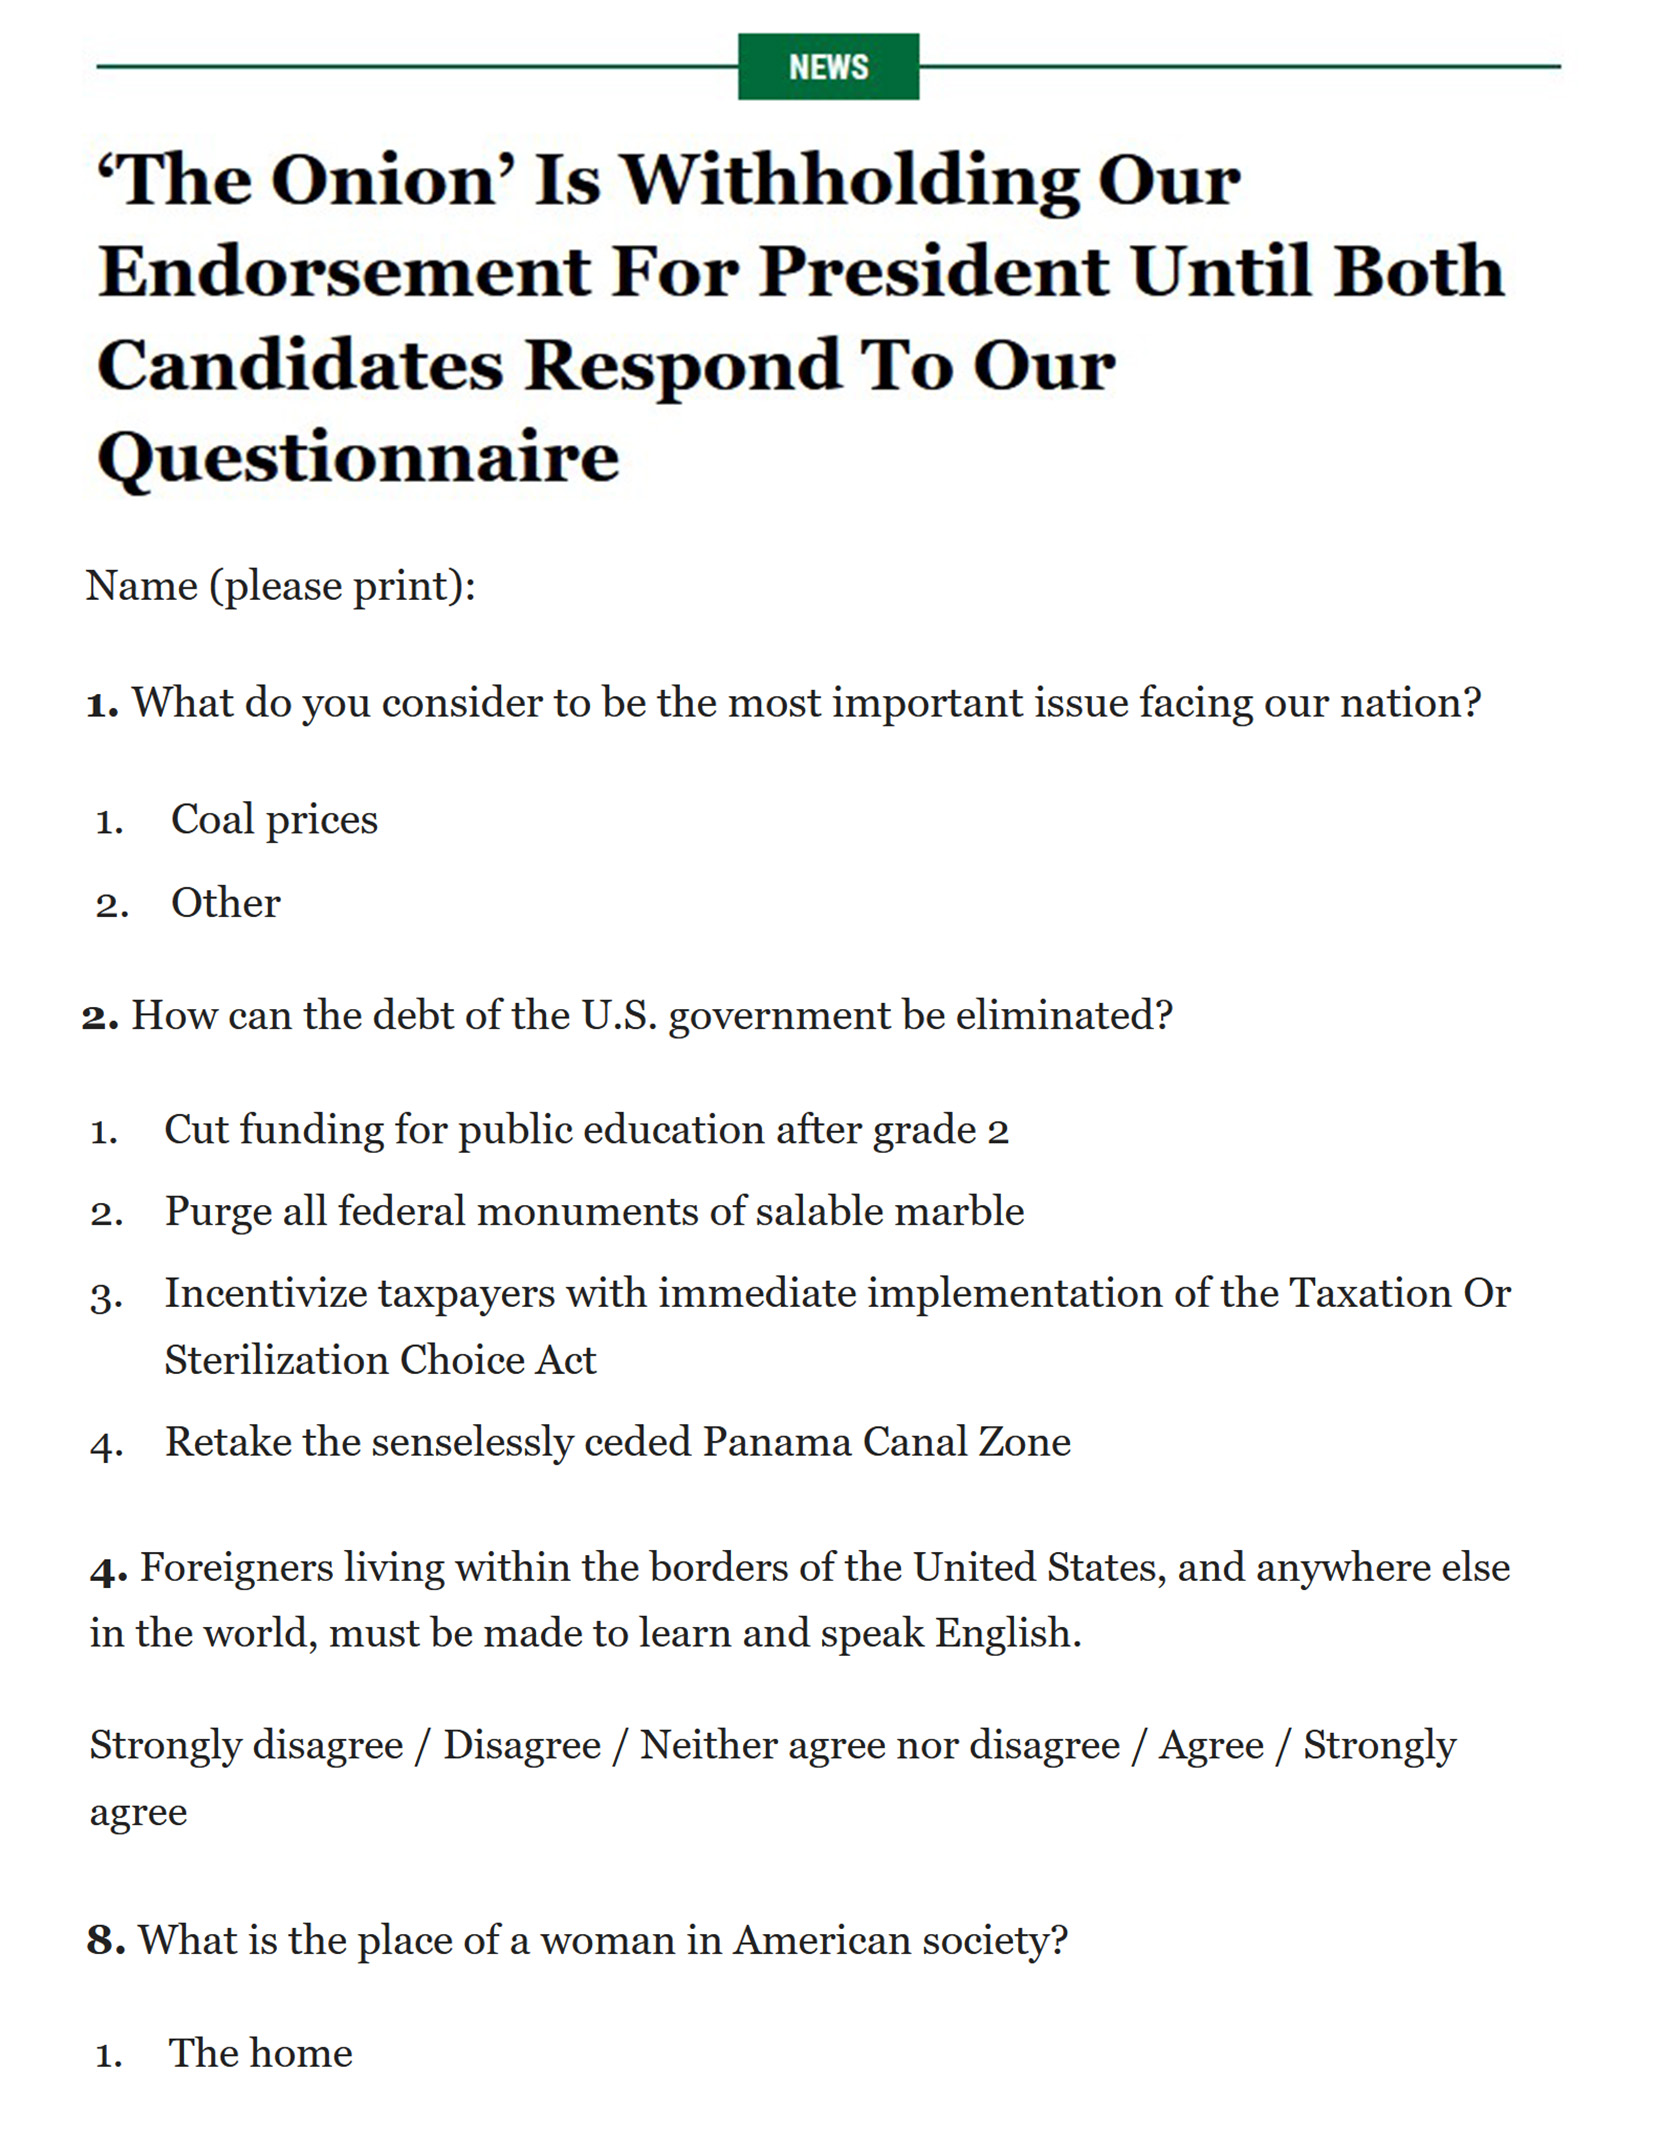
Second, the response options for closed-ended questions should also be exhaustive. In other words, every possible response should be covered in the set of response options that you provide. (Sometimes, this criterion is called collectively exhaustive, leading to the useful mnemonic that survey questions must be MECE, or “mee-cee”: mutually exclusive and collectively exhaustive.) In Figure 13.5, the response options for Questions #2 and #8 clearly do not cover all possibilities. By contrast, Question #4 has sufficient coverage across its response categories: those vehemently opposed to the statement can choose the first response option (“strongly disagree”) while those vehemently in favor can choose the fourth response (“strongly agree”). All the possibilities in between these two extremes are covered by the middle two response options. An easy way of making a question’s response options exhaustive is to include an “Other” category that captures any answers not covered by the explicit response options. That said, your stated options should offer sufficiently comprehensive coverage so that not too many people choose the “Other” option—as might happen with Question #1 in the example.
Sometimes survey researchers include open-ended questions in their questionnaires as a way to gather additional details from respondents. An open-ended question does not include response options; instead, respondents are asked to reply to the question in their own way, using their own words. These questions are generally used to go beyond the closed-ended questions and find out more about a particular respondent’s experiences or feelings. If, for example, a survey includes closed-ended questions asking respondents to report on their involvement in extracurricular activities during college, an open-ended question could ask respondents why they participated in those activities or what they gained from their participation. While responses to such questions may also be captured using a closed-ended format, allowing participants to share some of their responses in their own words can make the experience of completing the survey more satisfying to them. It can also reveal new motivations or explanations that had not occurred to the researcher.
In the previous section, we discussed double-barreled questions. Response options can also be double-barreled, and this should be avoided. Figure 13.6 is an example of a question that uses double-barreled response options.
Fence-sitting and floating can also present problems when you are crafting response options for your survey questions. Fence-sitters are respondents who choose neutral response options instead of disclosing their real preferences. This can occur if respondents are given, say, five rank-ordered response options, such as strongly agree, agree, no opinion, disagree, and strongly disagree (a Likert scale with five options). Some people will be drawn to the neutral option—“no opinion”—even if they actually do have an opinion. This is particularly likely to be the case if their true opinion is not a socially desirable opinion.
Floaters are respondents who choose a substantive answer to a question when in actuality they don’t understand the question or don’t have any opinion on the matter. Floaters can be motivated by the social desirability of having an opinion on an important issue—perhaps encouraged to do so by an enthusiastic interviewer they want to impress. This tendency can be exacerbated if a given question does not provide a neutral response. For instance, if a respondent is only given four rank-ordered response options, such as strongly agree, agree, disagree, and strongly disagree (a Likert scale with four options), those who have no opinion have no choice but to select a response that suggests they do have an opinion.
As you can see, floating is the flip side of fence-sitting, and there is no way to solve one problem without worsening the other. Ultimately, which and how many response options you provide to respondents depend on the goals of your research. Sometimes researchers actually want to learn something about people who claim to have no opinion. In this case, allowing for fence-sitting would be necessary. If researchers are confident that their respondents are familiar with every topic in their survey, however, they may want to force respondents to choose an opinion.
A final bit of advice about thinking up response categories is to consider using a matrix to streamline the options you offer, especially for self-administered surveys. A matrix presents a set of questions for which the answer categories are all the same. As you can see in the example matrix in Figure 13.7, you might have a list of statements in your matrix and give the respondent the option of indicating that they strongly agree, agree, disagree, or strongly disagree with each of them. If you have a set of questions for which the response options are more or less the same, it may make sense to create a matrix rather than posing each question and its response options individually. You might need to revise the wording of some questions so that all of them can be answered with the same set of response options, but this approach has a substantial payoff. Not only will it save you some space in your survey, but it will also help respondents breeze through your questions.
Designing Questionnaires
In addition to devising good questions and response options, you’ll also need to think about how to present them to survey respondents. In general, your questions should flow logically from one to the next. One of the first things to do once you’ve come up with a set of survey questions you feel confident about is to group those questions thematically. If you organize your questionnaire by topics and move similar questions next to each other, it will help the respondent understand where the survey is headed at any point in the process. It will also become readily apparent to you which of your questions repeat or overlap one another and therefore could be consolidated or dropped.
Once you have grouped similar questions together, you’ll need to think about the order in which to present those question groups. Many survey researchers believe that it is best to begin a survey with questions that will make respondents want to keep plowing through the questionnaire (Babbie 2016; Neuman 2009). In other words, don’t bore respondents, but don’t scare them away either.
To achieve the best response rates, some survey methodologists recommend that the questions should flow from the least sensitive to the most sensitive, from the factual and behavioral to the attitudinal, and from the more general to the more specific (Dillman, Smyth, and Christian 2014). In the list that follows we offer some more specific advice, but note that at the end of the day the specific ordering may not matter all that much, you should really follow whatever sequence you think works well for the population who will be filling out your questionnaires.
- Start with non-threatening questions that can be easily answered. Basic demographic questions (age, gender, education level, etc.) are a good place to begin. If your survey deals with a sensitive or difficult topic, you don’t want to scare respondents away or shock them by jumping right into your most intrusive questions.
- Never start with an open-ended question. On a survey, it is generally better to use an open-ended question when you want to give the respondent a chance to elaborate on an answer they gave to a closed-ended question.
- When appropriate, follow a chronological ordering. For instance, if your questions are focused on a sequence of events, it makes sense to start with questions about the earliest events and end with questions about the latest events.
- Ask about one topic at a time. When switching topics, use a transition, such as “The next section examines your opinions about …”
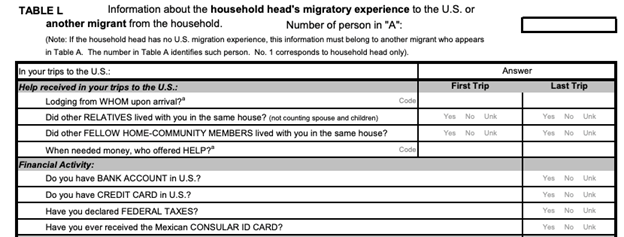
- Use filter questions to avoid asking people about topics irrelevant to them. If you have a series of questions that just apply to a portion of your respondents, you should include filter questions (also called contingency questions) in your questionnaire right before that set of questions. As illustrated in Figure 13.8, filter questions identify some subset of survey respondents who are then asked additional questions not worth asking of the entire sample. For instance, your filter question might ask if the respondent is a parent. If the respondent answered “no,” the interviewer would skip over a subsequent set of questions asking about parenting. (In a self-administered questionnaire, you might provide instructions like the following: “If you answered ‘yes’ to question 5, please proceed to Section 2. If you answered ‘no,’ go to Section 3.”) Routing respondents away from unnecessary questions will shorten the time it takes them to fill out the questionnaire and therefore reduce any survey fatigue they may be feeling.
Speaking of which, how long should your questionnaire be? A perfectly good survey can be just a page or two, or it could be a dozen or more pages. The ideal length depends on several factors. First, how complex is your topic? Wanting to understand how grades vary by gender and year in school certainly requires fewer questions than wanting to know how people’s experiences in college are shaped by demographic characteristics, college attended, housing situation, family background, college major, friendship networks, and extracurricular activities. Even if your research question requires that many questions be included in your questionnaire, do your best to keep the questionnaire as brief as possible. Any hint that you’ve needlessly included questions will turn off respondents and may make them not want to complete your survey.
Second, how much time are your respondents likely to be willing to spend completing your questionnaire? If you are surveying retired persons, they may have plenty of unstructured free time to devote to a lengthy survey, but the same is probably not true for busy professionals. If they even agree to use their precious free time to complete a questionnaire, they may not want to spend more than a few minutes on it. However, if you catch them at a work conference where they are milling about aimlessly anyways, maybe they’ll give your survey more time. Likewise, if you are studying students and have official approval to administer your survey in class, you may be lucky to obtain a dedicated block of time just for your research.
As you can see, the time that researchers ask respondents to spend filling out surveys varies greatly. As with question order, there is no clear-cut, always-correct answer about questionnaire length. You’ll need to consider the unique characteristics of your study and your sample and plan accordingly.
You can roughly gauge the amount of time it takes to complete your questionnaire through pretesting. Pretesting, also known as piloting, is a trial run of the questionnaire. It allows the researcher to get feedback so that the survey instrument can be improved before it is actually fielded. Pretesting can be quite expensive and time-consuming if your goal is to test your questionnaire on many people who closely resemble your target population. But you can learn a lot and spot potentially disastrous problems with your draft questionnaire by pretesting with a small number of people you have easy access to, even if they don’t perfectly match your target population. (You can even ask friends and colleagues to complete the survey as though they were actually members of your population of interest.) Any helpful pretester can give you feedback on how understandable your questions are, whether the ordering of your topics flows smoothly, and whether any of your questions are exceptionally boring or offensive. Just by running through the questionnaire, they can also tell you whether there are places where you should include filter questions or adjust those you already have. You should time pretesters as they take your survey. This will let you know whether you have some wiggle room to add additional items, or whether you really do need to trim your draft questionnaire. It will also give you a time estimate to provide respondents when you actually start administering your survey in the field.
A final consideration has to do with the design of self-administered questionnaires. If you are giving a respondent a printed questionnaire form or directing them to an online form, you need to make sure it is exceedingly easy to read and navigate. A messy or unattractive presentation style can confuse or annoy respondents and make them take your survey less seriously. Avoid cramming too much material into a single page. Leave a reasonable amount of white space between items. Make sure all instructions are exceptionally clear. Proofread the form and fix any typos and bad grammar. Number your pages and include section headers to break up long lists of questions. And use a professional font with an easily readable type size—at least 12-point. You want the look and feel of your questionnaire to convey all the thought and effort you put into creating your survey.
Key Takeaways
- Write questions that are clear and succinct, avoiding jargon and culturally specific terms, double negatives, double-barreled questions (and answers), and leading and otherwise biased questions.
- The response options for your questions should be mutually exclusive and exhaustive. Be aware, too, of how offering a neutral option might encourage or discourage people from offering their actual opinions (or lack thereof).
- Make sure that your survey questions will be relevant to all the respondents answering, using filter questions when necessary to allow respondents to skip questions that don’t apply to them.
- Having people pretest your survey is essential. It will flag errors that may greatly reduce the value of your survey, and it will let you know whether respondents will be able to complete your survey in a reasonable amount of time.
Exercise
Based on the guidelines in this section, write 10 closed-ended questions for a survey on a topic of your choosing. Have a peer pretest your survey and give you feedback on what can be improved.
- Though this is generally true, some researchers argue that negatively worded questions should be integrated with positively worded questions to ensure that respondents have actually read each question with care. See, for example, this handout by Utah State University researchers on how to write survey questions for program evaluations. ↵
