
6. Sampling
6.3. Probability Sampling

Learning Objectives
- Describe how probability sampling achieves generalizability.
- Identify the various types of probability samples, and understand the logic behind each approach.
All probability sampling techniques have two attributes in common: (1) every single unit in the population has a chance (a nonzero probability) of being selected for the sample, and (2) the sampling procedure involves a random process of selection at some point. We’ll break down what this means in a bit, but the first thing to know is that the goal of this sampling approach is to achieve generalizability. This is the key distinction between probability samples and nonprobability samples. As we alluded to earlier, generalizability refers to the idea that the results obtained from a given sample apply to the population from which it was drawn. If this is the case, then we say our study’s results are “generalizable” to the population of interest.
This brings us to the first of our two conditions: when we use probability sampling, every person (or other unit of analysis) in the population should in theory be able to be selected for the sample, and we should know the likelihood of that selection. Why do we care about this likelihood that a particular case will be selected? Knowing this information allows us to make sure our sample is representative—that it does not look substantially different from the population as a whole. Having a representative sample means, in turn, that we can generalize any statistics we derive from that sample back to the population. If our sample is truly representative, then we can be confident that any means, standard deviations, and other figures that we calculate from it also apply to the larger population.
Note that a representative sample resembles the population from which it was drawn in all the ways that are important for the research being conducted. If, for example, your study intends to say something about differences between men and women, you better make sure that your sample doesn’t contain only women. That’s a bit of an oversimplification, but the point with representativeness is that if your population varies in some way that is critical to your study, your sample should contain the same sorts of variation.
We mentioned earlier that researchers should know the likelihood that each case in their population of interest will be included in their sample. What does this mean? For the more advanced sampling techniques we’ll describe later, the probability of being selected into a sample can actually vary, but for the moment, we can think of this likelihood of selection in simpler terms: all possible cases in the researcher’s target population have an equal chance of being selected for inclusion in the study. To ensure this outcome, we rely on random selection. In practice, this means picking cases from the population at random—like flipping a coin, or drawing numbers from a hat—so that every individual has an equal chance to participate in our survey, every news article has an equal chance to be included in our content analysis, and so on. If the chance of being selected for a sample is equal across all the cases in a given population, then according to statistical theory, the sample should be representative of that population.
Some of the probability sampling techniques that sociologists frequently use are simple random sampling, systematic sampling, stratified sampling, and cluster sampling. We will go over each strategy, but first we want to say something about two critical topics in probability sampling: sampling error and sample sizes.
Using random selection does not mean that your sample will be perfect. No sample is perfect. The only way to obtain a perfect result—that is, a precise estimate of the actual values in the population of interest—would be to include everyone in the population in your sample, which defeats the whole point of sampling. Generalizing from a sample to a population always contains some degree of error—that is, some amount of inaccuracy in your measurement of the actual values in the population. When researchers use random selection techniques to draw a sample, however, they are actually able to estimate how closely the sample represents the larger population from which it was drawn. Specifically, they are able to calculate the sampling error—that is, the difference expected between the results obtained from a sample and the actual parameters of a population. That is an incredibly powerful feature of probability sampling, which gives studies using it a high degree of precision and credibility—assuming, of course, that sampling bias has not skewed the sample.
In quantitative research, the size of the sample is critical because it affects the sampling error. Larger samples are subject to less sampling error—the larger the sample, the closer any statistic will be to the actual value in the population, again assuming your sample is truly random. In fact, quantitative researchers can use statistical theory to calculate the size of the sample they need to estimate a value in the population of interest and can be fairly confident that their estimate closely matches the actual value. Technically speaking, quantitative researchers do not need to obtain a single “right” number of cases for their samples, given that the ideal number depends on this specific level of confidence and the precision they desire for their results.
That said, in sociology, you typically see an n of at least 100 for a statistical analysis to be published. For reputable national surveys, you usually see sample sizes of at least 1,000, although political polls—which will often be fielded numerous times in the run-up to an election—may just have a few hundred respondents. Higher-profile surveys in need of greater precision and coverage go further: for example, the General Social Survey recruits 2,000 or more respondents when it fields its questionnaires every other year, and the Current Population Survey, a monthly survey conducted by the U.S. Census Bureau that is used to calculate the federal government’s official employment statistics, has a sample size of 60,000 households.
Simple Random Sampling

Simple random sampling is an intuitive way of generating a representative sample, given how random selection will ensure that the characteristics of that sample reflect those of the larger population. In simple random sampling, all members of the population (more accurately, of the sampling frame) are given an equal probability of being selected. In other words, each case is identified strictly based on chance.
To draw a simple random sample, you must start with a sampling frame—again, a list of every single element, or member, of your population of interest. Number each element in that list sequentially and then randomly select elements. Then collect data from those elements. For example, if you were conducting a survey of students at your university, you might obtain a list of students from the university’s administration, give each student a unique number, and then use a random number generator to pick students by their numbers. (Websites like Stat Trek and Randomizer.org provide random number generators that you can use for samples of whatever size.) You would contact those students and continue to recruit respondents until you had enough people in your sample.
Video 6.2. Random Sampling. This video from the Pew Research Center provides a brief explanation of random sampling and why it’s important.
Systematic Sampling
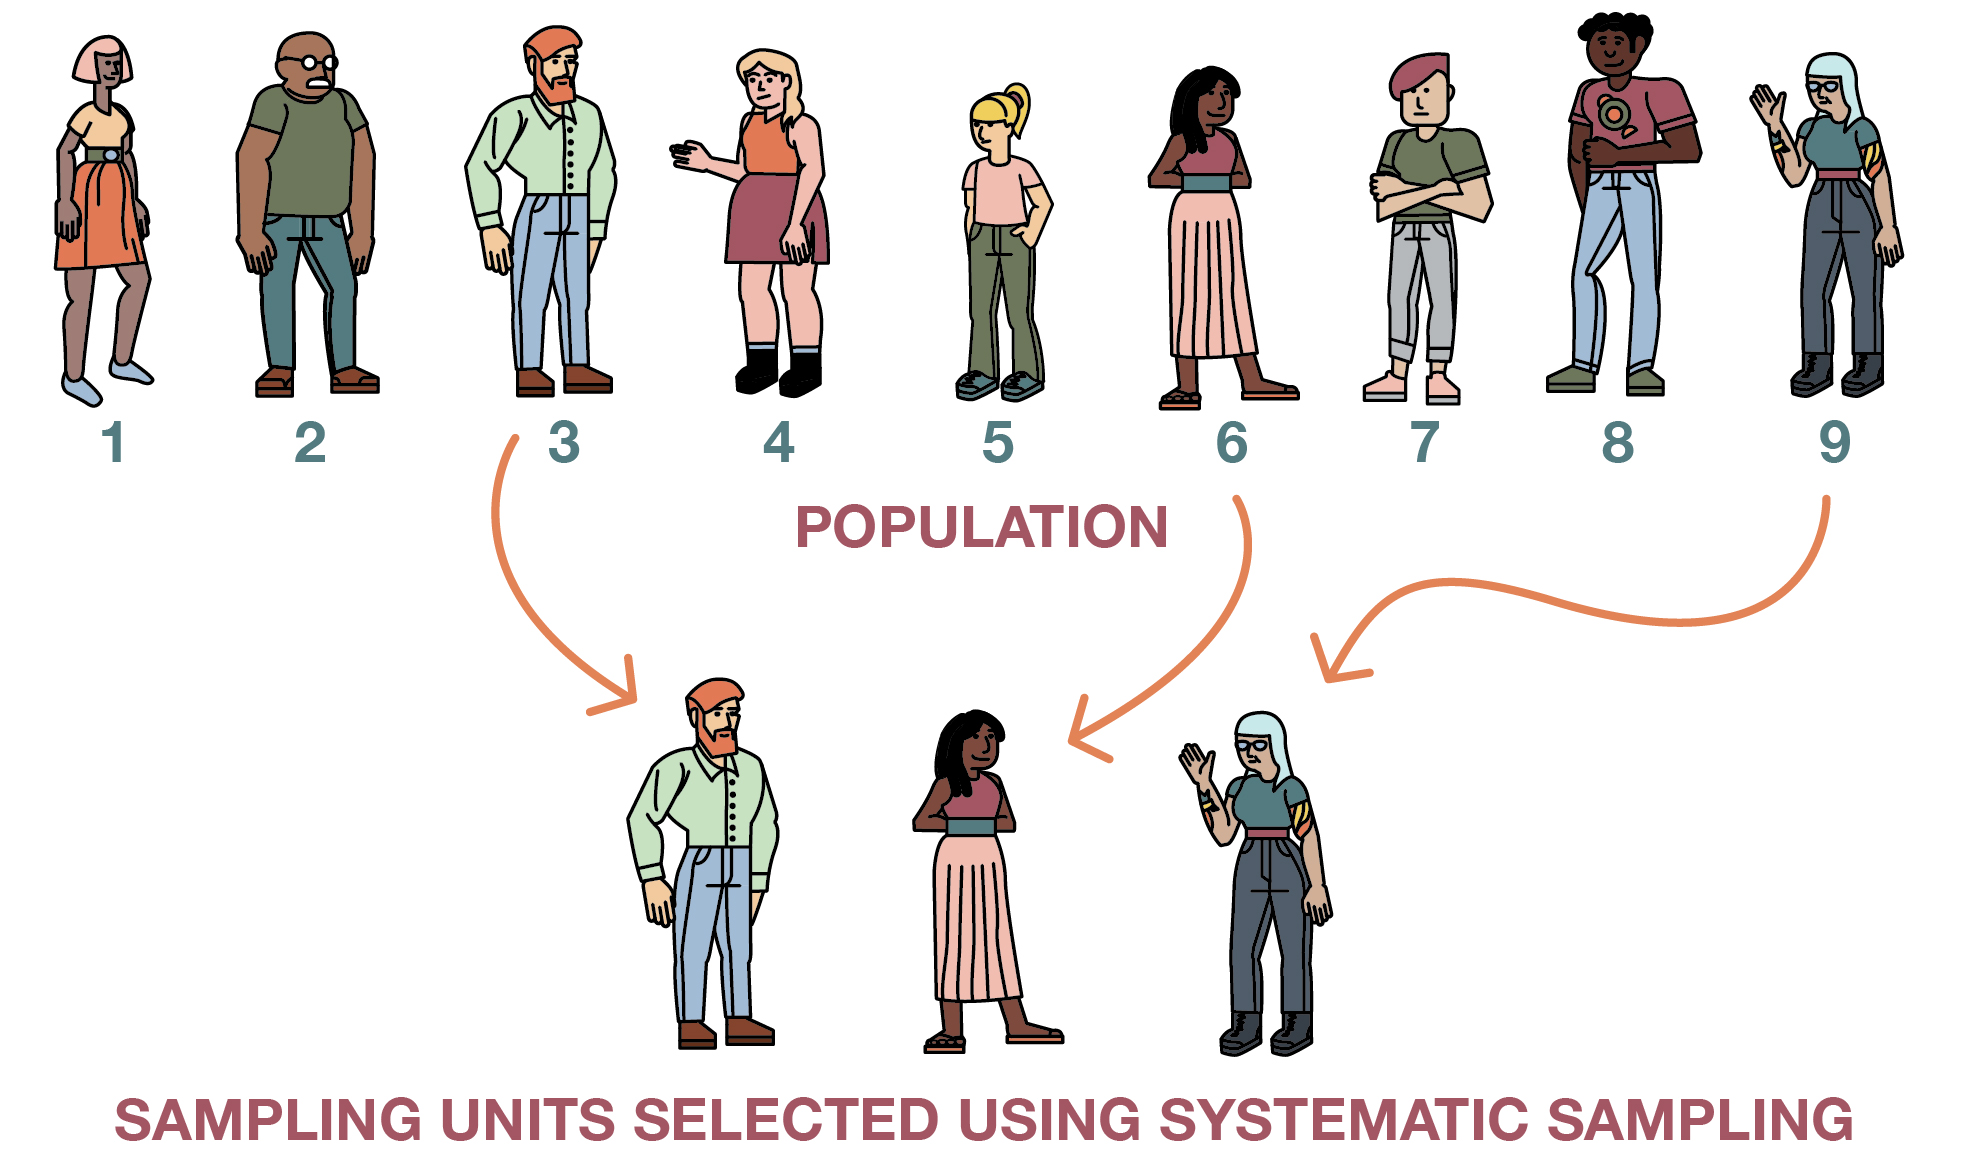
Systematic sampling techniques (illustrated in Figure 6.4) are somewhat less tedious but offer the benefits of a random sample. As with simple random samples, you must be able to produce a sampling frame, a list of every person in your population. Rather than having to use a random number generator, however, in systematic sampling you simply select elements from your list in specified intervals—say, every kth element on your list. The number you use in place of k is your selection interval, or the distance between the elements you select for inclusion in your study. To begin the selection process, you first need to figure out how many elements you wish to include in your sample. Let’s say you want to interview 25 fraternity members on your campus, and 100 people on campus are members of fraternities. To define your selection interval, simply divide the total number of population elements by your desired sample size. In this case, you would divide 100 by 25, so k would be four, and you would want to select every fourth element in your list. You do not, however, just start from the first element in the list. To allow for an equal chance that every element could be selected, it is important that the starting point be randomly chosen from within the first k elements on the list. For instance, in our fraternity study, we would randomly choose from among the first, second, third, or fourth name on our list as our first potential interviewee to contact. Systematic sampling would then involve the selection of every fourth name from that point in the list onward.
There is one scenario where systematic sampling should clearly not be employed. If your sampling frame has any pattern to it, you could inadvertently introduce bias into your sample by using systematic sampling. This is sometimes referred to as the problem of periodicity—the tendency for a pattern to occur at regular intervals. For instance, let’s say we wanted to randomly select four days in a month during which we plan to conduct observations at the campus library. We decide to use systematic sampling to identify our observation days, following the procedure we’ve already outlined:
We divide our population size (30 days) by our desired sample size (four days), arriving at a selection interval of seven.
- Out of the first seven cases, we randomly select the second one as our starting point.
- Given our selection interval of seven, we select every seventh day after our starting point.
- You can see how this procedure works out (or, rather, doesn’t work out) in Figure 6.5:
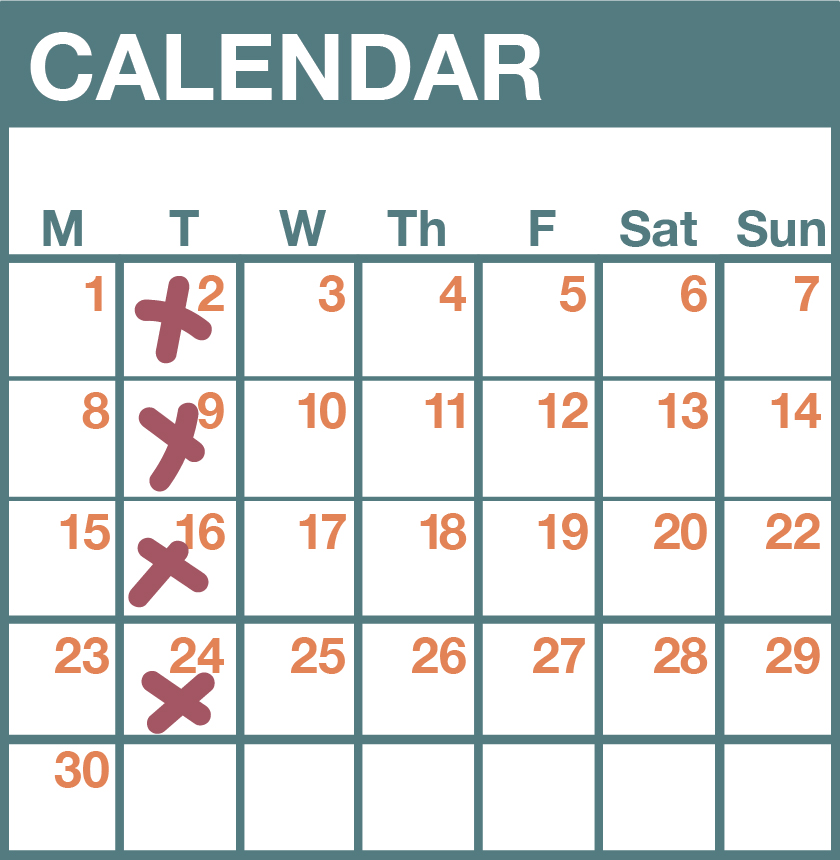
Do you notice any problems with our selection of observation days in Figure 6.5? Apparently, we’ll only be observing on Tuesdays. As you have probably figured out, that is not a good plan if we really wish to understand how public spaces on campus are used. Weekend use probably differs from weekday use, and that use may even vary during the week, just as class schedules do.
Stratified Sampling
In cases such as the one presented in Figure 6.5, in which the sampling frame is cyclical, it would be better to use stratified sampling. In stratified sampling, a researcher will divide the study population into two or more mutually exclusive subgroups (also known as strata) and then draw a sample from each subgroup. In this example, we might wish to first divide our sampling frame into two lists: weekend days and weekdays. Once we have our two lists, we can then apply either simple random or systematic sampling techniques to each subgroup.
Stratified sampling is a good technique to use when a subgroup of interest makes up a relatively small proportion of the overall sample. For example, in our observation of the campus library, we want to be sure to include both weekdays and weekends in our sample. Because weekends make up less than one-third of an entire week, it is possible that a simple random or systematic strategy would not yield sufficient weekend observation days. To ensure that we have sufficient coverage, stratified sampling is the way to go.
In fact, stratified sampling becomes essential when we want to make sure that a tiny subgroup is adequately represented in our sample. For example, suppose we are conducting a survey of people’s perceptions about the police in Richmond, Virginia. Clearly, it would be important to include the opinions of members of many different racial and ethnic groups in such a survey, given how critical these factors are thought to be in shaping how the police interact with civilians. But some racial and ethnic groups make up a very small percentage of the population in Richmond. According to the U.S. Census Bureau’s American Community Survey, the city’s population in 2018 was 46.2 percent African American, 41.5 percent white, 7.1 percent Hispanic, 2.4 percent Asian, and 2.8 percent other. As a result, simple random or systematic sampling might not yield many—or even any—respondents from those groups, depending on how large our overall sample is.
By using stratified sampling, however, we can ensure that our sample contains sufficient numbers of such individuals. In this case, our strata (the segments into which our sample is divided) are racial and ethnic groups. We would carve up our sampling frame into these strata, and then choose a number of cases from each stratum—each racial and ethnic group—in line with its numbers in the larger population. For instance, if we were stratifying by race in our Richmond sample, 46.2 percent of our respondents should be African American, 41.5 percent should be white, and so on. (Obviously, we can round the exact proportions to match what is possible in our smaller sample.)
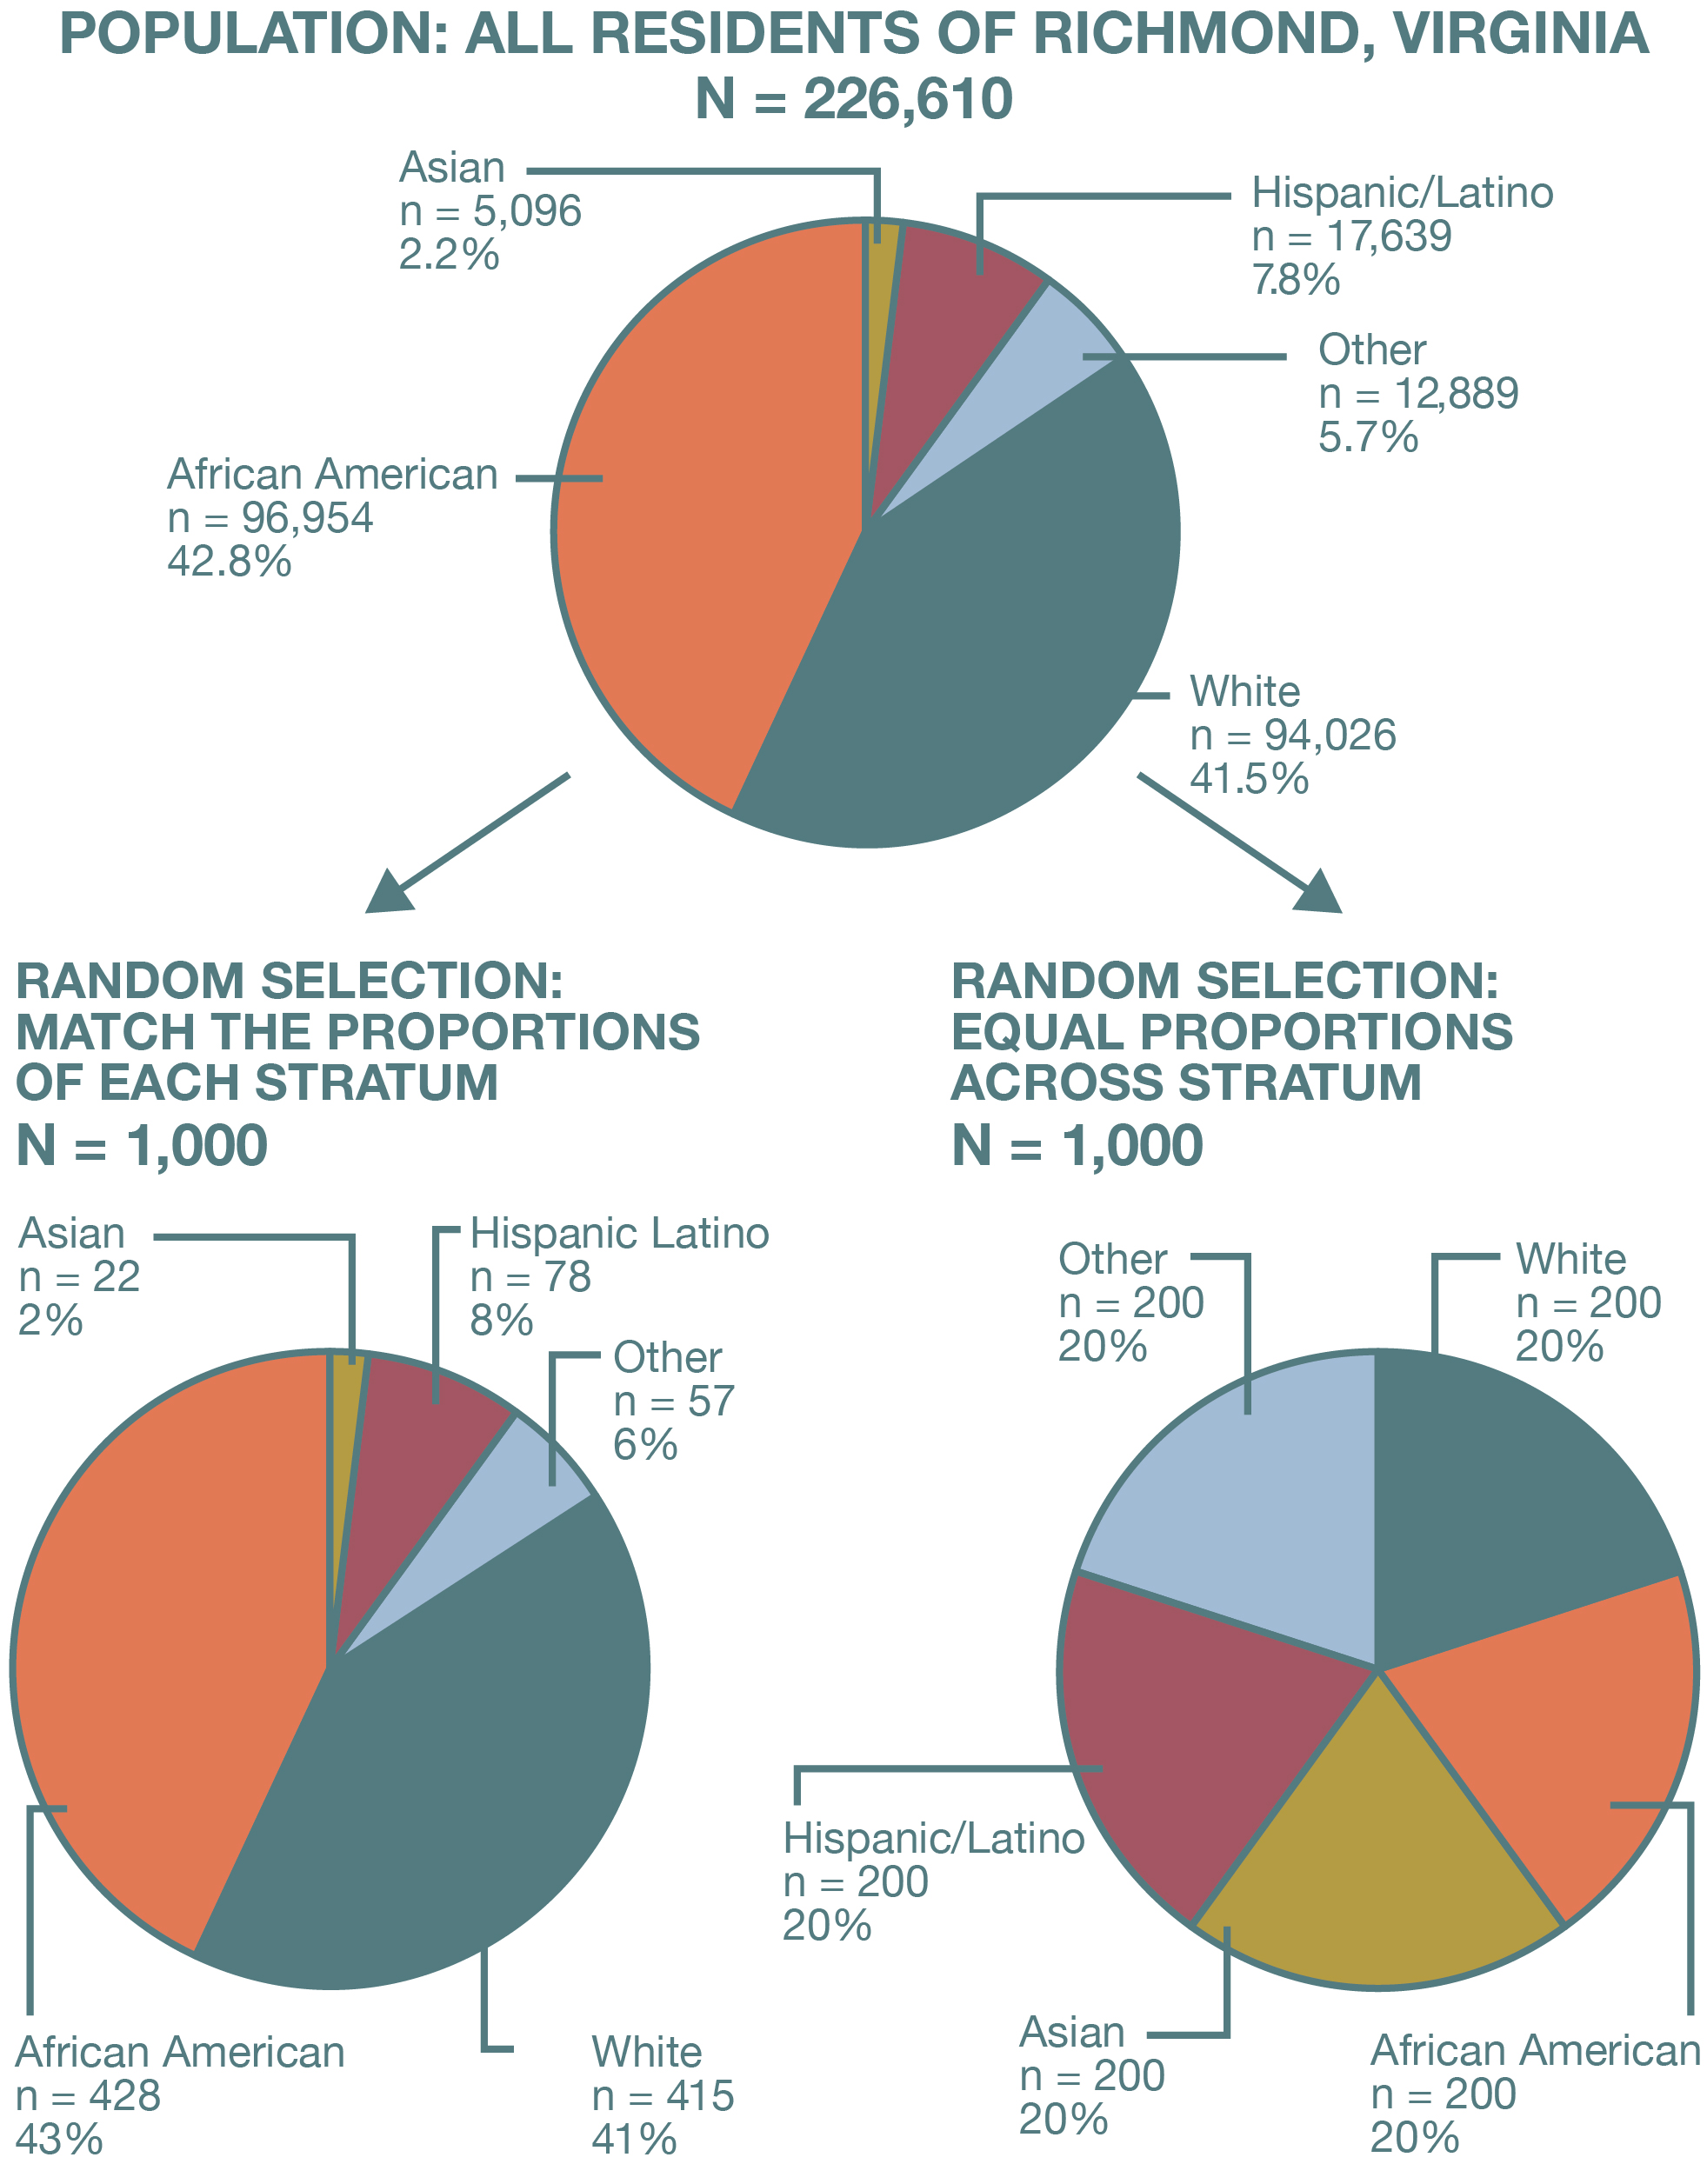
The process we have just described is proportionate stratified sampling (depicted on the left side of Figure 6.6): the sample sizes for our subgroups match their size in the population. Sometimes, though, we want to sample even more people from particular subgroups—a greater number than their proportion within the population. For example, in our survey of Richmonders’ perceptions of the police, a sample of 100 people would give us just two or three Asian respondents under proportionate stratified sampling, given that Asians account for 2.4 percent of the city’s population. Even a sample of 1,000 Richmonders would give us just 24 Asian respondents, which is lower than what we need to obtain reasonably precise statistics for a group. (A rough rule of thumb is that you need at least 30 cases to calculate meaningful statistics for a particular sample or subsample.)
In this case, we might decide to pursue disproportionate stratified sampling (depicted on the right side of Figure 6.6), which would mean that the proportions of each subgroup within the sample would not reflect those in the sampling frame (or the population of interest). Specifically, one or more smaller subgroups would be oversampled—they would end up representing a greater share of the sample than they do in the larger population. As we saw with our example of Asian respondents in Richmond, disproportionate stratified sampling can be indispensable when we are interested in learning about small subgroups because it allows us to obtain a sufficient sample size for those groups. The downside of this approach is that it messes up our statistics for the overall sample. Now we have “too many” cases from the subgroups we oversampled, and the means, standard deviations, and other numbers from our sample are no longer generalizable to the population of interest. In making sure our sample better represented particular subgroups, we inadvertently made it less than representative of the entire population.
Fortunately, we can correct for this issue by weighting our data. Weighting adjusts how much a particular case contributes to the statistics for a sample. The technical procedure for weighting is beyond the scope of this textbook, but you can think about it, in metaphorical terms, as making some cases heavier—making them matter more in any calculations—and making other cases lighter—making them matter less. Suppose we oversampled Asian respondents so that our sample included twice as many Asians than their proportion in the overall Richmond population would call for (meaning that we wound up with, say, 48 Asian respondents when a proportionate sample would be 24). When we calculate statistics for the entire sample, we would want our Asian respondents to contribute half as much to those statistics—to matter half as much in our calculations—than racial and ethnic groups that are proportionately represented in our sample. Statistical programs will handle these calculations for us, and if we weight in this way, then our statistics will remain generalizable to the population of interest. (As we will describe later, weighing is not just used in disproportionate stratified sampling as a way to compensate for oversampling; it also is widely applied to improve sampling more generally, to adjust for systematic biases in the data collection, and to make the sample more representative.)
Cluster Sampling
Thus far, in our discussion of probability samples, we have assumed that researchers will be able to access a list of population elements and then select sampling units from that list. As we pointed out earlier in the chapter, however, sometimes the sampling frame does not exist or is not readily available. For example, let’s say you are interested in the workplace experiences of public librarians in Virginia. Chances are that obtaining a list of all librarians who work for Virginia’s public libraries would be difficult. As we noted earlier, you could generate a sampling frame using techniques like random-digit dialing—say, calling all numbers with Virginia area codes, and then talking only to those respondents who identify themselves as public librarians. Yet this would clearly not be the most practical use of your time or resources, given how many phone numbers you would need to call to gather a sufficient number of public librarians for your sample.[1]
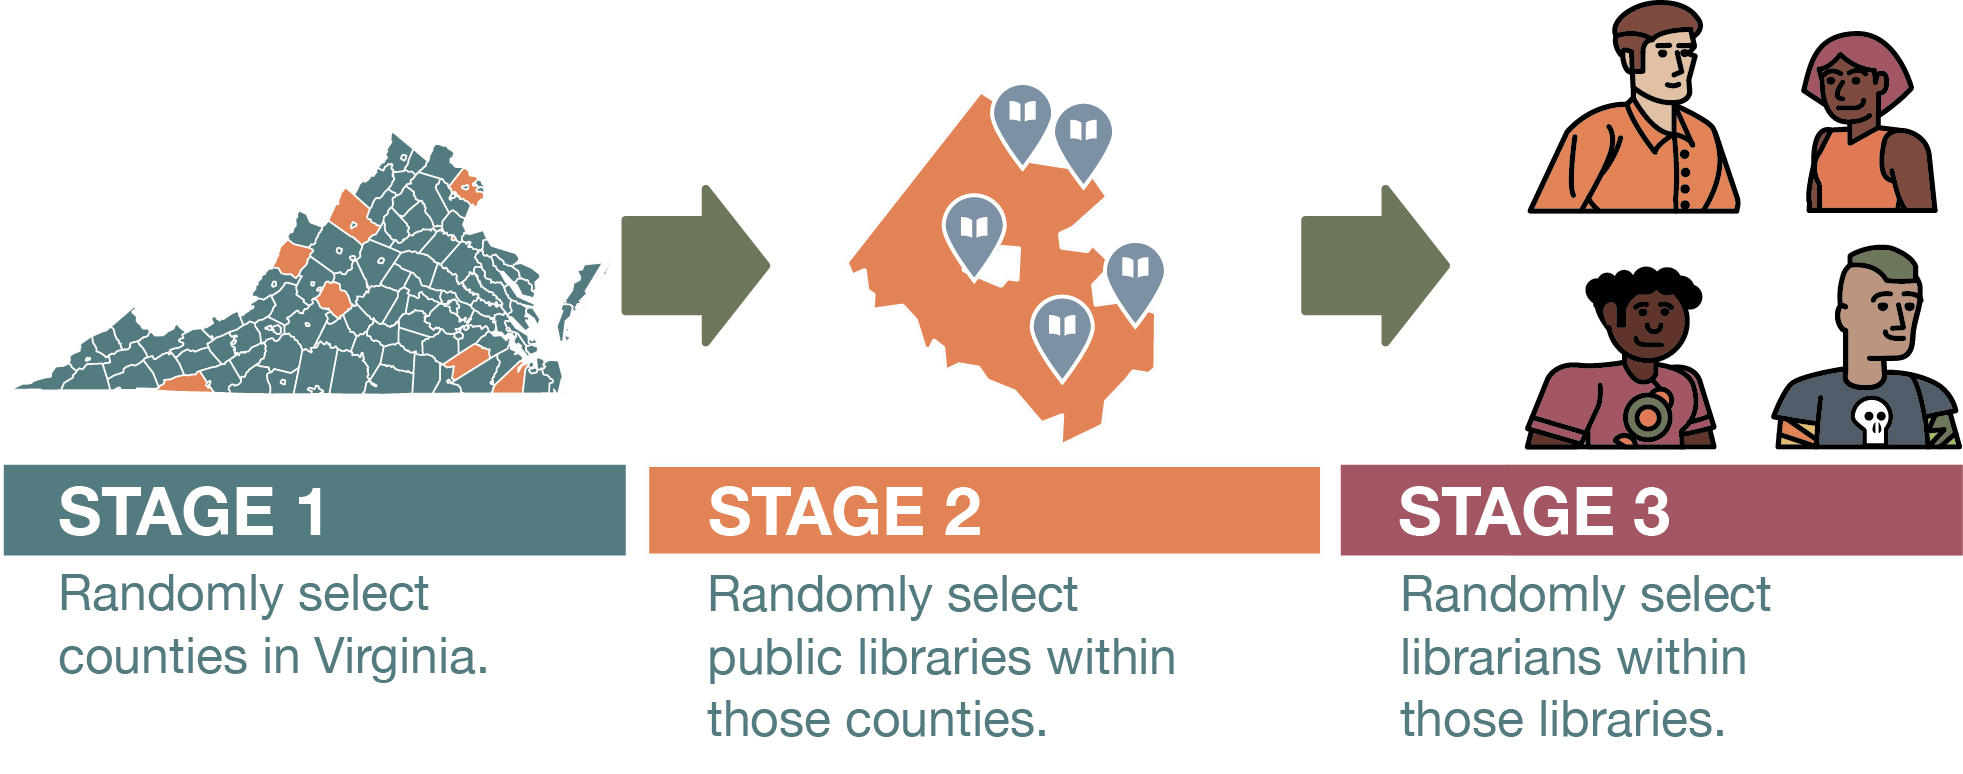
In situations like these, researchers can turn to cluster sampling. A researcher using this strategy first samples groups (or clusters) of population elements and then selects elements from within those groups. We already noted how hard it would be to get a list of all public librarians in Virginia. But what about coming up with a list of all public libraries in the state? That should not be too hard. And once you do so, you can apply cluster sampling in two stages. First, you would draw a random sample of libraries (your cluster). Then, you would draw another random sample of elements from each cluster—librarians who work at the libraries you initially selected. To make the generation of our lists even easier, we could do our cluster sampling in the three stages shown in Figure 6.7—randomly selecting (1) counties in Virginia, (2) specific libraries in each county, and (3) individual librarians.
Cluster sampling is a highly efficient method for creating sampling frames, although this approach does have some downsides. First, sampling in multiple stages introduces the possibility of greater error, as each stage is subject to its own sampling error. Furthermore, cluster sampling skews the sample in particular ways that you need to address if you want to generalize your results to the population of interest. Remember that with random sampling, the goal is to ensure that each element has the same chance of being selected. Yet using the two-stage cluster sampling approach we described in the previous example would mean that librarians at smaller libraries would be more likely to be selected. This is because our random sampling of the clusters—the libraries—would be just as likely to choose a small library as a large one, and yet more people tend to work at larger libraries—which would give the unfortunate librarians working there a lower chance of being selected for your study. Likewise, for the three-stage sampling approach, librarians who work in smaller counties would be more likely to be selected, given that smaller counties have just as much a chance to be selected as large counties.
How do sociologists deal with this problem? Consider a study by Jessica Holt and Wayne Gillespie (2008) that surveyed college students to understand what personal characteristics were associated with perpetrating violence in their intimate relationships. The researchers randomly selected 14 classes on their campus and then drew random samples of students from those classes. Clearly, however, not all college classes are the same size. If Holt and Gillespie had selected the same number of students from each class to complete their survey, then students in the smaller classes would have had a greater chance of being selected than students in the larger classes.
As Holt and Gillespie (2008:256) point out in the methods section of their paper, they used a “weighted random sample of classes” to correct for this problem. What does that mean? As we discussed earlier, statistical weighting generally involves adjusting samples to make them more representative of the population of interest. In cluster sampling, researchers adjust the sample selection process itself through a procedure called probability proportionate to size (PPS). Remember that cluster sampling with clusters of different sizes means that elements in the smaller clusters—in this case, students in the smaller classes—have a higher chance of being selected. To ensure that each element across the clusters has an equal chance of being selected, the PPS method gives the clusters themselves different chances of being selected for the sample. In their study, Holt and Gillespie used this statistical procedure to calculate different chances for 14 classes to be selected for their sample. Larger classes had a higher chance of being selected, so that ultimately each student across those 14 classes had an equal chance of being part of the study.
Choosing among Probability Sampling Strategies
Table 6.1. When to Use Probability Sampling Strategies
|
Sampling Strategy |
Suggested Use |
Key Problems |
|
Simple random sampling |
When you want the most straightforward approach to random sampling |
Requires a way to generate random numbers Requires a sampling frame |
|
Systematic sampling |
When you want an easy way to select cases for your random sample |
May create problems if your data has a pattern (periodicity) Requires a sampling frame |
|
Stratified sampling |
When you want to make sure you have sufficient numbers of cases for small subgroups in your populations |
Requires you to have detailed information about the target population Requires a sampling frame |
|
Cluster sampling |
When you don’t have a sampling frame but want to randomly sample a population |
Its multistage procedure creates additional sampling error |
In Table 6.1, we summarize the advice we’ve provided about when to use each probability sampling technique and what problems might arise. As we have stressed, using a probability sample allows researchers to be on firmer ground whenever they make conclusions about larger groups, because the results from their sample can be justifiably generalized to the population of interest. To use probability sampling, researchers need to be methodical in their approach. First, they need to find or create a sampling frame. Next, they need to select elements from that sampling frame at random—for instance, drawing individuals to survey randomly from a list. This use of random selection reduces error and bias in terms of how well the sample represents the population from which it was drawn.
Random selection is a powerful tool for social scientists. Random selection ensures the representativeness of a sample and the generalizability of any results. It is a key feature in all probability sampling approaches, which are summarized in Video 6.3.
Video 6.3. Probability Sampling Strategies. This video describes five common methods of sampling in data collection. Each has a helpful diagrammatic representation. (Note that the video also covers convenience sampling, which is a nonprobability sampling strategy discussed in the next section.)
We have discussed why you would use each of the probability sampling approaches above, but which one is best for your own study? In determining which strategy (or mix of strategies) makes the most sense, it helps to know more about your population. Simple random samples and systematic samples both require a list of all elements in your sampling frame. Systematic sampling is slightly easier in that you do not have to use a random number generator; instead, you use a sampling interval that is easy to calculate by hand.
Although both of these approaches are relatively straightforward, they may fail to capture sufficient cases with important characteristics in your population. Stratified samples can better account for periodicity by creating strata that reduce or eliminate its effects. Stratified samples also ensure that smaller subgroups are included in your sample, thus making your sample more representative of the overall population. These benefits are important, but creating strata also requires knowing information about your population before beginning the sampling process. In our example of conducting a survey about perceptions of the police in Richmond, we did know how many people of each racial and ethnic group live in the city, which enabled us to make sure our sample contained the same proportions. If the true population parameters are unknown, however, stratified sampling becomes significantly more challenging.
Stratified sampling is about ensuring sample representativeness across groups, and cluster sampling focuses on sampling within groups. Unlike the other three sampling methods, cluster sampling does not require you to have a list of all elements in your sampling frame. It is particularly useful for making claims about a large population, given that sampling frames are usually hard to come by for such groups. Because sampling occurs at multiple stages when you use a cluster sampling approach, your sampling error increases, and you also have to be careful to weight your sample selection so that the principle of random selection—an equal chance for every case to be selected—still holds.
Key Takeaways
- In probability sampling, the aim is to identify a sample that resembles the population from which it was drawn.
- The types of probability samples include simple random samples, systematic samples, stratified samples, and cluster samples.
- Probability sampling usually requires a real list of elements in your sampling frame, whereas cluster sampling can be conducted without one.
Exercises
- Of the four sample types described, which seems strongest to you? Which seems weakest? Explain.
- Imagine that you are about to conduct a study of people’s use of public parks. Explain how you could employ each of the probability sampling techniques described earlier to recruit a sample for your study.
- Now let’s say you wanted to do a survey of U.S. college students to understand the effect of drug use on academic performance. How would you obtain a random sample? How and why might this approach be different from the one you adopted for Exercise 2?
- Of course, using Virginia area codes would also fail to reach many Virginia residents whose cell phones do not have Virginia area codes. ↵
